ISSN 0101-2061 Food Science and Technology
OI:
D http://dx.doi.org/10.1590/1678-457X.11916
1 Introduction
Barley is mainly used in the production of malted products, flour or flakes for bakery, formulation of dietary products and animal feed. About 90% barley is intended for malting due to the firm texture of grains, presence of hull that protects the grain during the germination process and tradition in brewing (Food Agricultural Organization of the United Nations, 2014).
Barley is processed into malt by the malting process, which consists of hydration, germination and drying. Malting is a conversion mechanism of starch and protein in barley seeds into amino acids and fermentable carbohydrates to be used in the fermentation process by yeast and production of other components which contribute to the sensory characteristics of the malt (Schmitt & Marinac, 2007). For barley to germinate, it should keep metabolic activity and germination index after processing, drying and storage.
The processing of barley grain ensures the quality of grain in the removal of dirt, classification and drying. The removal of moisture barley should be made until the grain reaches 12% humidity so that equilibrates the product with the air of the ambient in which it will be stored, thus maintaining the physical and chemical characteristics of grains for a long period and seed viability (Souza e Silva, 2008). If the grain is damaged at the time of drying will reduce the germination rate impairing the process of malting.
The drying phenomenon is based on the moisture removal from the interior of the food by drying air, requiring the knowledge of the initial and final (equilibrium) content of moisture of the
material, relationship of water with the solid structure and transport of water from the interior of the material to its surface (Park et al., 2001).
Drying curves relate to the behavior of the material which was dried, and are obtained by data of moisture content of a product subjected to drying, in which the mass of the sample is continuously recorded as a function of time. In turn, drying rate curves are obtained by deriving the moisture data as a function of drying time (Park et al., 2007). Drying may be performed in a conventional way or intermittently.
In the conventional dryer, the grain is constantly under the action of heat until moisture content reaches the desired value. The product passes through a flow regulating mechanism that determines the exposure time to air drying, also called residence time. Continuous drying is suited for large amounts of product and has the advantage of reducing the total drying time due to elimination of steps of loading and unloading of the dryer. On the other hand, during continuous flow drying, there is a difference between moisture located on the surface and that inside the grain. The surface which is in direct contact with the air dries more than the central part (Souza e Silva, 2008).
In intermittent dryers, the product passes several times through the dryer prior to complete drying. Thus, the grain undergoes the action of heat during short time intervals, interspersed with rest periods, that is, the grain mass does not come into contact with the heated air during this period (Souza e Silva, 2008). The drying yield increases because hot air meets the
Drying kinetics of barley grains and effects on the germination index
Maiara Aparecida Bomfim SOARES1, Luiz Mario de Matos JORGE1, Flávia Daiana MONTANUCI1*
Received 04 May, 2016 Accepted 01 Oct., 2016
1 Departamento de Engenharia de Agrícola, Universidade Estadual de Maringá – UEM, Campus do Arenito, Cidade Gaúcha, PR, Brazil
*Corresponding author: flamontanuci@yahoo.com.br
Abstract
This study aimed to assess the drying kinetics of barley grains and, using mathematical modeling, to evaluate the diffusivity during drying and after drying to evaluate the effect of high drying temperatures on the seed germination index for malt production. Three drying temperatures 40, 60 and 80°C were used. The last two, 60 and 80°C, reached moisture close to ideal for storage with 6 and 4 hours respectively; at 40°C, drying process took 12 hours and would still take additional hours to reach 13% moisture on a dry basis. Drying temperature influenced the germination power. The protein content was reduced according to increased drying time. The diffusivity coefficient was higher in conventional than in intermittent drying, probably due to heat loss in the intermittent process. It was observed that higher the temperature higher is the diffusivity. Ks values of the Omoto model ranged from 1.07 to 2.05E-4.
Keywords: malt; diffusivity; thermal properties.
Practical Application: This paper presents contributions on drying system as barley kernels continues intermittent evaluating
periphery of the grains with higher moisture content, as a result of migration thereof from the center to the periphery during the product resting. This moisture redistribution, in addition to facilitate drying, reduces the occurrence of cracks due to the decrease in internal stresses in the grain. Intermittent drying is very effective, because it saves energy and the final product has better characteristics of nutritional value, color, sugar content and physical characteristics including size and lower number of cracks (Kumar et al., 2014; Souza e Silva, 2008).
Drying can be described by mathematical models, which have proved efficient in analyzing drying. Phenomenological models consider the elementary stages of mass transfer by diffusion or convection.
In this context, this study aimed to evaluate the drying kinetics of barley grains in conventional and intermittent drying methods through mathematical modeling and to observe the effect of high drying temperatures on seed germination index for malt production.
2 Material and methods
This study was conducted with the cultivar BRS BRAU donated by the Agricultural Cooperative located in Guarapuava, State of Paraná. The cultivar comes from the growing season of January 2015. All samples were stored 5 °C until the tests.
2.1 Physical and chemical composition, germination energy and germination index of Barley seeds
The chemical composition was evaluated according to the method of the Association of Official Analytical Chemists (Association of Official Analyticasl Chemists, 1995). The moisture content was determined by the oven drying method at 105 °C; protein, by the micro Kjeldahl method using a conversion factor of 6.25; lipids, by Soxhlet extraction; ash, by furnace incineration at 550 °C.
For determination of the barley germination energy, it was used the adapted EBC method (European Brewery Convention, 1998), with a hundred grains selected and germinated in Petri dishes of 90 mm with two layers of filter paper wetted with 4 mL water. The sample was placed in a temperature controlled environment at 16 °C for three days. Germinated seeds were counted after 24 h, 48 h and 72 h. The counting after 72 hours estimates seed germination energy.
The germination index was calculated from the results of germination energy by the EBC method (European Brewery Convention, 1998) using Equation 1.
( 24 48 72) ( 24 48 72)
10 * / 2 3
IG= n +n +n n + n + n (1)
In which n24, n48, n72 are the number of seeds germinated within 24h, 48h and 72h.
2.2 Drying kinetics
Tests were carried out in an air circulation oven TECNAL TE-394/3(Brazil) with controlled temperature. In each test, was dried 300 g barley grains at 40, 60 and 80 °C. An experiment
was performed with conventional drying in the continuous system and the other with intermittent drying. In intermittent drying, grains were exposed to the drying temperature for one hour and then left at rest for an hour at room temperature in desiccator to not get wet, this process being repeated until the end of drying. The tests were performed in duplicate for each temperature, totaling the collection of four samples for each analysis time. Samples were collected every 30 minutes in the first four hours and then every hour until the end of drying. Moisture and density was analyzed in the samples taken.
2.3 Determination of moisture content
The moisture content of the barley samples was determined in quadruplicate using the method AOAC 925.10 (Association of Official Analyticasl Chemists, 1995) on dry matter percentage.
2.4 Determination of density, volume, average radius and Protein
To determine the density of grains, at each sampling time, were taken approximately 50 units of barley grains. These were weighed and then evaluated for their volume using a 50 mL-measuring cylinder initially containing 10 mL distilled water. Absolute density was calculated by dividing the mass of grains by the volume of water displaced, in which it was measured the volume displaced after the introduction of the grains. The average radius was evaluated from the volume of a grain considering it to be spherical. All analyzes were made at room temperature. Protein analysis was performed after the drying process by the micro Kjeldahl method using a conversion factor of 6.25 (Association of Official Analyticasl Chemists, 1995).
2.5 Mathematical modeling
Phenomenological models
Phenomenological models consider the elementary steps of mass transfer by diffusion (Fan et al., 1962; Hsu, 1983).
Diffusion model
Diffusion of water in a sphere can be represented by Equation 2.
2
2
2
M M M
D
t r r r
∂ = ∂ + ∂
∂ ∂ ∂ (2)
The general solution of Fick’s second law in spherical coordinates is obtained by Crank (1975) and given by Equation 3:
( )
( )
2 2
2 2 2
0 1
6 1
exp
t s e
s n
M M D n
MR t
M M n r
π π ∞ = − − = − = +
∑
(3)spherical grain at a given instant. In the case of a long hydration time, the solution presented in the form of summation may be simplified by using only the first term given by Equation 4 with an error lower than 0.1% (Bello et al., 2004).
( )
2
2
2 0
( t s) 6 Der t
s M M MR e M M π π − − = =
− (4)
Mt is the moisture content as a function of time (g/g), M0 is the initial moisture content (g/g), Ms is the moisture content at saturation (g/g), De is the effective diffusivity (m2/s), t is the time (h), r is the radial coordinate (m).
Equation 5 is obtained by rearranging Equation 4.
( ) 1 22
2 e D t Ln MR r π
= − − (5)
Effective diffusivity was calculated by Equation 5 using slopes of a linear regression of ln (MR) on time. Usually, the effective diffusivity is used, because the limited information of the moisture moving mechanism during the hydration process. Temperature is a critical parameter that affects the diffusion in food. The dependence of diffusion on temperature is described by the Arrhenius equation, Equation 6.
0 a ga E R T e
D D e
−
= (6)
De is the effective diffusivity, D0 diffusivity at the reference
temperature, Ea activation energy, Rg universal constant of gases, Tg temperature (K).
Omoto model
Starting from a mass balance in transient regime for the water contained in the grain and, considering the water concentration as uniform inside the grain, it is obtained Equation 7, which is the basis of the mathematical model developed (Omoto, 2006; Omoto et al., 2009). This equation represents the variation in the mass of water in the grain (ρAV) over time (t), where A is the external area of the grain; V is the grain volume; and NA is the water mass flow (Kg.m–2h–1).
( A ) A
d V
N A dt
ρ
= (7)
Considering the constant volume, the spherical grain geometry with radius ro, setting the mass flow as NA = Ks (ρeq – ρA) and making up these substitutions in Equation 7, one comes to the final model described in Equation 8. This model has two parameters: the mass transfer coefficient Ks (m.h–1) and the water concentration in the grain at equilibrium, ρeq, (kg.m–3) and can be solved by taking as initial condition that at the start of drying, t = 0, the concentration of water in the grain is uniform and known, ρA = ρAo.
( )
(
)
0 3 A s Aq A d K dt rρ ρ ρ
= − − (8)
Importantly, the model of Omoto (2006) was initially developed for hydration of grains, but it can be easily adapted
to the drying process, by including a minus sign in Equation 8, whose analytical solutions can be readily obtained.
3 Results and discussion
3.1 Physical and chemical composition
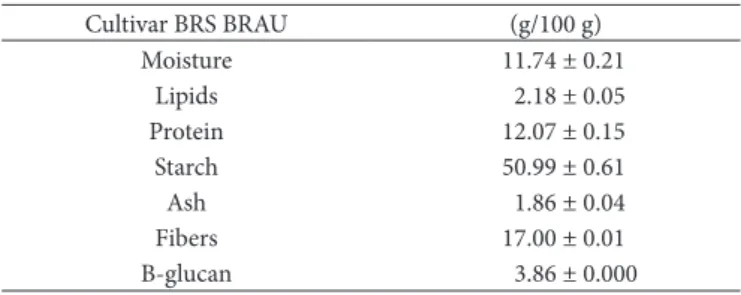
Table 1 presents the results for the chemical composition of barley grain. Data on moisture content on a wet basis, lipid, protein, starch, ash, dietary fiber and β-glucan were consistent with data reported by Oscarsson et al. (1996) and Andersson et al. (1999), Montanuci et al. (2013), Montanuci et al. (2014a), for different cultivars grown in different climatic conditions.
3.2 Drying kinetics, germination energy and germination index of barley seeds
Figure 1 depicts the conventional and intermittent drying kinetics, the results are presented in g/100g and when multiplied by 100, we obtain the result as a percentage (g/100g*100). At 40 °C, a longer drying time was required compared to the other temperatures, as well as in the intermittent experiment. In conventional experiments, moisture on a dry basis was 11.3% with 4 hours of drying at 80 °C, 11.2% with 7 hours at 60 °C and 15.3% with 11 hours at 40 °C. In this way, obviously, at 40 °C, it is necessary a longer drying time to achieve a moisture content of 13% on a dry basis, being suitable for storage for a long time without molding. In the intermittent drying at 80 °C, the grain moisture reached 11.5% on a dry basis with 6 hours; at 60 °C moisture was 12% with 7 hours and at 40 °C, 15.9% moisture with 12 hours.
In agreement with Markowski et al. (2010), there is a clear effect of temperature on drying kinetics; the higher the temperature, the shorter the drying time. All drying curves are characterized by a distinct initial heating phase, followed by a rapid stabilization in the second phase.
Values of germination energy and germination index, for conventional and intermittent drying, in Table 2, show the influence of time in drying hours. Germination energy and germination index ranged from 93 to 82% and 4.39 to 4.26% in drying at 40 °C, 93 to 63% and 4.49 to 4.14% in drying at 60 °C, and from 9 to 5% and 3.08 to 2.50% in drying at 80°C. The lower the drying temperature, the higher the seed germination energy. The drying temperature of 80 °C is very high for the drying process, by damaging the cell structure and impairing seed germination. In the beginning of the drying process, moisture is high because the grains were soaked unable to activate the metabolism to germinate, so the seeds have lower germination
Table 1. Physical and chemical composition of the cultivar BRS BRAU.
Cultivar BRS BRAU (g/100 g)
Moisture 11.74 ± 0.21
Lipids 2.18 ± 0.05
Protein 12.07 ± 0.15
Starch 50.99 ± 0.61
Ash 1.86 ± 0.04
Fibers 17.00 ± 0.01
energy, and after the drying process, values increased for every temperature in both intermittent and conventional methods. The results are consistent with those of Montanuci et al. (2014b) ranging 60-88% of germination energy and 3.87 to 4.44% for germination index.
Values of activation energy are not enough, but express the level of post-harvest maturation and acceptability of a given malt sample. For this reason, the germination index is entered as a characteristic of germination rate. According to Frančáková & Líšková (2009), the germination index is considered the best indicator of the depth of dormancy. High germination index values refer to high quality and homogeneity of the malt.
The protein content analysis (Table 3) checked for the influence of high drying temperatures on the final protein content. There was a decrease in the content in all treatments, influenced by the drying time. Drying at 80 °C showed higher protein content than in other temperatures because the drying time was shorter, averaging 5 hours, while at 40 °C and 60 °C, it took 12 and 7 h to dry, respectively, indicating an average reduction of 16% protein content. There was no difference in the reduction of protein content between conventional and intermittent processes.
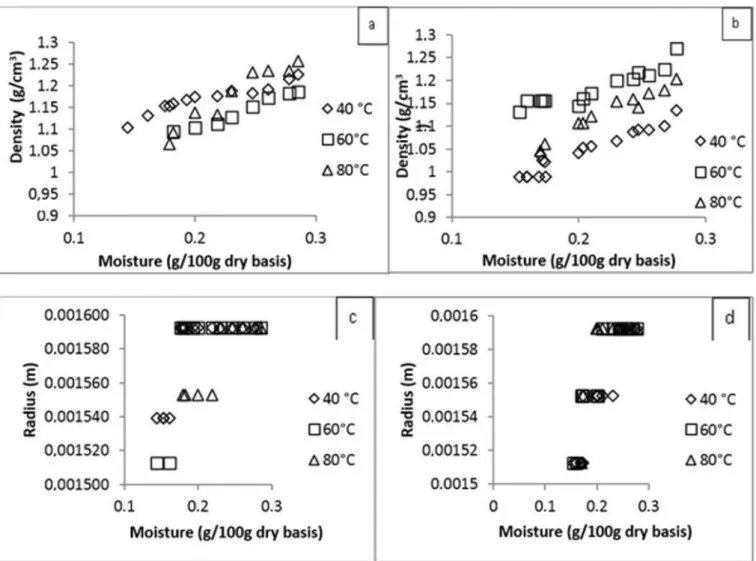
Figure 2a, b illustrates the increase in density values according to the moisture decrese, with an average density at the end of the drying of 1.12 g/cm3. According to Souza e Silva (2008), the lower the moisture content, the greater the density.
Excessive drying of a product at very high temperatures damage the material, which thereby will have lower density.
Figure 2c, d shows the decrease in grain radius considering the grains as spherical. In both experiments, the grains have shrunk during the drying process, influenced by temperature. In conventional experiments, there was a reduction from 2.5, 6 and 7 hours, with moisture content of 21.8, 17.5 and 16.1% on drying at 80, 60 and 40 °C, respectively. In the intermittent experiment, the decrease was gradual with 2.5 hours and after 6 hours drying at all temperatures.
According to Markowski et al. (2010), the grain size during drying decreases mainly in the first phase, suggesting that there is no internal or external mass transfer resistance in this period. It can result in apparent moisture on the surface of the grains
Table 2. Germination energy (EG%) and Germination Index(IG%) for every drying hour.
Time (hours) 40 °C 60 °C 80 °C
EG(%) IG(%) EG(%) IG(%) EG(%) IG(%)
Conventional
1 86.0c 4.30d 59.0e 4.15b 5.0c 2.80c
4 88.0c 4.38c 74.0c 4.14b 7.0a 2.57d
7 91.0b 4.39c 93.0a 4.49a 6.0b 3.08b
12 95.0a 4.50b - - -
-Intermittent
4 86.0c 4.30d 70.0d 4.10c 7.0a 2.57d
7 93.3ab 4.68a 88.3b 3.93d 7.0a 3.58a
12 94.3a 4.50b - - -
-- It was not analyzed. Different letters in the same column indicate significant differences at 5% level of significance between samples.
Figure 1. Drying kinetics of barley grains: (a) conventional system; (b) intermittent system.
Table 3. Protein content after drying.
Conventional Intermittent Control
(grain before drying)
12.07 ± 0.107a 12.07 ± 0.107a
40 °C 10.33 ± 0.18c 9.94 ± 0.05c
60 °C 10.34 ± 0.27c 10.35 ± 0.27c
80 °C 11.55 ± 0.10b 11.14 ± 0.14b
with increasing cohesiveness in the surface layer, after a short drying period, the free moisture is evaporated.
3.3 Diffusivity
Diffusivity is an important transport property, and information of this property is needed for the design and optimization of all processes involving the internal moisture movement (Prasad et al., 2010). The graph of Ln [(Mt-Ms)/(M0-Ms)] versus time shown in Figure 3a, b generates a straight line, from which, it can be calculated the value of the effective diffusion coefficient. According to Markowski et al. (2010), knowledge of diffusivity of grain moisture is essential to describe the moisture transport phenomenon of grains during drying or hydration.
The diffusivity coefficient (Table 4) varied between 4.55 and 5.43 E-08 m2/s, in conventional drying, and between 2.43 and 5.47E-08 m2/s, in intermittent drying; the higher the temperature, the greater the diffusivity. According to Prasad et al. (2010), the increase in temperature changes the diffusion rate and affects the absorption behavior. An excessive temperature increase can damage the integrity of the structure, promote gelatinization of starch and affect weight gain behavior.
The model of Crank (1975) considers a constant and uniform temperature during the drying time, and it is not applied to intermittent drying that varies the temperature between heating and room temperature. In Figure 3c, it was calculated diffusivity for each drying interval, first hour with heating, second hour at room temperature and so on. The diffusivity was higher at drying temperature and decreases at room temperature. In the first two hours, diffusivity had values near the oven temperature and at room temperature, in the third hour, diffusivity at 60 and 80 °C decreased because the grains lost heat at room temperature, and took long to reach the oven temperature; in the fourth hour, when the beans have already equilibrated the temperature again, showed diffusivity similar to the initial. It represents a disadvantage of
Figure 2. Density of barley grains during the (a) conventional and (b) intermittent drying processes; (c) variation in radius of barley grain during
the conventional and (d) intermittent drying processes.
Table 4. Mean diffusivity.
Conventional Intermittent
40 °C 4.55E-08b 2.43E-08c
60 °C 4.29E-08c 2.56E-08b
80 °C 5.43E-08a 5.47E-08a
intermittent process, with a slower drying, but the final grain quality is better compared with the conventional method.
3.4 Omoto model
The values of diffusion coefficients (Ks) obtained at each temperature and their respective coefficients of determination (r2) are presented in Table 5. The r2 values ranged from 0.936 to 0.959, indicating good fit of the model to experimental data. The Ks values increased with temperature rise, indicating increased initial velocity of water desorption of grains at higher temperatures.
Similarly to the model of Crank, the Omoto model considers uniform moisture content and temperature, so it was calculated Ks values for the first four hours for the intermittent process. Values of diffusivity over time are illustrated in Figure 4a. As well as in the model of Crank, diffusivity was similar in the first two hours, in the third hour, it fell due to loss of heat to ambient temperature, and in the fourth hour, it showed intermediate values between the first and second hour.
It can be seen that Ks has an upward trend depending on the temperature, which can be well correlated from fitting a mathematical equation similar to the Arrhenius, Equation 9.
0
1
s
lnK lnk E
T
= − (9)
Ks values obtained were related to the temperature through the Arrhenius equation, as shown in Figure 4b, c. Using the linear regression parameters, we obtained K0 parameters, thus
Figure 3. Determination of the diffusion coefficient of barley grains during the drying process (a) conventional and (b) intermittent; (c) diffusivity
over time during the intermittent drying process.
Table 5. Mean Ks parameters and their respective coefficients of
determination (r2).
Ks(m/h) ρA (Kg/m3) r2
Conventional 40 °C
1.07E-4a 0.132b 0.955
60 °C 1.81 E-4e 0.115d 0.959
80 °C 2.05 E-4f 0.108e 0.936
Intermittent 40 °C 1.40 E-4c 0.137a 0.928
60 °C 1.20 E-4b 0.120c 0.947
80 °C 1.77 E-4d 0.103f 0.941
Figure 4. (a) Ks values over time in the intermittent drying process; (b) determination of K0 parameters in conventional drying and (c) intermittent drying.
obtaining good fit to the experimental data r2. The K
0 values were 0.037 m/h in the conventional drying and 0.0011 m/h in intermittent drying.
Despite the importance of knowing the Ks for the design, simulation, optimization and analysis of processes involving the hydration of grains, there are few studies in literature as Omoto (2006) and Omoto et al. (2009) addressing the determination of this transport property, pointing to the need to expand the studies on this subject.
4 Conclusion
Drying kinetics at 60 and 80 °C was faster and reached moisture close to ideal for storage; at 40 °C, drying took 12 hours still requiring longer to reach moisture of 13% for storage. The drying temperature affected the germination power after drying. The lower the drying temperature, the higher the seed
ellipsoid. Journal of Food Engineering, 96(3), 380-387. http://dx.doi. org/10.1016/j.jfoodeng.2009.08.011.
Montanuci, F. D., Jorge, L. M. M., & Jorge, R. M. M. (2013). Kinetic, thermodynamic properties, and optimization of barley hydration.
Food Science and Technology (Campinas.), 33(4), 690-698. http://
dx.doi.org/10.1590/S0101-20612013000400014.
Montanuci, F. D., Perussello, C. A., Jorge, L. M. M., & Jorge, R. M. M. (2014a). Experimental analysis and finite element simulation of the hydration process of barley grains. Journal of Food Engineering, 131, 44-49. http://dx.doi.org/10.1016/j.jfoodeng.2014.01.011.
Montanuci, F. D., Jorge, L. M. M., & Jorge, R. M. M. (2014b). Effect of time and temperature on the hydration process of barley grains.
Heat and Mass Transfer, 51(3), 363-372. http://dx.doi.org/10.1007/
s00231-014-1417-y.
Omoto, E. S. (2006). Modelagem da hidratação de grãos de ervilha
segundo a hipótese de volume constante (Dissertação de mestrado,
124 p.). Universidade Estadual do Paraná, Maringá.
Omoto, E. S., Andrade, C. M. G., Jorge, R. M. M., Coutinho, M. R., Paraíso, P. R., & Jorge, L. M. M. (2009). Modelagem matemática e análise da hidratação de grãos de ervilha. Ciência e Tecnologia de Alimentos, 29(1), 12-18. http://dx.doi.org/10.1590/S0101-20612009000100003. Oscarsson, M., Andersson, R., Salomonsson, A. C., & Aman, P. (1996). Chemical composition of barley samples focusing on dietary fibre components. Journal of Cereal Science, 24(2), 161-170. http://dx.doi. org/10.1006/jcrs.1996.0049.
Park, K. J., Antonio, G. C., Oliveira, R. A., & Park, K. J. B. (2007).
Conceitos de processos e equipamentos de secagem (121 p.). Campinas:
UNICAMP.
Park, K. J., Yado, M. K. M., & Brod, F. P. R. (2001). Study of the Barlett pear (Pyrus sp) drying in slices. Ciência e Tecnologia de Alimentos, 21(3), 288-292.
Prasad, K., Vairagar, P. R., & Bera, M. B. (2010). Temperature dependent hydration kinetics of Cicerarietinum splits. Food Research International, 43(2), 483-488. http://dx.doi.org/10.1016/j.foodres.2009.09.038. Schmitt, M. R., & Marinac, L. (2007). Beta-amylase degradation by
serine endoproteinases fromgreen barley malt. Journal of Cereal
Science, 47(3), 480-488. http://dx.doi.org/10.1016/j.jcs.2007.06.002.
Souza e Silva, J. S. (2008). Secagem e armazenagem de produtos agrícola.
Beneficiamento de Grãos, 1(13), 307-323.
Acknowledgements
The authors thank the Cooperativa Agraria barley donations, and the campus cidade gaucha for the availability of laboratories.
References
Andersson, A. A. M., Andersson, R., Autio, K., & Aman, P. (1999). Chemical composition and microstructure of two naked waxy barleys. Journal of Cereal Science, 30(2), 183-191. http://dx.doi. org/10.1006/jcrs.1999.0267.
Association of Official Analyticasl Chemists – AOAC. (1995). Official methods of analysis of Association of Official Analytical Chemists
(16th ed., Vol. 2). Arlington: AOAC.
Bello, M., Tolaba, M., & Suarez, C. (2004). Factors affecting water uptake of rice grain during soaking. Lebensmittel-Wissenschaft &
Technologie, 37(8), 811-816.
Crank, J. (1975). The mathematics of diffusion. Oxford: Oxford University Press.
European Brewery Convention – EBC. (1998). Analytica-EBC,
EBC-analysis. Nurnberg: EBC.
Fan, L. T., Chu, P. S., & Shellenberger, I. A. (1962). Volume increase of kernels of corn and sorghum accompanying absorption of liquid water. Biotechnology and Bioengineering, 4(3), 311-322. http://dx.doi. org/10.1002/bit.260040307.
Food Agricultural Organization of the United Nations – FAO. (2014).
BARLEY: Post-Harvest Operations. Rome: FAO.
Frančáková, H., & Líšková, M. (2009). Dormancy of malting barley in relation to physiological parameters of barley grain. Acta Fytotechnica
et Zootechnica, 12, 20-23.
Hsu, K. H. (1983). A diffusion model with a concentration-dependent diffusion coefficient for describing water movement in legumes during soaking. Journal of Food Science, 48(2), 618-622. http:// dx.doi.org/10.1111/j.1365-2621.1983.tb10803.x.
Kumar, C., Karim, M. A., & Joardder, M. U. H. (2014). Intermittent drying of food products: a critical review. Journal of Food Engineering, 121, 48-57. http://dx.doi.org/10.1016/j.jfoodeng.2013.08.014. Markowski, M., Białobrzewski, I., & Modrzewska, A. (2010). Kinetics