Received 18 Nov., 2013 Accepted 31 Jan., 2014 (006222)
1 School of Agriculture and Food Engineering, Federal University of Goiás – UFG, Goiânia, GO, Brasil, e-mail: [email protected] *Corresponding author
Drying kinetics of potato pulp waste
Webber Tavares de CARVALHO1, Tatianne Ferreira de OLIVEIRA1*,
Flávio Alves da SILVA1, Márcio CALIARI1, Manoel Soares SOARES JÚNIOR1
1 Introduction
Potato (Solanum tuberosum L.) is a tuberous crop of great importance in the world economy and feeding. It is characterized as the fourth agricultural product most grown crop worldwide, and in Brazil it is among the ten most consumed and the most economically relevant vegetable (Pinelli et al., 2006). It is widely consumed fresh, and its industrialization is on the rise, especially the production of starch and chips (Agrianual, 2011). However, an apparent problem of this type of industrialization is the production of highly polluting waste, which represents not only loss of raw materials, but also additional expenses in the treatment for future disposal in the environment.
If appropriate technologies were used, agro-industrial waste could be converted into commercial products or raw materials for secondary processes (Pelizer et al., 2007). Aiming at reducing raw vegetable costs of in industrial processes, studies have been carried out for the transformation of residues into by-products thus adding value to the system as a whole (Laufenberg et al., 2003; Soares Júnior et al., 2009, 2011; Sena et al., 2012; Dias et al., 2014).
In the industrial processing of potato chips, waste production mainly occurs after operations such as raw material peeling, slicing, and washing. Potato pulp waste (PPW) is one type of waste generated and is composed of water, cell residues, intact starch molecules, and small pieces of bark (Fernandes et al., 2008). The possible use of PPW as an ingredient in the production of another food product can bring benefits, making it a product with added value, which is able to be used in other supply chains. In addition to the economic benefits, positive environmental factors may result from this measure.
The strategy for using this waste from potato industrialization would be to convert it into a modified dry form that could be stored as flour and be suitable for various applications, which
would make it suitable as an ingredient in the industry in other product lines, such as the fried snacks and extruded or baked products. The drying operation is a method by which free water is extracted from the food, which directly contributes to stability, both microbiologically and in terms of deteriorative enzymatic reactions such as browning and rancidity. By decreasing the water content, these reactions are decelerated, if not avoided, ensuring longer shelf life to the product (Costa, 2007).
The mathematical modeling of a dynamic system can be defined as a set of equations that can predict the accuracy of the process. Mathematical models can be quite different depending on the system considered and the particular circumstances of each function, and some models can be more appropriate than others (Ogatha, 2003). There are a few studies on the mathematical modeling drying kinetics of potato slices (Aghbashlo et al., 2009), but none on the PPW although there are some on byproducts of other tuberous plants, such as peels (Vilhalva et al., 2012) and fibrous mass of cassava (Castiglioni et al., 2013).
The present study aimed to understand the kinetics of the drying process of PPW under various experimental conditions through mathematical modeling of drying kinetics of potato pulp wasteand to select the model that best fits the experimental results of PPW drying considering the sum of the scores assigned to the four evaluated statistical parameters.
2 Materials and methods
2.1 Sample collection and PPW drying
The liquid residues derived from washing cv Atlantic potatoes preparing for the production of chips and shoestring in the Cicopal Ltda Company (Senador Canedo-GO) were Abstract
Potato pulp waste (PPW) drying was investigated under different experimental conditions (temperatures from 50 to 70 °C and air flow from 0.06 to 0.092 m³ m–2 s–1) as a possible way to recover the waste generated by potato chip industries and to select
the best-fit model to the experimental results of PPW drying. As a criterion to evaluate the fitting of mathematical models, a method based on the sum of the scores assigned to the four evaluated statistical parameters was used: regression coefficient (R2),
relative mean error P (%), root mean square error (RMSE), and reduced chi-square (χ²). The results revealed that temperature and air velocity are important parameters to reduce PPW drying time. The models Midilli and Diffusion had the lowest sum values, i.e., with the best fit to the drying data, satisfactorily representing the drying kinetics of PPW.
exp( e)
Y= −kt (3)
exp( )
Y= ×a −kt (4)
2
1
Y= +at+bt (5)
exp( e)
Y= ×a −kt +bt (6)
( )
exp( ) 1 exp( )
Y= ×a −kt + −a × −kbt
(7)
exp( )
Y= ×a −kt +c (8)
in which: Y = dimensionless moisture, k = kinetic constant (min–1), t = time (min), a, b, c: experimental constants
(dimensionless), e: exponent.
The dimensionless moisture value was calculated by Equation 9. However, this equation was simplified because the relative humidity of the drying air was continually modified, making it impossible to reach moisture equilibrium [XBS (eq)], which led to the use of Equation 10 (Bozkir, 2006).
( ) ( )
( )
(0) ( )
BS BS
BS BS
X t X eq
Y t
X X eq
− =
− (9)
( ) ( )
(0) BS
BS
X t Y t
X
= (10)
in which: Y = dimensionless moisture at time t, XBS(t) = moisture at time t (db), XBS (0) = initial moisture content (db), XBS (eq) = equilibrium moisture content (db).
Statistical analysis of the experimental drying data was performed by non-linear regression using the Statistica 7.0 software (Stasoft, Tulsa, USA). The criterion for choosing the best adjustments was based on the determination of the regression coefficient (R2) (Oliveira et al., 2012) and the value of
the other three criteria: relative mean error (P (%)), root mean square error (RMSE), and reduced chi-square (χ²), according to collected between January and February 2011 in high-density
polyethylene containers (HDPE). The PPW samples were homogenized and submitted to sedimentation for 15 min. The supernatant was removed and the sediment portion was dried to reach the moisture content (wb) of 12 g 100 g–1. The chemical
compositions of the PPW (db) were determined according to official methods of AOAC International (Association of Official Analytical Chemists, 2006). The analyses were performed in triplicate in samples submitted to drying at temperature of 60 °C and air flow of 0.076 m³ m–2 s–1.
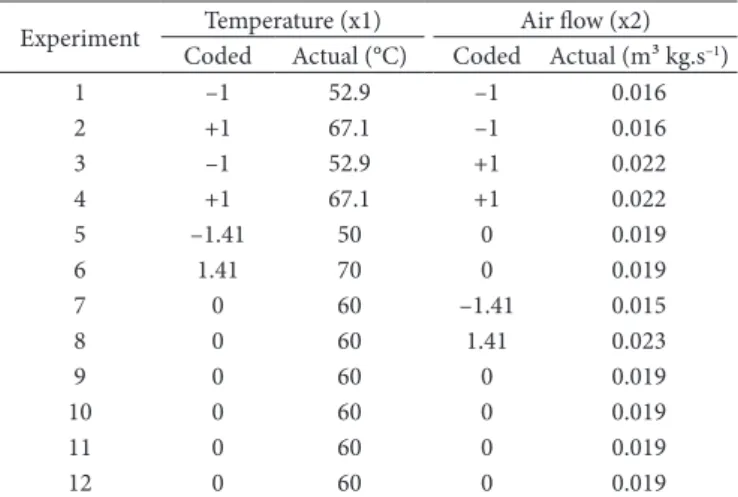
Drying was performed using a forced air circulation oven with an axial flow fan, an electric heater with voltage variator, and flow control valves. the inner chamber of the oven measured 1.18 m of height, 0.70 m of width, and 0.65 m of depth and included a support for five trays (0.50×0.50 m). In order to study the drying process, rotational central composite design was used (Table 1). The temperature of the internal drying air was determined using a thermostat at 50, 52.9, 60, 67.1, and 70 °C. The temperature levels were established to cover the range below and above potato starch gelatinization temperature (78-82 °C) (Blahovec et al., 2012).
The trays had hollow bottom to allow air flow, and the wind speed was measured using an anemometer (Icel, model NA-3070) placed at the only air flow exit at the top of the drying equipment. This cylindrical opening (anemometer) was 3.31 10–3
m2. The air speed values were multiplied by the opening area
to obtain the volumetric air flow (m3 s–1), which were divided
by the tray area (0.25 m2) (Equation 1), to obtain the following
air flow values: 0.06, 0.064, 0.076, 0.088, and 0.092m³ m–2 s–1,
respectively.
AIR NA
V A
AF TA
×
= (1)
where: AF: Air flow (m³ m–2 s–1); V
AIR: air speed (m s –1); A
Na:
anemometer opening area (m²), and TA tray area (m²). The initial moisture of PPW before drying was 54.2 g 100 g–1, determined on wet basis (wb). Drying was stopped when
the material moisture content (wb) was less than 12 g 100 g–1.
Weighing of trays, initially containing 1 kg of sedimented PPW in dry basis (d.b.) were performed every 5 min the first 60 min of process and then every 10 min for 130 min and thereafter every 20 min. The dried material was stored in threaded polypropylene (PP) containers, sealed with polyvinyl chloride film (PVC), and stored at –18 °C.
2.2 Mathematical modeling of the drying kinetics
Seven mathematical models widely used in literature for drying experiments with food material were studied: Lewis, Page, Henderson and Pabis, Wang and Singh, Midilli, Diffusion Approach, and Logarithmic (Martinazzo et al., 2007). The mathematical models used in the drying kinetics of PPW are respectively represented in Equations 2-8.
exp( )
Y= −kt (2)
Table 1. Experimental design for drying the potato pulp waste as a
function of the drying variables in coded values and actual values.
Experiment Temperature (x1) Air flow (x2) Coded Actual (°C) Coded Actual (m³ kg.s–1)
1 –1 52.9 –1 0.016
2 +1 67.1 –1 0.016
3 –1 52.9 +1 0.022
4 +1 67.1 +1 0.022
5 –1.41 50 0 0.019
6 1.41 70 0 0.019
7 0 60 –1.41 0.015
8 0 60 1.41 0.023
9 0 60 0 0.019
10 0 60 0 0.019
11 0 60 0 0.019
AMP amp
k
= (15)
in which: N = number of classes; n = number of observations for each statistical factor; amp = amplitude of the class; and AMP = amplitude of sample data observed for each statistical factor.
Next, the scores a sum of scores of each experiment for each statistical factor in each model were summed in order to obtain a single value per model. This number was used to compare the models; the model with the lowest value would be the most appropriate, taking into account the four statistical factors simultaneously. The data of each of the 12 drying experiments were also treated by ANOVA to determine the significance of the linear, quadratic, and interaction effects of temperature and air flow on PPW drying.
3 Results and discussions
3.1 Drying kinetics of potato pulp waste
The importance of temperature (x1) in the drying process of PPW, experiments 2 and 4, both at temperature of 67.1 °C, showed drying time far shorter than those of experiments 1 and 3, 52.9 °C (Figure 1a). Several other authors have identified temperature as the factor that most affects the drying kinetics of food products, such as drying cashews (Gouveia et al., 2002), sliced potato, and apple (García et al., 2008), and isoflavone during soybean drying (Niamnuy et al., 2012). These results also showed that variable air flow (x2) did not show the same level of significance (Table 2).
Experiments 2 and 4, although conducted at the same temperature, had different air flow values, and those of experiments 4 and 3 were equal to or greater than 1 and 2. However, even with a difference in the air flow values, the curves were nearly coincident, and the drying time of experiment 4 was only 10 min. Similar behavior was observed in experiments 1 and 3, in which, despite the small difference observed in Equations 11, 12 and 13, which took into account the responses
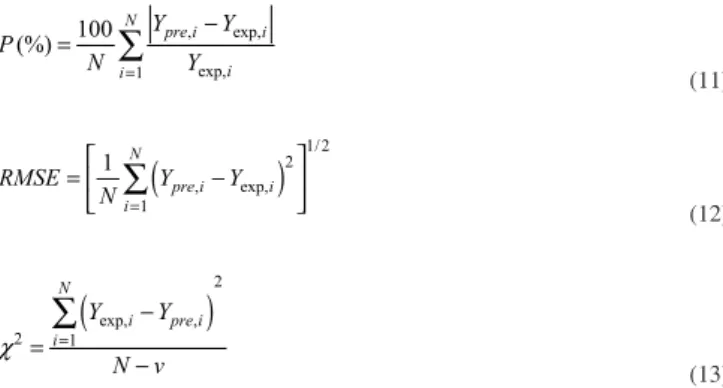
obtained experimentally and the values predicted by the model.
, exp, exp, 1
100 (%)
N
pre i i
i i
Y Y
P
N = Y
−
=
∑
(11)
(
)
2 1/ 2, exp, 1
1 N
pre i i
i
RMSE Y Y
N =
= −
∑
(12)(
exp, ,)
2 2 1N
i pre i i
Y Y
N v χ =
− =
−
∑
(13)
in which: χ ² = reduced chi-square, RMSE = root mean square error, P = relative mean error, Yexp i = dimensionless moisture experimentally observed; Ypre i = dimensionless moisture predicted by the model, N = number of experimental points, and v = number of coefficients and constants.
It is known that a good-fitting model should achieve high linear regression coefficient values (R2), close to 1.0, and lower
P (%), RMSE, and χ² values, close to zero. This mathematical method was developed to assess, concomitantly, the four statistical factors used [P (%), χ², RMSE and R²] to ensure selecting the best- fitting model. Accordingly, for each statistical factor, a list was made in crescent order, in which they were stratified according to the Sturges’ Frequency Distribution (Machado et al., 2010), where each distribution class received a score (ranging from 1 to 8), and the lower the score, the better the adjustment of the model for that statistical factor in that experiment. The number of class stratifications and the amplitude of each were obtained by Equations 14 and 15.
1 3, 3 log( )
N= + × n (14)
lower air flow compared to those of experiment 8. Experiments 7 and 8 showed a small influence of the air flow on PPW drying, as they were conducted at the same temperature (60 °C), but experiment 8 had a shorter drying time (50 min shorter). Similar behavior was observed in the study of Nicoleti et al. (2011), who dried pineapple slices and observed that a large increase in the drying air velocity resulted in increased water diffusivity, reducing the drying time. However, for a small variation in the air flow value, virtually there was no difference in water diffusivity or the process time. Bozkir (2006)also found that the air velocity was important to decrease the temperature and drying time of apricots.
the curves during the process (experiment 3 curve was more inclined), showed no difference in terms of the final drying time.
The experiment 5 and 6 curves (Figure 1b) showed the importance of temperature in the process. These experiments showed the same air flow, differing only in terms of temperature values. As a result of the difference of 20 °C between the experiments, the difference between the drying time of the experiment with the highest temperature (70 °C) and that with the lowest temperature (50 °C) was 170 min.
Analyzing the experiment 6 and 8 curves, it was observed that there was a reasonable balance between the variables temperature and air flow since both experiments showed the same drying time; experiment 6 showing higher temperature but
Table 2. Analysis of variance (ANOVA) of the model adjusted to the depedent variable drying time versus temperature (°C) (x1) and the flow
of the drying air (m³ Kg.s–1) (x
2).
Factor Sum of squares Degrees of freedom Mean square F value tabulated level of significance (p)
x1 linear 33861.75 1 33861.75 279.7739 0.000000*
x1 quadrátic 7709.82 1 7709.82 63.7004 0.000044*
x2 linear 1026.84 1 1026.84 8.4840 0.019507*
Residual error 968.26 8 121.03
Total error 43566.67 11
*Significant factors in the adjusted model (p ≤ 0.05).
Table 3. Regression coefficient (R²) and mean relative error [P(%)] values.
Statistical
Factor Experiment
Models Lewis Page Henderson &
Pabis Wang & Singh Midilli
Diffusion
Approch Logarithmic
R² (%)
1 99.6230 99.8180 99.8600 99,8180 99.9670 99.9330 99.8630
2 99.2350 99.8400 99.8480 99,8480 99.9400 99.8920 99.7090
3 99.4830 99.5390 99.6320 99.6520 99.9830 99.6720 99.7720
4 98.9660 99.7890 99.6160 99.7020 99.9800 99.9420 99.6570
5 99.3380 99.3550 99.4700 99.3860 99.9540 99.5030 99.7540
6 99.5790 99.7340 99.7720 99.7670 99.9600 99.8440 99.7890
7 98.7890 99.7230 99.5830 99.5650 99.9540 99.9330 99.6200
8 99.3780 99.7940 99.7320 99.8880 99.9360 99.8650 99.7400
9 97.7680 99.4930 98.8000 99.2240 99.8980 99.6370 99.9450
10 98.6410 99.7190 99.4750 99.5930 99.9520 99.8830 99.5340
11 98.1900 99.7090 99.6970 99.7110 99.8650 99.8620 99.7060
12 98.1340 99.7830 99.6880 99.7730 99.9720 99.9720 99.7050
Parcial sum of scores 51 16 23 24 12 15 17
P (%)
1 3.1830 3.4967 2.3566 3.9677 1.0220 2.3179 1.9515
2 5.2625 3.1846 3.4045 2.2312 1.0351 2.3062 3.7995
3 6.5831 7.0672 6.4315 6.4315 1.1541 6.3015 3.8186
4 6.0897 3.9600 3.4558 2.6406 0.8549 2.2021 3.9887
5 7.6268 7.9477 7.1476 7.9612 1.6354 7.6616 3.6765
6 4.3719 4.6070 3.8405 4.1221 1.1390 3.6402 3.0905
7 6.5476 4.3883 3.4818 2.9610 1.1632 2.1290 3.7605
8 5.3694 4.1091 3.9103 1.8144 1.7777 3.4606 4.1722
9 10.8461 7.5588 8.0959 6.3060 2.0703 6.1473 8.9967
10 7.3748 4.5975 4.5935 3.0036 1.5661 2.8879 4.8541
11 5.5149 4.1960 3.8306 2.6905 2.3215 3.2072 3.9287
12 5.7078 3.9419 3.5399 2.2421 1.0304 2.6092 3.9602
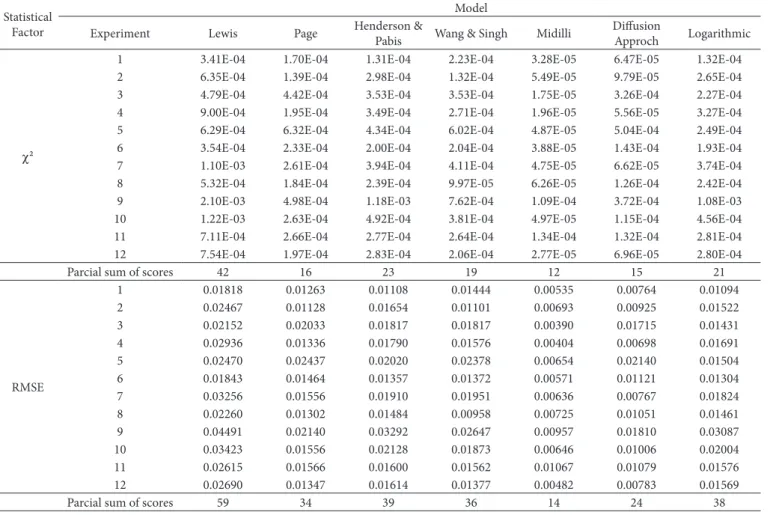
nonlinear models (Madamba et al., 1996). Therefore, the reduced chi-square (χ²), root mean square error (RMSE), and relative mean error [P (%)] values were also considered.
The relative mean error values found, except for that obtained in experiment 9 with the Lewis model, were lower than 10%. P values (%) indicate the deviation of the observed values in relation to the curve estimated by the model
(Kashani-3.2 Drying kinetic modeling
The modeling of drying kinetic of PPW was performed based on the experimental values and statistical results shown in Tables 3 and 4. The R² values ranged from 97.76 to 99.98% and show that the Midilli, Diffusion Approximation, and Page models showed values closer to 1.0. However, the regression coefficient (R²) alone is not a good criterion for selecting
Table 4. Reduced chi-square (χ²) and root mean square error (RMSE) values.
Statistical Factor
Model
Experiment Lewis Page Henderson & Pabis Wang & Singh Midilli Diffusion Approch Logarithmic
χ²
1 3.41E-04 1.70E-04 1.31E-04 2.23E-04 3.28E-05 6.47E-05 1.32E-04
2 6.35E-04 1.39E-04 2.98E-04 1.32E-04 5.49E-05 9.79E-05 2.65E-04
3 4.79E-04 4.42E-04 3.53E-04 3.53E-04 1.75E-05 3.26E-04 2.27E-04
4 9.00E-04 1.95E-04 3.49E-04 2.71E-04 1.96E-05 5.56E-05 3.27E-04
5 6.29E-04 6.32E-04 4.34E-04 6.02E-04 4.87E-05 5.04E-04 2.49E-04
6 3.54E-04 2.33E-04 2.00E-04 2.04E-04 3.88E-05 1.43E-04 1.93E-04
7 1.10E-03 2.61E-04 3.94E-04 4.11E-04 4.75E-05 6.62E-05 3.74E-04
8 5.32E-04 1.84E-04 2.39E-04 9.97E-05 6.26E-05 1.26E-04 2.42E-04
9 2.10E-03 4.98E-04 1.18E-03 7.62E-04 1.09E-04 3.72E-04 1.08E-03
10 1.22E-03 2.63E-04 4.92E-04 3.81E-04 4.97E-05 1.15E-04 4.56E-04
11 7.11E-04 2.66E-04 2.77E-04 2.64E-04 1.34E-04 1.32E-04 2.81E-04
12 7.54E-04 1.97E-04 2.83E-04 2.06E-04 2.77E-05 6.96E-05 2.80E-04
Parcial sum of scores 42 16 23 19 12 15 21
RMSE
1 0.01818 0.01263 0.01108 0.01444 0.00535 0.00764 0.01094
2 0.02467 0.01128 0.01654 0.01101 0.00693 0.00925 0.01522
3 0.02152 0.02033 0.01817 0.01817 0.00390 0.01715 0.01431
4 0.02936 0.01336 0.01790 0.01576 0.00404 0.00698 0.01691
5 0.02470 0.02437 0.02020 0.02378 0.00654 0.02140 0.01504
6 0.01843 0.01464 0.01357 0.01372 0.00571 0.01121 0.01304
7 0.03256 0.01556 0.01910 0.01951 0.00636 0.00767 0.01824
8 0.02260 0.01302 0.01484 0.00958 0.00725 0.01051 0.01461
9 0.04491 0.02140 0.03292 0.02647 0.00957 0.01810 0.03087
10 0.03423 0.01556 0.02128 0.01873 0.00646 0.01006 0.02004
11 0.02615 0.01566 0.01600 0.01562 0.01067 0.01079 0.01576
12 0.02690 0.01347 0.01614 0.01377 0.00482 0.00783 0.01569
Parcial sum of scores 59 34 39 36 14 24 38
Table 5. Upper and lower limits of the classes of the values of each statistical factor applied to dimensionless moisture data foundduring the
modeling of drying kinetics of potato pulp waste.
Class / Score
Statistical Factors
P (%)a) RMSEb) χ² c) R²d)
L. L. e) U. L.f) L. L. U. L. L. L. U. L. L. L. U. L.
1 0.8549 2.1038 0.00390 0.00902 1.75×10⁻⁵ 2.78×10⁻⁴ 99.7061% 99.9830%
2 2.1038 3.3527 0.00902 0.01415 2.78×10⁻⁴ 5.38×10⁻⁴ 99.4293% 99.7061%
3 3.3527 4.6016 0.01415 0.01928 5.38×10⁻⁴ 7.99×10⁻⁴ 99.1524% 99.4293%
4 4.6016 5.8505 0.01928 0.02440 7.99×10⁻⁴ 1.06×10⁻³ 98.8755% 99.1524%
5 5.8505 7.0994 0.02440 0.02953 1.06×10⁻³ 1.32×10⁻³ 98.5986% 98.8755%
6 7.0994 8.3483 0.02953 0.03465 1.32×10⁻³ 1.58×10⁻³ 98.3218% 98.5986%
7 8.3483 9.5972 0.03465 0.03978 1.58×10⁻³ 1.84×10⁻³ 98.0449% 98.3218%
8 9.5972 10.8461 0.03978 0.04491 1.84×10⁻³ 2.10×10⁻³ 97.7680% 98.0449%
Acknowledgements
The authors are grateful for the financial support provided by CAPES - Coordination for the Improvement of Higher Education Personnel and CNPq - National Council for Scientific and Technological Development; and to Cicopal Ltda for providing the samples.
References
Aghbashlo, M., Kianmehr, M. H., & Arabhosseini, A. (2009). Modeling of thin-layer drying of potato slices in length of continuous band
dryer. Energy Conversion and Management, 50(5), 1348-1355. http://
dx.doi.org/10.1016/j.enconman.2009.01.004
Agrianual. (2011). Yearbook of the Brazilian Agriculture. São Paulo:
Institute FNP.
Association of Official Analytical Chemists - AOAC. (2006). Official
methods of analysis of AOAC International (18th ed.). Gaithersburg: AOAC International.
Barbosa, F. F., Melo, E. C., Santos, R. H. S., Rocha, R. P., Martinazzo, A. P., Radunz, L. L., & Gracia, L. M. N. (2007). Evaluation of mathematical models for prediction of thin layer drying of Brazilia
lemon-scented verbana leaves (Lippia alba (Mill) N.E. Brown).
Revista Brasileira de Produtos Agroindustriais, 9(1), 73-82. Blahovec, J., Lahodová, M., & Zámečník, J. (2012). Potato tuber dynamic
mechanical analysis at temperatures of starch gelatinization. Food
and Bioprocess Technology, 5(3), 929-938. http://dx.doi.org/10.1007/ s11947-010-0376-7
Bozkir, O. (2006). Thin-layer drying and mathematical modelling for
washed dry apricots. Journal of Food Engineering, 77(1), 146-151.
http://dx.doi.org/10.1016/j.jfoodeng.2005.06.057
Castiglioni, G. L., Soares Júnior, M. S., Caliari, M., & Silva, F. A. (2013). Modelagem matemática do processo de secagem da massa
fibrosa de mandioca. Revista Brasileira de Engenharia Agrícola
e Ambiental, 17(9), 987-994 http://dx.doi.org/10.1590/S1415-43662013000900012
Costa, E. C. (2007). Industrial Drying. São Paulo: Blücher.
Dias, T. L., Oliveira, T. F., Campos, M. R. H., & Soares Júnior, M. S. (2014). Utilização da polpa de batata residual em snacks como
perspectiva de redução do impacto ambiental. Revista Brasileira
de Engenharia Agrícola e Ambiental, 18(2), 225-230. http://dx.doi. org/10.1590/S1415-43662014000200014
Fernandes, A. F., Pereira, J., Germani, R., & Oiano-Neto, J. (2008). Effect of the partial replacement of wheat flour for potato skin flour (Solanum Tuberosum L.). Food Science and Technology, 28(Suppl.), 56-65.
Nejad et al., 2007). Values below 10% are recommended for model selection (Mohapatra & Rao, 2005). It was found that, in general, almost all models were adquate to the process when this factor was taken into account since the values ranged from 0.8549 to 10.8461, in which the Midilli model showed the lowest absolute values for P (%), while the Lewis model had the highest values for this statistical factor. All models showed very low χ² and RMSE values, and the Midilli model, once again had the lowest RMSE values.
In order to evaluate the models simultaneously in all experiments, based on the statistical factor values, the data was stratified according to the Sturges’ Rule, thus obtaining classes and the range of values comprised in each class (Table 5). According to the Sturges’ formula (Machado et al., 2010), the data were stratified into eight classes, each of which received a score from 1 to 8, and the lower the score, the better the adjustment of the model was (Table 6).
It was found that the Midilli and Diffusion Approach models were those with the lowest sum values, i.e., with the best fit to the drying data, considering the four statistical factors simultaneously. These results are in agreement with those found by Barbosa et al. (2007), who dried lemongrass leaves in thin layer with drying air temperature ranging from 40 to 80 °C and constant air speed. In that study, the Midilli and Page models showed the best adjustment. The Lewis model showed the highest scores in all statistical factors thus resulting in a higher sum, and therefore it was least adequate to the PPW drying process.
4 Conclusions
According to the experimental results, temperature is the factor that most affects the drying kinetics of PPW, leading to a reduction in the dehydration time. The variable air flow also affects the drying time of PPW. The new mathematical method developed in this study, based on scores according to the Sturges’ Rule, precisely evaluated four statistical factors [P (%), χ², RMSE, and R²], and thus it can significantly contribute to the selection of the most representative models for the drying process of PPW. Among the drying models studied, it was found that the Midilli and Diffusion Approach models were those with the lowest sum values, i.e., with the best adjustment to the drying kinetic data.
Table 6. Sum of scores obtained for the statistical factors of the theoretical models evaluated.
Statistical Factors
Models
Lewis Page Henderson & Pabis Wang & Singh Midilli Diffusion Approch Logarithmic Parcial sum the scores
P (%)a) 56 44 43 35 13 36 38
RMSEb) 59 34 39 36 14 24 38
χ²c) 42 16 23 19 12 15 21
R²d) 51 16 23 20 12 15 17
Total Sum of scores 208 110 128 110 51 90 114
temperature versus fixed slice temperature drying kinetics. Drying Technology: An International Journal, 19(9), 2175-2191. http:// dx.doi.org/10.1081/DRT-100107493
Ogata, K. (2003). Engenharia de controle moderno (4. ed.). São Paulo: Prentice Hall.
Oliveira, F. T., Cagnon, B., Fauduet, H., Licheron, M., & Chedeville, O. (2012). Removal of diethyl phthalate from aqueous media by adsorption on different activated carbons: kinetic and isotherm
studies. Separation Science and Technology, 47(8), 1139-1148. http://
dx.doi.org/10.1080/01496395.2011.645184
Pelizer, L. H., Pontineri, M. H., & Moraes, I. O. (2007). Use of a agro-industrial biotechnology processes as prospect of reducing
the environmental impact. Journal of Technology Management &
Innovation, 2(1), 118-127.
Pinelli, L. L. O., Moretti, C. L., Almeida, G. C., Santos, J. Z., Onuki, A. C. A., & Nascimento, A. B. G. (2006). Chemical and physical
characterization of fresh-cut potatoes. Food Science and Technology,
26(5), 127-134.
Sena, R. F., Albrecht, W., Althoff, C. A., Moreira, R. F. P. M., & José, H. J. (2012). Characterization of agroindustrial solid residues as biofuels and potential application in thermochemical processes.
Waste Management, 32(10), 1952-1961. PMid:22699005. http:// dx.doi.org/10.1016/j.wasman.2012.05.014
Soares Júnior, M. S., Bassinello, P. Z., Caliari, M., Gebin, P. F. C., Junqueira, T. L., Gomes, V. A., & Lacerda, D. B. C. L. (2009).
Qualidade de pães com farelo de arroz torrado. Food Science and
Technology, 29(3), 636-641.
Soares Júnior, M. S., Santos, T. P. B., Pereira, G. F., Minafra, C. S., Caliari, M., & Silva, F. A. (2011). Development of extruded snacks from rice
and bean fragments. Semina, 32(1), 189-198.
Vilhalva, D. A. A., Soares Júnior, M. S., Caliari, M., & Silva, F. A. (2012). Secagem convencional de casca de mandioca proveniente
de resíduos de indústria de amido. Agricultural Research in the
Tropics, 42(3), 331-339. García, C. F., Moyano, P. C., & Pedreschi, F. (2008). Enthalpy-entropy
compensation for water loss of vegetable tissues during air drying.
Drying Technology: An International Journal, 26(12), 1563-1569. http://dx.doi.org/10.1080/07373930802466997
Gouveia, J. P. G., Moura, R. S. F., Almeida, F. A. C., Oliveira, A. M. V., & Silva, M. M. (2002). Evaluation of kinetics of cashew drying by
experimental planning. Revista Brasileira de Engenharia Agrícola e
Ambiental, 6(3), 471-474.
Kashani-Nejad, M. A., Mortazaki, A., & Safekordi, A. G. (2007).
Thin-layer drying characteristics and modeling of pistachio nuts. Journal
of Food Engineering, 78(1), 98-108. http://dx.doi.org/10.1016/j. jfoodeng.2005.09.007
Laufenberg, G., Kunz, B., & Nystroem, K. (2003). Transformation of vegetable waste into value added products: (A) the upgrading
concept; (B) practical implementations. Bioresource Technology,
87(2), 167-198. http://dx.doi.org/10.1016/S0960-8524(02)00167-0
Machado, S. A., Nascimento, R. G. M., Miguel, E. P., Téo, S. J., & Augustynczik, A. L. D. (2010). Distribution of total height, transverse área and individual volume for araucaria angustifolia.
Cerne, 16(1), 12-21.
Madamba, P. S., Driscoll, R. H., & Buckle, K. A. (1996). Thin-layer
drying characteristcs of garlic slices. Journal of Food Engineering,
29(1), 75-97. http://dx.doi.org/10.1016/0260-8774(95)00062-3
Martinazzo, A. P., Correa, P. C., Resende, O., & Melo, E. C. (2007). Analysis and mathematical description of drying kinetic of lemon
grass leaves. Revista Brasileira de Engenharia Agrícola e Ambiental,
11(3), 301-306.
Mohapatra, D., & Rao, P. S. A. (2005). A thin layer drying model of
parboiled wheat. Journal of Food Engineering, 66(4), 513-518. http://
dx.doi.org/10.1016/j.jfoodeng.2004.04.023
Niamnuy, C., Nachaisin, M., Poomsa, N., & Deyahastin S. (2012). Kinetic modeling of drying and conversion/degradation of
isoflavones during infrared drying of soybean. Food Chemistry,
133 (3), 946-952. http://dx.doi.org/10.1016/j.foodchem.2012.02.010
![Table 3. Regression coefficient (R²) and mean relative error [P(%)] values.](https://thumb-eu.123doks.com/thumbv2/123dok_br/15932353.677314/4.892.69.831.295.806/table-regression-coefficient-r-mean-relative-error-values.webp)