* Corresponding author:
E-mail: [email protected]
Received: December 17, 2014
Approved: August 19, 2015
How to cite: Carmo DL, Silva CA, Lima JM, Pinheiro GL. Electrical Conductivity and Chemical Composition of Soil Solution: Comparison of Solution Samplers in Tropical Soils. Rev Bras Cienc Solo. 2016;v40:e0140795.
Copyright: This is an open-access article distributed under the terms of the Creative Commons Attribution License, which permits unrestricted use, distribution, and reproduction in any medium, provided that the original author and source are credited.
Electrical Conductivity and Chemical
Composition of Soil Solution:
Comparison of Solution Samplers in
Tropical Soils
Davi Lopes do Carmo(1)*
, Carlos Alberto Silva(2)
, José Maria de Lima(2)
and Gabriela Lúcia Pinheiro(1)
(1)
Universidade Federal de Lavras, Departamento de Ciência do Solo, Programa de Pós-graduação em Ciência do Solo, Lavras, Minas Gerais, Brasil.
(2)
Universidade Federal de Lavras, Departamento de Ciência do Solo, Lavras, Minas Gerais, Brasil.
ABSTRACT: Soil solution samplers may have the same working principle, but they differ in relation to chemical and physical characteristics, cost and handling, and these aspects exert influence on the chemical composition of the soil solution obtained. This study was carried out to evaluate, over time, the chemical composition of solutions extracted by Suolo Acqua, with the hydrophilic membrane (HM) as a standard, using soils with contrasting characteristics, and to determine the relationship between electrical conductivity (EC) and concentration of ions and pH of soil solution samples. This study was carried out under laboratory conditions, using three soils samples with different clay and organic matter (OM) contents. Soil solution contents of F−, Cl−, NO−3, Br−, SO42−, Na
+,
NH4
+, K+, Mg2+, Ca2+, were analyzed, as well as inorganic, organic, and total C contents, pH,
and EC, in four successive sampling times. Soil solution chemical composition extracted by the Suolo Acqua sampler is similar to that collected by the HM, but the Suolo Acqua extracted more Na+ and soluble organic C than the HM solution. Solution EC, cation and anion concentrations, and soluble C levels are higher in the soil with greater clay and OM contents (Latossolo and Cambissolo in this case). Soil solution composition varied over time, with considerable changes in pH, EC, and nutrient concentrations, especially associated with soil OM. Thus, single and isolated sampling of the soil solution must be avoided, otherwise composition of the soil solution may not be correctly evaluated. Soil solution EC was regulated by pH, as well as the sum of cation and anion concentrations, and the C contents determined in the soil liquid phase.
Keywords: electrical conductivity, water soluble carbon, soil liquid phase, soil solution extraction methods.
INTRODUCTION
Soil solution samplers differ in size, length, diameter, pore diameter, shape, and the physical properties of their components (Litaor, 1988). Depending on the type and physical and chemical properties of the sampler membrane, there may be limitations on evaluating the contents of chemical elements in solution due to the adsorption or desorption of cations and anions in the samplers (Silva et al., 2004; Kiggundu et al., 2010). Components used in the manufacture of porous cups may also increase solution sampling time, due to biochemical reactions between the sampler membrane and the solution (Ross and Bartlett, 1990; Wolt, 1994). Some sampler membranes have selective pore diameters that prevents the entrance of clay particles and organic materials, altering the composition of the soil solution (Litaor, 1988; Spangenberg et al., 1997). Variation in the volume of solution collected by the sampler is also commonly reported (Grossmann and Udluft, 1991), as well as pore plugging, which prevents the use of samplers in successive extractions of the solution (Di Bonito et al., 2008; Falcon-Suarez et al., 2014). All the aforementioned factors determine the relative efficiency of samplers and may further alter the determinations of chemical composition of the soil solution.
Comparing ceramic samplers with porous Teflon solution samplers, Zimmerman et al. (1978) reported no clogging of pores in long-term sampling, or changes in the solution nutrient concentrations when the Teflon sampler was used. The ceramic sampler retained more NH4
+, PO 4 3−, NO−
3, NO−2, and silicon compared to Teflon. Despite its improved performance, the authors report that the Teflon sampler cost is high, which restricted its use in many studies. A big problem of a ceramic sampler is its capacity to adsorb anions and release cations, such as Ca2+, Mg2+ and Al3+ (Litaor, 1988). Adsorption of ions (Menendez et al., 2003; Kiggundu et al., 2010) and even increased release of Ca2+ and Mg2+, overestimating their concentrations in solution (Silva et al., 2004), are other limitations reported for ceramic solution samplers.
The hydrophilic membrane (HM) is characterized as a non-destructive method for solution extraction since it can be set up directly in the soil. The main body of the HM is composed of a cylindrical tube made from an inert hydrophilic polymer membrane with a 0.1 µm micropore designed to retain soil organisms and high molecular weight compounds found in the soil solution. The hydrophilic membrane is selective to some soluble C fractions and organo-metallic complexes found in the soil solution (Spangenberg et al., 1997; Sigfusson et al., 2006). The HM is used as a reference in solution extraction methods since adsorption or sorption of ions present in the liquid phase is not reported for this sampler (Spangenberg et al., 1997; Knight et al., 1998). Furthermore, the HM quickly and easily samples the soil solution, with minimal intervention in its chemical composition (Argo et al., 1997). In addition, the technical efficiency of HM is recognized worldwide, especially for evaluating nutrient availability in soils (Meijboom and van Noordwijk, 1992) and in substrates for plant growth (Argo et al., 1997). However, the HM has not yet been tested under the conditions of Brazilian crop fields or compared to samplers currently used for sampling soil solutions in Brazil.
the performance of the standard sampler (HM) most used in the market. The Suolo Acqua sampler does not retain or release ions; it collects the soil solution in a shorter time and its pores do not clog over time or after successive use.
Soils differ over time in terms of ion concentrations in the soil solution, with variations in the levels of nutrients, pH, and EC; and the chemical composition of the soil solution depends on soil water content, the soil layer sampled, and the targeted nutrient (Miranda et al., 2006). Thus, sampling the solution at only one time does not reflect its variations in composition over different climatic seasons.
We hypothesized that, over time, variations in solution composition are more evident in the soil with high OM and clay contents in comparison to soils with low clay and C contents since in rich clay-textured soils, the reservoirs and pools of nutrients that can be mineralized are higher, increasing the salt and ion contents in the soil solution. Changes in soil pH depend on the characteristics of the soil studied and this is a key factor regulating the concentration of ions in the soil solution. The performance of Suolo Acqua in evaluating the chemical composition of the solution is similar to the HM sampler, although a greater recovery of C is expected in the solution sampled by the Suolo Acqua. Specific objectives were to evaluate the pH, EC, and concentration of anions and cations in the solution extracted by the Suolo Acqua and by the hydrophilic membrane samplers. We also compared the chemical composition of solutions from soils with contrasting texture and OM contents. The variations in solution composition over time were also investigated.
MATERIALS AND METHODS
Two solution samplers were tested, the hydrophilic membrane (HM), which is a reference method in the market, and Suolo Acqua (patent BR 20 2014 026836 2), a sampler developed at the Soil Science Department, Universidade Federal de Lavras, Lavras, MG, Brazil. Solution sampling was performed in three soil samples with sharp differences in their degrees of fertility, and clay and organic matter (OM) contents. The soils investigated were classified as Neossolo Quartzarênico - RQ (Typic Quartzipsamment), Latossolo Húmico Distrófico - LHd (Humic Hapludox) and
Cambissolo Háplico Tb Distrófico - CXbd (Typic Dystropepts), according to the Brazilian
System of Soil Classification (Santos et al., 2013) and the USDA Soil Taxonomy (Soil Survey Staff, 2010). Soil samples were collected under natural conditions from the 0.00-0.20 m soil depth, air dried, macerated, and sieved (2 mm). Chemical and physical characteristics of the soil samples investigated are shown in table 1.
Soil samples were characterized as follows: pH in water, SMP pH, EC, Ca2+, Mg2+, Al3+, potential acidity (H+Al), Al saturation (AlS), base saturation (BS), total carbon (C), organic matter (OM), total nitrogen (N), NH4
+-N, NO−3-N, buffered (pH 7) cation exchange
capacity (CEC), effective CEC (eCEC), S-sulfate, K+
, P-extracted by the Mehlich-1 solution, remaining P, Zn2+, Fe2+, Mn2+, Cu2+, and B, following the analytical procedures described in Santos et al. (2009). Electrical conductivity and pH were determined in a soil:water ratio of 1:2.5 (0.01 dm3 of dried soil:25 mL H
2O), which was stirred for 30 min, allowed to stand for another 30 min, and stirred again for 30 s; the solution EC and pH were then measured. Total C content was determined by dry combustion in an automated analyzer (Elementar brand, Vario TOC Cube model). The solution EC was determined in a TECNAL-TEC 4MP conductivitymeter. Soil textural fractions were quantified according to the Bouyoucos method (Claessen, 1997).
Description of the solution sampler
washings with hydrochloric acid and deionized water, covered by porous hard plastic whose internal body is connected to a flexible silicone tube. The operating principle of Suolo Acqua consists of the application of vacuum suction, which generates a potential gradient in the soil around the capsule, inducing soil solution to flux into the porous membrane. The collected soil solution is then stored in a 20 mL previously conditioned vacuum tube (Figure 1b). The hydrophilic membrane sampler is composed of a chemically inert porous hydrophilic polymer (blend of polyethersulfone and polyvinylpyrrolidone) of 0.1 µm pore diameter, with a 2.5 mm outer diameter and a 1.4 mm inner diameter; the HM is attached to a 0.10 m length PVC pipe, which is directly coupled to a luer-lock type connector. Inside the PVC pipe, there is a stainless steel wire used to reinforce the sampler structure.
Soil solution sampling
Solution samplers were installed in a 0.740 dm3 pot filled with 0.700 dm3 of each soil tested, whose weights differ depending on the soil density: 1.150 Mg m-3 (RQ), 700 Mg m-3 (LHd),
Table 1. Fertility properties, electrical conductivity (EC), and granulometry of the three studied soils
(1) Soil nomenclature according to the Brazilian System of Soil Classification (Santos et al., 2013) .(2)
P: P extracted in the Mehlich-1 solution; Rem. P: remaining phosphorus; eCEC: effective cation exchange capacity; CEC: buffered (pH=7) cation exchange capacity; BS: base saturation; AlS: aluminum saturation; C: total carbon; OM: organic matter; S: S-sulfate; Clay, silt, sand: quantified according to the Bouyoucos method.
Property Latossolo Húmico
Distrófico(1) Neossolo
Quartzarênico
Cambissolo Háplico Tb Distrófico
pH(H2O) 5.5 5.2 5.6
pH(SMP) 5.4 6.1 6.0
P (mg dm-3
) 4.2 14.0 2.6
K (mg dm-3
) 101 39 59
Ca2+
(cmolc dm -3
) 3.2 0.4 2.3
Mg2+
(cmolc dm-3) 1.2 0.1 0.4
Al3+
(cmolc dm -3
) 0.4 0.6 0.3
H+Al (cmolc dm -3
) 7.9 4.0 4.2
eCEC (cmolc dm -3
) 5.1 1.2 3.1
CEC (cmolc dm -3
) 12.0 4.6 7.0
BS (%) 35 14 40
AlS (%) 8.3 53 8.7
C (%) 6.5 0.9 3.0
OM (dag kg-1) 7.1 1.6 3.7
Total N (g kg-1
) 5.9 1.1 3.3
EC (µS cm-1
) 76 35 62
Rem. P (mg L-1
) 7.3 41 27
Zn2+
(mg dm-3) 2.2 0.6 2.8
Fe2+
(mg dm-3
) 47 79 116
Mn2+
(mg dm-3
) 16 3.7 22
Cu2+
(mg dm-3
) 0.7 0.3 1.1
B (mg dm-3
) 0.1 0.1 0.1
S (mg dm-3
) 7.5 5.1 9.9
NH4 +
-N (dag kg-1
) 35 22 29
NO−3-N (dag kg-1) 23 28 27
Mineral N (dag kg-1
) 58 50 56
Clay (g kg-1
) 510 40 350
Silt (g kg-1
) 150 30 190
and 750 Mg m-3 (CXbd). The sampler was installed so as to keep it in the center of each pot. Solution samplers were carefully inserted in soils, and fine soil with aggregates of approximately 1 mm were lightly compressed around the sampler capsules to prevent air bubbles and discontinuity of the soil-water-sampler system. After sampler installation, deionized water was added to reach soil water content near field capacity. Soil moisture was kept at this level for a period of 12 h, aiming at equilibrium between the soil and its liquid phase. The soil solution was sampled at 0, 2, 4, and 14 days after beginning soil incubation. Soil solution samples were collected with a 20 mL tube previously conditioned to -70 kPa vacuum pressure. This standardized vacuum level was generated with the aid of a vacuum pump, allowing the collection of about 15 mL of soil solution. A hypodermic needle was placed at the end of the solution header pipe of each sampler, and this needle was inserted in the rubber sealing cap of the plastic tube used to store the soil solution. After 10 h, the solution collected in the vacuum-conditioned tubes was filtered through membranes of 0.45 µm pore diameter and stored in the refrigerator at ±3 °C for further analyses.
Soil solution analyses
The concentrations of F−, Cl−, NO−3, Br−, SO42−, Na +, NH
4
+, K+, Mg2+, and Ca2+ were
determined by ion chromatography in an ICS 1100 machine (Dionex) equipped with a DS6 conductivity detector. An IonPack AS23 column was used to detect anionic species, and an IonPack CS12A, for cationic species. A solution of 45 mmol L-1 Na2CO3/14 mmol L
-1 NaHCO
3 was used to elute anions, and 20 mmol L -1 H
2SO4, to elute cations, at a flow rate of 0.25 mL min-1. A volume of 20 µL of soil solution was injected in the chromatograph. The chromatographic standard curve was prepared using certified solutions from Dionex, whose concentrations ranged from 0.1 to 40 mg L-1 for anions, and 0.25 to 100 mg L-1 for cations. The EC was determined in a TECNAL-TEC 4MP conductivitymeter. The concentrations of soluble inorganic carbon (SIC), soluble organic carbon (SOC), and total soluble carbon (TSC) present in the soil solution were determined in an automatic Total Organic Carbon (TOC) analyzer (Elementar brand, in a liquid module of a Vario TOC Cube model). Certified samples (from Elementar) of potassium acid phthalate and sodium carbonate were used as organic and inorganic C standards, respectively, to calibrate the automated TOC analyzer. Solution EC and pH were measured in unfiltered solution samples within a 24 h collection.
(a) Suolo Acqua (b) Suolo Acqua installation and solution sampling
5
6
1 - External filter of rigid plastic
4
3
2
1
10 cm
15,5 cm
7 cm
2 - Internal filter of inert material
3 - PVC connector 4 - Silicone flexible tube
5 - Needle
6 - Vacuum-conditioned sampling tube
Figure 1. Schematic diagram of the Suolo Acqua sampler and its constituent parts (a) and Suolo Acqua
Statistical analyses
A completely randomized experimental design was adopted in a two (solution samplers) × four (sampling times) × three (soil samples) factorial arrangement using three replicates, for a total of 72 experimental plots. Statistical analyses of the data set were performed using analysis of variance at p<0.05, and the mean values of the treatments were compared by the F test, using the SISVAR software (Ferreira, 2014). A multiple parameter regression analysis was also performed to evaluate the degree of association of EC with solution pH, ion concentrations, and C contents.
RESULTS AND DISCUSSION
Chemistry of the solution
Solutions extracted by the two samplers differ in relation to Na+, SOC, and TSC concentrations in the three soils (LHd, RQ, and CXbd) and four sampling times investigated. Statistically significant variations in the concentrations of anions, cations, Σanions, Σcations, Σanions+cations, SIC, SOC, TSC, pH, and EC were verified for the three soils over the sampling period. There was no significant effect of the interaction between solution samplers and sampling time on the chemical properties analyzed in the three soils incubated. Concentrations of anions (F−, Cl−, NO3−, Br−, SO42− ) and Σanions in the solutions extracted by the Suolo Acqua are similar to the values reported for the HM (Figure 2). Over the sampling period, the anion concentrations vary, and the magnitude of these variations is soil-dependent. Thus, as the soil incubation period increases, a reduction in the solution F−, Cl−,SO42− concentrations and sum of anions was verified. The Br− levels increase over the sampling period, as well as the nitrate contents, at least in soils with higher clay and OM contents than the sandy soil samples.
Differences in the chemical composition of the solution over the sampling period are related to biochemical and chemical processes that occur at the same time as the nutrient transfer rates and reactions between the solid and liquid phase increase. An increase in soil solution pH promotes SO42− desorption due to the deprotonation of mineral surfaces (Marsh et al., 1987), while a decrease in H+ concentrations increased the adsorption of SO42− in soil colloids through covalent bonds, with exchange of ligands (Zhang and Yu, 1997). Due to precipitation with cations or adsorption in oxides and other minerals of low chemical activity found in the soil clay fraction, sulfate concentration may also diminish in the soil solution. Over time, soil organic mineralization and nitrification rates may increase, which may explain, at least in part, the increase in solution nitrate concentrations. Thus, variations in solution chemical composition over the sampling period signal the fact that soil solution sampling must be performed over time to correctly evaluate the dynamics of soil chemical composition.
Figure 2. Anion concentrations in the soil solutions sampled by the Suolo Acqua and hydrophilic membrane (HM) at four sampling times. F− = fluoride; Cl− = cloride; NO−3= nitrate; Br− = bromide; SO42− = sulfate. LHd - Latossolo Húmico Distrófico, RQ - Neossolo Quartzarênico and CXbd - Cambissolo Háplico Tb Distrófico.
Br
− (mg L -1)
1.2
0.9
0.6
0.3
0.0
Cl
− (mg L -1)
60
45
30
15
0
NO
3
− (mg L -1)
5.6
4.2
2.8
1.4
0.0
SO
4
2−
(mg L
-1)
32
24
16
8
0
Σ
anions
− (mg L -1)
Sampling time (day) Sampling time (day) Sampling time (day) Sampling time (day) Sampling time (day) Sampling time (day)
52
39
26
13
0
F
− (mg L -1)
52
39
26
13
0
Hydrophilic membrane (HM)
Suolo Acqua
0 2 4 14 0 2 4 14 0 2 4 14
0 2 4 14 0 2 4 14 0 2 4 14
0 2 4 14 0 2 4 14 0 2 4 14
0 2 4 14 0 2 4 14 0 2 4 14
0 2 4 14 0 2 4 14 0 2 4 14
0 2 4 14 0 2 4 14 0 2 4 14
is a serious factor limiting high crop yield and enhanced uptake of other nutrients when P-fertilization is not correctly performed in Brazilian crop fields.
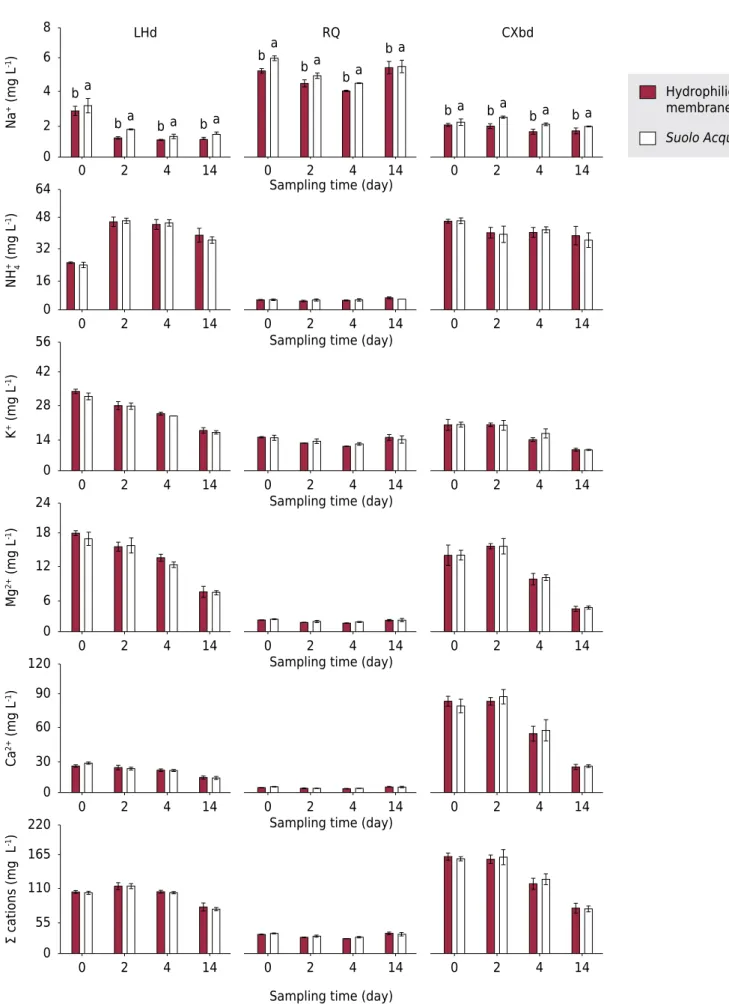
The concentrations of cations (NH+ 4, K
+, Mg2+, Ca2+) and Σcations are similar for the two samplers tested (HM and Suolo Acqua), but the Na+ content recovered in solutions extracted by Suolo Acqua are higher than the levels measured in the HM solutions in the three soils and sampling times evaluated (Figure 3). Although differences in the chemistry of the solution were hardly observed for the two samplers tested, soils presented different amounts of analytes in their solutions. The concentrations of NH+
4, Mg 2+
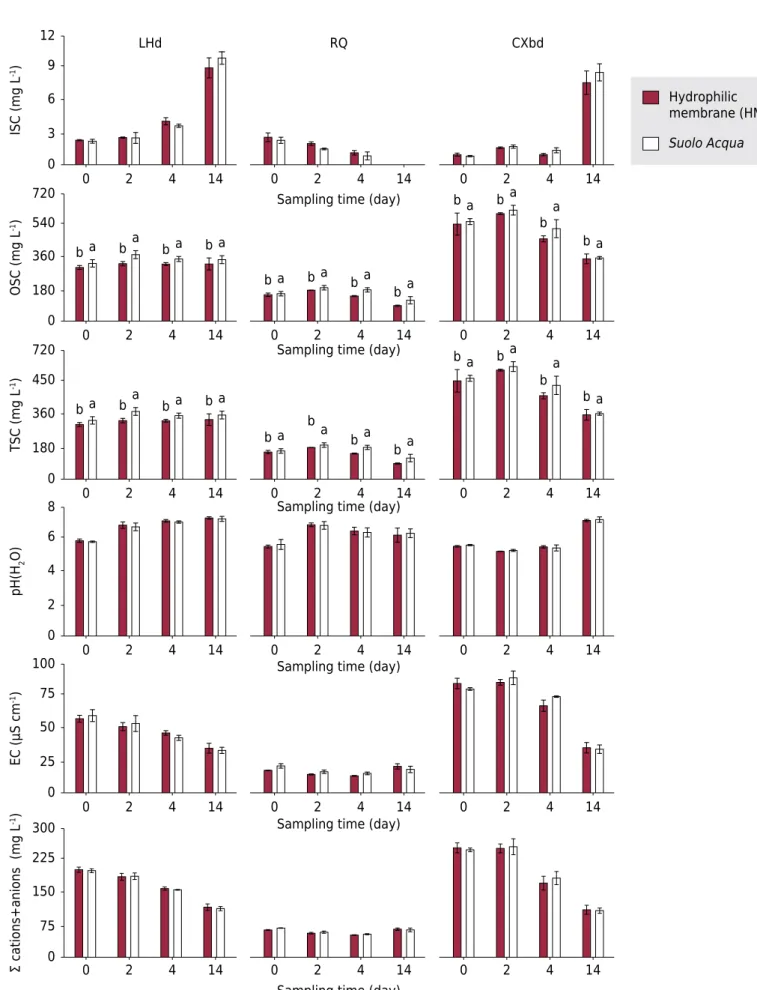
, Ca2+, and Σcations in the LHd and CXbd samples were higher than those measured in the RQ solutions; however, soluble Na levels were higher in the sandy soil. These higher cation concentrations observed for the LHd and CXbd may be due to the higher clay and OM verified in these soils. An increase in OM and clay contents may enhance the soil CEC and cation availability. In more buffered solid phase soils, cations stored in organic and inorganic colloids can gradually be released to the solution, which may increase cation availability in the soil liquid phase (Ronquim, 2010). Small fluctuations were observed for the soluble Na+ levels over the sampling period in the three soils investigated. Concentrations of K+, Mg2+, and Ca2+ decreased over the sampling period for the LHd and CXbd samples, but they were not altered for the RQ samples. Similar behavior for concentrations of these three cations in solution matrices was also observed by Miranda et al. (2006) and Oliveira et al. (2011) in solutions from soils under the influence of different land use and management systems. The SIC concentrations, pH, EC, and Σ(anions+cations) are equivalent for the two samplers, considering the different sampling times. However, concentrations of SOC and TSC were significantly higher in the solutions extracted by Suolo Acqua compared to the levels measured in the HM extracted solutions. Greater recovery of C-soluble fractions by Suolo Acqua in relation to HM (Figure 4) may be explained by the presumed selectiveness of HM for organic molecules of high molecular weight. The HM pore diameter (0.1 µm) selectivity for some high molecular weight or soluble organo-metallic complexes may explain the lower levels of organic C levels in the HM collected solutions in relation to the Suolo Acqua sampler (Spangenberg et al., 1997). The use of Suolo Acqua does not result in retention or selectiveness in extraction of organic substances present in the solution because the sampler does not have a defined pore diameter. It should be noted that after extraction, the Suolo Acqua solutions were filtered again through a cellulose membrane with a 0.45 µm pore diameter, which, according to Chow et al. (2005), is the standard diameter for collecting soluble C fractions from the soil liquid phase. Taking into account that the HM pore is designed to retain some microorganisms, it should be investigated if this selectiveness is also followed by some restriction to free or complexed organic compounds found in the soil solution.
The SIC concentrations in the LHd and CXbd solutions changed only slightly over time, although significant increases in solution analytes were verified in the last sampling time. In the RQ samples, the SIC concentrations in solution decreased over the sampling period. The SOC concentrations and TSC remained stable in the LHd solutions over the sampling period; SOC and TSC in the RQ solutions decreased compared to the levels measured from the third to fourth sampling time. Levels of SOC and TSC in the LHd and CXbd samples were much higher than those observed in the RQ solutions. Such results are not uncommon, since the soluble C content in the soil depends on its OM content (Pinheiro et al., 2014). Thus, high contents of C in the LHd (6.5 %) and CXbd (3 %) may explain the higher soluble C content found in the solution of these soils compared to the levels measured in the RQ solutions. The soluble C concentrations are directly related to the amounts of C stored in the soil as a whole (Ciotta et al., 2004).
Figure 3. Cation concentrations over the sampling period in solutions of the studied soils. Soil solutions were collected by the Suolo Acqua and hydrophilic membrane (HM) samplers. Na+
= exchangeable sodium; NH+
4 = ammonium; K
+
= exchangeable potassium;
Mg2+ = exchangeable magnesium; Ca2+ = exchangeable calcium. LHd - Latossolo Húmico Distrófico
, RQ - Neossolo Quartzarênico and CXbd - Cambissolo Háplico Tb Distrófico. Mean values followed by the same letter do not differ statistically by the F test (p<0.05).
NH
4
+ (mg L -1)
64
48
32
16
0
Ca
2+
(mg L
-1)
120
90
60
30
0
Sampling time (day) Sampling time (day) Sampling time (day) Sampling time (day) Sampling time (day) Sampling time (day)
Σ
cations (mg
L
-1)
220
165
110
55
0
K
+ (mg L -1)
56
42
28
14
0
Mg
2+
(mg L
-1)
24
18
12
6
0
LHd RQ CXbd
Na
+ (mg L -1)
8
6
4
2
0
ba
ba b a b a
ba
ba
ba
b a
b a ba b a b a
0 2 4 14 0 2 4 14 0 2 4 14
0 2 4 14 0 2 4 14 0 2 4 14
0 2 4 14 0 2 4 14 0 2 4 14
0 2 4 14 0 2 4 14 0 2 4 14
0 2 4 14 0 2 4 14 0 2 4 14
0 2 4 14 0 2 4 14 0 2 4 14
Hydrophilic membrane (HM)
Figure 4. Soluble inorganic C (SIC), soluble organic C (SOC), and total soluble C (TSC) concentrations, pH values, and electrical conductivity (EC) of solutions of the studied soils. Variables were measured in solutions extracted in four sampling times by the Suolo Acqua and hydrophilic membrane (HM) samplers. LHd - Latossolo Húmico Distrófico, RQ - Neossolo Quartzarênico and
CXbd - Cambissolo Háplico Tb Distrófico. Mean values followed by the same letter in each sampling time and soil investigated did
not differ statistically by the F test (p<0.05).
ISC (mg L -1) 12 9 6 3 0
LHd RQ CXbd
pH(H 2 O) 8 6 4 2 0
Sampling time (day) Sampling time (day) Sampling time (day) Sampling time (day) Sampling time (day) Sampling time (day)
Σ
cations+anions (mg
L -1) 300 225 150 75 0
0 2 4 14 0 2 4 14 0 2 4 14
0 2 4 14 0 2 4 14 0 2 4 14
0 2 4 14 0 2 4 14 0 2 4 14
0 2 4 14 0 2 4 14 0 2 4 14
0 2 4 14 0 2 4 14 0 2 4 14
0 2 4 14 0 2 4 14 0 2 4 14
EC (µS cm
-1) 100 75 50 25 0 OSC (mg L -1) 720 540 360 180 0
b a b
a
b a b a
b a b a ba
ba
b a ba
b a b a TSC (mg L -1) 720 450 360 180 0
b a b
a
b a b a
b a b
a
ba
ba
b a ba
small decrease in pH in solutions from the third and fourth sampling times. In the CXbd samples, the solution pH ranged from 5.4 to 5.7 in the three initial sampling times, but a sharp increase in pH (7.3) was verified in the solution of soils incubated for 14 days. Increase in solution pH may be explained by mineralization of N during soil incubation, and denitrification and decarboxylation of organic acids (Silva and Mendonça, 2007), among other processes naturally reported in soils. A decrease in solution pH occurs mainly due to the oxidation of NH4
+ to NO−
3 and mineralization of soil OM, followed by the release of two H+ atoms in the soil solution for each organic-derived ammonium molecule oxidized (Tisdale et al., 1993). Soil pH is one of the most important properties that affects the composition of the solution since it controls solubility and concentration, determines the intensity of the reactions in the soil, affects the ionic form of the nutrients in the soil solution, and modulates the intensity of sorption processes. Since pH is a conditioning factor of all processes mentioned before, it regulates the availability of nutrients and other chemical elements to plants (Mcbride and Błasiak, 1979).
Solution EC is directly associated with salt and ion concentrations found in soils. Solution EC ranged ranged from 34 and 59 μS cm-1 in the LHd samples, with successive reductions over the sampling period. In the RQ solutions, EC values ranged from 15 to 19 μS cm-1, with minor fluctuations over time. The solution EC of the CXbd samples were higher than values already described for the other soil samples, since values ranged from 83 to 87 μS cm-1
in the first and second sampling times; however, EC values decreased sharply, reaching values of 34 and 70 μS cm-1 for the third and fourth sampling times, respectively. Values of Σions (cations + anions) showed the same EC behavior for the extracted solutions of the three soils at different sampling times. Changes in solution EC are due to variations in the availability of ions in the soil solution, as verified by Sahrawat and Narteh (2002). The EC fluctuations are inversely correlated to solution pH over the sampling period in the three soils. The EC values decrease as the pH increases and vice versa, indicating that the solubilization and precipitation of ions in the solution also rely on the H+
concentrations in the liquid phase (McBride and Błasiak, 1979; Sousa et al., 2007). Solution EC values of the RQ samples over time were much lower than the values reported for solutions of LHd and CXbd. Such results may be explained by the lower concentrations of anions, cations, and C in the solutions of the RQ, the soil with low clay and organic matter contents. High EC values observed for the LHd and CXbd solutions are due to the high CEC of these soils, which increases their capacity to retain ions, especially cations, such as K+, Ca2+, Mg2+, and NH+4. The increased capacity of soils rich in clay and organic matter in retaining nutrients may explain higher concentrations of salts and ions in the solution and, consequently, the higher solution EC values verified in the LHd and CXbd samples compared to the RQ samples.
The Na+ levels are below those considered toxic to plants since they are less than 8 mg L-1. N-ammonium levels are too low because when they are totaled with the N-nitrate levels, they are lower than the range considered adequate for N in hydroponic solutions. The K+ availability is already low in the first solution collected, and it decreases further in subsequent solution sampling times, which are below the range considered optimal. The solution S contents are less than 30 mg L-1; therefore, levels of S available in the solutions are also a factor limiting plant growth. Although no critical Cl− level is cited in the literature reviewed, the Cl− levels determined in this study are relatively high. The contents of Br and F are very low; thus, no toxicity problems for plant growth are expected for these two chemical elements. Solution P levels are extremely limiting to plants in all the soil solutions investigated since the levels are below the low quantification limit of this nutrient by the ion chromatography technique used. The Ca2+ and Mg2+ concentrations are also below the critical range already mentioned, which means that these cations present serious nutritional limitations to proper crop growth. The pH values were within the range considered appropriate in the initial solution sampling times, but they reach values in the alkaline range in subsequent solution sampling. Thus, multiple nutritional deficiencies are expected in these alkaline soils. As a whole, solution EC values are considered low, since they are lower than 0.1 dS m-1; this may be a reflection of low nutrient availability in the soils and in the solutions investigated.
Electrical conductivity and solution analytes
Multiple regressions were performed to correlate solution EC with pH and Σ(cations + anions) + TSC of the solutions obtained by the HM and Suolo Acqua at four sampling times (Figure 5). Significant multiple correlation (p<0.05) was verified among the properties mentioned above since EC is pH dependent and Σ(cations + anions) + STC dependent for both solutions collected by the Suolo Acqua and HM samplers. This result demonstrates that the EC in the soil solution increases as the pH decreases and as the concentrations of anions, cations, and total C in the solution increase, making the EC in the solution a complex and dynamic property which reflects the effects of several properties of the solution acting together. In a study performed by Miranda et al. (2006), the soil solution in coffee fields had higher EC values, higher concentrations of soluble C, Ca2+, Mg2+, and K+, and lower pH values than the values observed for solutions from pasture areas; pasture solutions had lower EC values and concentrations of Ca2+, Mg2+, K+, and nitric-N and higher pH values over time, at three soil depths, compared to the soil solution of coffee fields.
Increase in the solution pH may occur due to neutralization of H+ and Al3+ and complexation of Al by organic ligands (Franchini et al., 2001; Pavinato and Rosolem, 2008; Hue, 2011). It may also be explained by CaCO3 precipitation (Pocknee and Sumner, 1997), which decreases the solubility of Ca2+ and C in the soil solution (Franchini et al., 2001). When solution pH is increased to levels above 6.5, several nutrients, such as N, P, Ca, Mg, S, Fe, Cu, Mn, Zn, and B may be co-precipitated with other ions, which makes them less available in the soil solution (Braccini et al., 1999; Sousa et al., 2007), with subsequent reduction in solution EC. A decrease in solution pH with a concomitant increase in EC is only valid for pH values in the range of 5.3 to 7.5. For the three soils investigated, where the pH values were below or above the range mentioned, further studies are necessary to track changes in solution EC related to changes in the presence of salt in the solutions under the effect of sharp changes in pH in acidic and alkaline soils.
Figure 5. Solution electrical conductivity (EC) as a function of pH and Σ(anions+cations)+total
soluble C (TSC), considering the data set of the three soils and four solution sampling times. (a) Hydrophilic membrane (HM) and (b) Suolo Acqua. Anions = F−, Cl−, NO−3, Br−, SO42−; and
cations = Na+
, NH+ 4, K
+
, Mg2+
, Ca2+
. *, **, and ***: significant at the 1, 5, and 10 %, respectively, by the F test. pH
Σanions+cations+TSC (mg L
-1)
100
75
50
25
0
800 600
400 200
0 5.4
6.0 6.6
7.2 7.8
EC (µS cm
-1)
pH Σanions+cations+TSC (mg L
-1)
100
75
50
25
0
800
600 400
200
0 5.4
6.0 6.6
7.2 7.8
EC (µS cm
-1)
EC = 29.0475*** - 5.2089***pH + 0.1029** ΣIons+TSC R2 = 0.95
(a) Hydrophilic membrane (HM)
EC = 46.3552* - 7.8587*pH + 0.0991** ΣIons+TSC R2 = 0.98
dissociation rate depends on the pH and solution ionic strength. Thus, soluble organic compounds behave like anionic species currently found in soils (Guppy et al., 2005). According to the results found in this study, the pH values and soluble C concentrations act as EC regulators in the soil solution, controlling the availability of ions. Electrical conductivity changes are controlled by the magnitude of adsorption and desorption of ions in mineral and organic colloids, the intensity of precipitation reactions and ion dissociation, and soil organic matter mineralization (Ferreira and Martinez, 1997; Novais and Mello, 2007), whose rates are known to be controlled by soil pH.
The smaller pore diameter of HM, which is selective for some C soluble fractions during solution collection, could explain the lower accuracy of multiple regression for data obtained from the HM compared to Suolo Acqua results (Figure 5a). Furthermore, the time demanded to collect 15 mL of soil solution with the HM is higher than that recorded for Suolo Acqua. A high sampling time for collecting the soil solution with the HM sampler was also verified by Spangenberg et al. (1997). To avoid changes in the chemical composition, the soil solution should be extracted as quickly as possible (Zambrosi et al., 2008; Meurer and Anghinoni, 2012). Depending on the soil type, the time required to extract 15 mL of solution by the Suolo Acqua ranged from 2 to 4 h, a much smaller time than that required to extract the same volume of solution by the hydrophilic membrane. Technically, the Suolo Acqua was considered an acceptable method for sampling the soil solution since it recovered equivalent amounts of cations and anions measured by the HM sampler solutions. The contents of Na+ and soluble C found in solutions extracted by the HM are lower than those recovered by the Suolo Acqua, which may be explained by the pores of HM being selective for some large organic molecules regularly found in the soil solution. Thus, Suolo Acqua extracted the true amounts of soluble organic compounds found in the soil solution in an effective way. Considering all the solution analytes investigated in this study, the Suolo Acqua sampler is a fast, nondestructive, simple, and economical method for extraction of the soil solution, which does not clog the pores of the sampler. It may be used in successive samplings without affecting the chemical status of solutions from contrasting soils over different incubation periods. Thus, Suolo Acqua is an alternative to the expensive, imported samplers of the soil solution currently used in Brazilian crop fields.
CONCLUSIONS
The samplers tested do not differ in relation to the chemical composition of the soil solution, except for the fact that Suolo Acqua recovered more Na+ and soluble organic C than the hydrophilic membrane.
Cation+anion concentrations, C-soluble content, and electrical conductivity in the Latossolo Húmico and Cambissolo Háplico solutions are higher than the levels reported for the low organic matter sandy soil.
The chemical composition of the solution changes over time, with sharp modifications in pH, electrical conductivity, and cation and anion contents. Thus, analysis of the soil solution on only one occasion does not reflect the dynamics of its chemical composition, and may, according to the sampling time chosen, underestimate or overestimate the concentration of nutrients in the soil liquid phase.
Solution electrical conductivity is regulated by pH, sum of cation and anion concentrations, and water-soluble C contents.
ACKNOWLEGDMENTS
REFERENCES
Abad M, Noguera P, Burés S. National inventory of organic wastes for use as growing media for ornamental potted plant production: Case study in Spain. Bioresour Technol. 2001;77:197-200. doi:10.1016/S0960-8524(00)00152-8
Argo WR, Weesies BJ, Bergman EM, Marshal M, Biernbaum JA. Evaluating rhizon soil solution samplers as a method for extracting nutrient solution and analyzing media for container grown crops. HortTechnology. 1997;7:404-8.
Braccini MCL, Braccini ALE, Martinez HEP. Critérios para renovação ou manutenção de solução nutritiva em cultivo hidropônico. Semina: Cienc Agrár. 1999;20:48-57.
Chow AT, Guo F, Gao S, Breuer R, Dahlgren RA. Filter pore size selection for characterizing dissolved organic carbon and trihalomethane precursors from soils. Water Res.
2005;39:1255-64. doi:10.1016/j.watres.2005.01.004
Ciotta MN, Bayer C, Ernani PR, Fontoura SMV, Wobeto C, Alburquerque JA. Manejo da calagem e os componentes da acidez de Latossolo Bruno em plantio direto. Rev Bras Cienc Solo. 2004;28:317-26. doi:10.1590/S0100-06832004000200010
Claessen MEC, organizador. Manual de métodos de análise de solo. 2ª ed. Rio de Janeiro: Centro Nacional de Pesquisa de Solos; 1997.
Di Bonito M, Breward N, Crout N, Smith B, Young S. Overview of selected soil pore water extraction methods for the determination of potentially toxic elements in contaminated soils: operational and technical aspects. In: De Vivo B, Belkin HE, Lima A, editors. Environmental geochemistry. Site characterization, data analysis and case histories. Nottingham: Elsevier; 2008. p.213-49.
Falcon-Suarez I, Rammlmairb D, Riveraa RJ, Martin JD. Application of Rhizon SMS for the assessment of the hydrodynamic properties of unconsolidated fine grained materials. Eng Geol. 2014;172:69-76. doi:10.1016/j.enggeo.2014.02.001
Ferreira DF. Sisvar: a Guide for its Bootstrap procedures in multiple comparisons. Cienc Agrotec. 2014;38:109-12. doi:10.1590/S1413-70542014000200001
Ferreira PA, Martinez MA. Movimento e modelagem de sais no solo. In: Gheyi HR, Queiroz JE, Medeiros JF, editores. Manejo e controle da salinidade na agricultura irrigada. Campina Grande: Universidade Federal da Paraíba; 1997. p.171-206.
Franchini JC, Gonzalez-Vila FJ, Cabrera F, Miyazawa M, Pavan MA. Rapid transformations of plant water-soluble organic compounds in relation to cation mobilization in an acid Oxisol. Plant Soil. 2001;231:55-63. doi:10.1023/A:1010338917775
Gloaguen TV, Forti MC, Lucas Y, Montes CR, Gonçalves RAB, Herpin U, Melfi AJ. Soil solution chemistry of a Brazilian Oxisol irrigated with treated sewage effluent. Agric Water Manage. 2007;88:119-31. doi:10.1016/j.agwat.2006.10.018
Grossmann J, Udluft P. The extraction of soil water by the suction-cup method: a review. Soil Sci. 1991;42:83-93. doi:10.1111/j.1365-2389.1991.tb00093.x
Guppy CN, Menzies NW, Moody PW, Blamey FPC. Competitive sorption reactions between phosphorus and organic matter in soil: A review. Aust J Soil Res. 2005;43:189-202. doi:10.1071/SR04049
Hue NV. Alleviating soil acidity with crop residues. Soil Sci. 2011;176:543-9. doi:10.1097/SS.0b013e31822b30f1
Kiggundu N, Li Y, Migliaccio KW. Phosphorus adsorption by ceramic suction lysimeters. Vadose Zone J. 2010;9:1092-9. doi:10.2136/vzj2010.0052
Knight BP, Chaudri AM, Mcgrath SP, Giller KE. Determination of chemical availability of cadmium and zinc in soils using inert soil moisture samplers. Environ Pollut. 1998;99:293-8. doi:10.1016/S0269-7491(98)00021-9
Marsh KB, Tillman RW, Syers JK. Charge relationships of sulfate sorption by soils. Soil Sci Soc Am J. 1987;51:318-23. doi:10.2136/sssaj1987.03615995005100020011x
Mcbride MB, Blasiak JJ. Zinc and copper solubility as a function of pH in an acid soil. Soil Sci Soc Am J. 1979;43:866-70. doi:10.2136/sssaj1979.03615995004300050009x
Meijboom FW, van Noordwijk M. Rhizon soil solution samplers as artificial roots. In: Kutschera L, editor. Root ecology and its application. Proceedings of the 3rd
ISSR Symposium; 1992; Wien. Wien: 1992. p.793-5.
Menendez I, Gallardo JF, Vicente MA. Functional and chemical calibrates of ceramic cup water samplers in forest soils. Commun Soil Sci Plant Anal. 2003;34:1153-75. doi:10.1081/CSS-120019116
Meurer EJ, Anghinoni I. A solução do solo. In: Meurer EJ, editor. Fundamentos de química do solo. 5ª.ed. Porto Alegre: Evangraf; 2012. p.87-113.
Miranda J, Costa LM, Ruiz HA, Einloft R. Composição química da solução de solo sob diferentes coberturas vegetais e análise de carbono orgânico solúvel no deflúvio de pequenos cursos de água. Rev Bras Cienc Solo. 2006;30:633-47. doi:10.1590/S0100-06832006000400004
Novais RF, Mello JWV. Relação solo-planta. In: Novais RF, Alvarez VVH, Barros NF, Fontes RLF, Cantarutti RB, Neves JCL, editores. Fertilidade do solo. Viçosa, MG: Sociedade Brasileira de Ciência do Solo; 2007. p.133-204.
Oliveira MIL, Becquer T, Goedert WJ, Vilela L, Deleporte P. Concentração de íons na solução de um Latossolo Vermelho sob diferentes sistemas de manejo. Pesq Agropec Bras. 2011;46:1291-300. doi:10.1590/S0100-204X2011001000025
Pavinato OS, Rosolem CA. Disponibilidade de nutrientes no solo - decomposição e liberação de compostos orgânicos de resíduos vegetais. Rev Bras Cienc Solo. 2008;32:911-20. doi:10.1590/S0100-06832008000300001
Pinheiro GL, Silva CA, Lima JM. Soluble carbon in Oxisol under the effect of organic residue rates. Rev Bras Cienc Solo. 2014;38:810-20. doi:10.1590/S0100-06832014000300012
Pocknee S, Sumner ME. Cation and nitrogen contents of organic matter determine its soil liming potential. Soil Sci Soc Am J. 1997;61:86-92. doi:10.2136/sssaj1997.03615995006100010014x
Ronquim CC. Conceitos de fertilidade do solo e manejo adequado para as regiões tropicais. Campinas: Embrapa Monitoramento por Satélite; 2010.
Ross DS, Bartlett RJ. Effects of extraction methods and sample storage on properties of solutions obtained from forested Spodsols. J Environ Qual. 1990;19:108-13. doi:10.2134/jeq1990.00472425001900010015x
Sahrawat KL, Narteh LT. A fertility index for submerged rice soils. Commun Soil Sci Plant Anal. 2002;33:229-36. doi:10.1081/CSS-120002389
Santos HG, Jacomine PKT, Anjos LHC, Oliveira VA, Oliveira JB, Coelho MR, Lumbreras JF, Cunha TJF. Sistema brasileiro de classificação de solos. 3ª. ed. Rio de Janeiro: Embrapa Solos; 2013.
Sigfusson B, Paton GI, Gislason SR. The impact of sampling techniques on soil pore water carbon measurements of an Icelandic Histic Andosol. Sci Total Environ. 2006;369:203-19. doi:10.1016/j.scitotenv.2006.01.012
Santos AD, Coscione AR, Vitti AC, Boaretto AE, Coelho AM, Raij Bvan, Silva CA, Abreu Júnior CH, Carmo CAFS, Silva CR, Abreu CA, Gianello C, Andrade CA, Perez DV, Casarini DCP, Silva FC, Prata F, Carvalho FC, Santos GCG, Cantarella H, Fernandes HMG, Andrade JC, Quaggio JA, Chitolina JC, Cunha LMS, Pavan MA, Rosias MFGG, Tedesco MJ, Miyazawa M, Abreu MF, Eira PA, Higa RH, Massrubá SMFS, Gomes TF, Muraoka T, Vieira W, Melo WJ, Barreto WO. Manual de análises químicas de solos, plantas e fertilizantes. 2ª. ed. Brasília, DF: Embrapa Informação Tecnológica; Rio de Janeiro: Embrapa Solos; 2009.
Silva RH, Rosolem CA, Wong J. Liberação de cálcio e magnésio por cápsulas porosas de porcelana usadas na extração de solução do solo. Rev Bras Cienc Solo. 2004;28:605-10. doi:10.1590/S0100-06832004000400003
Smethurst PJ. Soil solution and other analyses as indicators of nutrient supply: a review. For Ecol Manage. 2000;138:397-411. doi:10.1016/S0378-1127(00)00426-6
Sousa DMG, Miranda LN, Oliveira SA. Acidez do solo e sua correção. In: Novais RF, Alvarez VVH, Barros NF, Fontes RLF, Cantarutti RB, Neves JCL, editores. Fertilidade do solo. Viçosa, MG: Sociedade Brasileira de Ciência do Solo; 2007. p.205-74.
Soil Survey Staff. Keys to soil taxonomy. 11th
ed. Washington, DC: USDA, Natural Resources Conservation Service; 2010.
Spangenberg A, Cecchini G, Lamersdorf N. Analyzing the performance of a micro soil solution sampling device in a laboratory examination and a field experiment. Plant Soil. 1997;196:59-70. doi:10.1023/A:1004213006295
Tisdale SL, Nelson WL, Beaton JD, Havlin JL, editors. Soil fertility and fertilizers. 5th
.ed. New York: Macmillan Publishing; 1993.
Trejo-Téllez LI, Gómez-Merino FC. Nutrient solutions for hydroponic systems. In: Asao T, editor. Hydroponics - a standard methodology for plant biological researches. [place unkown]: InTech; 2012. p.1-22.
Wolt JD. Soil solution chemistry: applications to environmental science and agriculture. New York: John Wiley & Sons; 1994.
Zambrosi FCB, Alleoni LRF, Caires EF. Liming and ionic speciation of an Oxisol under no-till system. Sci Agric. 2008;65:190-203. doi:10.1590/S0103-90162008000200013
Zhang GY, Yu TR. Coordination adsorption of anions. In: Yu TR, editor. Chemistry of variable charge soils. New York: Oxford University Press; 1997. p.175-218.
Zimmerman CF, Price MT, Montgomery JR. A comparison of ceramic and teflon in situ