SENSORY PROFILES OF CHOCOLATES PRODUCED
FROM COCOA CULTIVARS RESISTANT
TO Moniliophtora Perniciosa
1PAULA BACELAR LEITE2, ELIETE DA SILVA BISPO3, LIGIA REGINA RADOMILLE DE SANTANA4
ABSTRACT - The present study evaluated the sensory quality of chocolates obtained from two cocoa
cultivars (PH16 and SR162) resistant to Moniliophtora perniciosa mould comparing to a conventional cocoa that is not resistant to the disease. The acceptability of the chocolates was assessed and the promising cultivars with relevant sensory and commercial attributes could be indicated to cocoa producers and
chocolate manufacturers. The descriptive terminology and the sensory profile of chocolates were developed by Quantitative Descriptive Analysis (QDA). Ten panelists, selected on the basis of their discriminatory capacity and reproducibility, defined eleven sensory descriptors, their respective reference materials and the descriptive evaluation ballot. The data were analyzed using ANOVA, Principal Component Analysis (PCA) and Tukey’s test to compare the means. The results revealed significant differences among the sensory profiles of the chocolates. Chocolates from the PH16 cultivar were characterized by a darker brown color, more intense flavor and odor of chocolate, bitterness and a firmer texture, which are important sensory and commercial attributes. Chocolates from the SR162 cultivar were characterized by a greater sweetness and melting quality and chocolates from the conventional treatment presented intermediate sensory characteristics
between those of the other two chocolates. All samples indicated high acceptance, but chocolates from the
PH16 and conventional cultivars obtained higher purchase intention scores.
Index terms: Theobroma cacao, Witch’s broom, quantitative descriptive analysis.
PERFIL SENSORIAL DE CHOCOLATES PRODUZIDOS
A PARTIR DE CULTIVARES DE CACAU RESISTENTES AO
FUNGO
Moniliophtora Perniciosa
RESUMO – O presente estudo avaliou a qualidade sensorial de chocolates obtidos de dois cultivares de cacau
(PH16 e SR162) resistentes ao fungo Moniliophtora perniciosa, comparando com uma cultivar convencional
que não é resistente à doença. A aceitabilidade dos chocolates foi avaliada, as cultivares promissores com
atributos sensoriais e comerciais relevantes poderão ser indicadas aos produtores de cacau e processadores
de chocolates. A terminologia descritiva e o perfil sensorial dos chocolates foram desenvolvidos com base na Análise Descritiva Quantitativa (ADQ). Dez provadores, selecionados de acordo com sua capacidade de discriminação e reprodutibilidade, definiram onze descritores sensoriais, seus respectivos materiais de referência e a ficha de avaliação. Os dados foram analisados por ANOVA, Análise de Componentes Principais (ACP) e teste de Tukey, para comparação de médias. Os resultados revelaram diferenças significativas entre os perfis sensoriais dos chocolates. Os chocolates oriundos da cultivar PH16 foram caracterizados pela cor marrom mais escura, sabor e aroma de chocolate mais intenso, sabor mais amargo e textura mais firme, que são importantes atributos sensoriais e comerciais. Os chocolates oriundos da cultivar SR162 foram
caracterizados pela doçura mais intensa e maior derretimento, e os chocolates provenientes da cultivar
convencional apresentaram características sensoriais intermediárias entre aquelas dos outros dois chocolates. Todas as amostras apresentaram elevada aceitação, mas os chocolates das cultivares PH16 e convencional
obtiveram maiores índices de intenção de compra.
Termos para indexação: Theobroma cacao, Vassoura-de-bruxa, análise descritiva quantitativa.
1(Trabalho 230-12). Recebido em: 27-08-2012. Aceito para publicação em: 09-04-2013. Parte do Projeto de Pesquisa “Caracterização
e avaliação do desempenho tecnológico e sensorial de cultivares de cacau da Bahia, resistentes à vassoura-de-bruxa, para a produção de chocolates monovarietais”, financiado pelo CNPq (Processo n.2010/04669-0).
2Doutoranda em Engenharia Química, Instituto de Química, UFBA, Av. Ademar de Barros s/n, 40000-000, Salvador-BA, Brasil, E-mail:
bacelarleite@yahoo.com.br
3Profa. Dra. Mestrado em Ciências de Alimentos, UFBA/ Faculdade de Farmácia, Av. Ademar de Barros s/n, 40000-000,
Salvador--BA, Brasil, E-mail: eliete.bispo@gmail.com
4Profa Dra. Departamento Ciências da Vida, UNEB/Faculdade de Nutrição, Av. Silveira Martins, n.2555, 41195-001, Salvador-BA,
INTRODUCTION
The chocolate flavor consists of many compounds whose formation depends on the
genetic profile of the cocoa, the environment where
it was grown and the processing methods used.
The influence of the production methods begins
on the farm with post-harvest procedures, such as fermentation and drying, and continues in the
chocolate processing plants. The influence of the processing on the formation of the chocolate flavor
includes reactions that occur during the fermentation and drying of the cocoa beans, during the roasting of the beans, nibs or cocoa mass and in the conching of chocolate.
Chocolate is defined as the product obtained from a mixture of cocoa derivatives (Theobroma
cocoa L.), cocoa mass (or paste or liquor), cocoa
powder and cocoa butter, with other ingredients,
containing at least 25% (g/100 g) of total solids from cocoa (BRASIL, 2005). The product may be of many
forms and consistency and may be stuffed or covered.
In 2010, Brazil produced 582,000 tons of chocolate, a 13% increase from 2009, ranking third in world
chocolate production, behind only the United States
and Germany (ABICAB, 2012).
Currently, Theobroma cacao cultivars are recommended by the Cocoa Research Center
(CEPEC/CEPLAC) to Bahia’s farmers for the
formation of new crops that are more productive and uniform. Creating cultivars resistant to Moniliophtora
perniciosa, the fungus responsible for the cocoa
disease called “Witch’s broom”, is a primary aim of cocoa research. Witch’s broom infects the vegetative
growth or reproductive parts of the cocoa tree, promoting physiological and anatomical changes
in plants. Control of the Witch’s broom can only be
accomplished through the use of genetically resistant cultivars, which is associated with cultural handling
and chemical control (REHEM, 2006).
The use of different types of cocoa can confer differences in the sensory characteristics of
the chocolate. The quality and flavor of chocolate
typically depend on the origin of the cocoa beans, the proportions of the ingredients used and the processing methods, which differ according to consumers’ preferences and the practices of the chocolate
producer (LANZA et al., 2011). Sensory analysis is a powerful scientific tool that can be used to identify
differences in sensory attributes and assess product’s acceptability. In research, it can be advantageous to use descriptive sensory methods. Quantitative
Descriptive Analysis (QDA) is a sensory method
that can be used to provide a detailed description of
the sensory characteristics of a product (STONE; SIDEL, 2004). With QDA all detectable aspects of
a product are described and listed by a trained panel under the guidance of a panel leader. The list is used
to evaluate the product, and the panelists quantify the
sensory aspects of the product using an unstructured
scale (SVEINSDÓTTIR et al., 2010).
The objectives of this study were to obtain the
sensory profile and the acceptability of chocolates
produced from two cocoa cultivars resistant to
Moniliophtora perniciosa mould, compared with
a conventional cultivar that is not resistant to the disease, using a methodology based on QDA and the acceptance test.
MATERIALS AND METHODS
Three chocolate samples were evaluated
(containing 67% cocoa paste). The samples were
obtained from two cultivars resistant to Moniliophtora
perniciosa mould, SR162 and PH16, and from a
conventional cultivar (no resistant to the mould), which was used as the control treatment. The SR162
cultivar was originated from a genetic mutation of Catongo cocoa, which is characterized by white
seeds and the PH16 cultivar was obtained in a hybrid (Criollos and Forasteiros) cocoa tree population;
they were recommended by the Cocoa Research
Center (CEPEC/CEPLAC). The conventional cocoa
sample was produced from a blend of good and
sick seeds from the Pará, Parazinho and Maranhão
cultivars. All of them were originated from the state of Bahia, located in the Northeast of Brazil in a tropical climate.
The chocolates were made using the
following proportions: cocoa paste (63.0%), cocoa butter (6.6%), sugar (30.0%) and lecithin (0.4%).
The chocolates were manufactured in a factory of
the Riachuelo Farm on Ihéus-Itabuna road, state of
Bahia, Brazil. The fermented and dry seeds were
toasted in a circular toaster (Jaf Inox, São Paulo, Brazil) at 120 ºC for 2 hours and then triturated to
remove the peel and germ, in order to obtain cocoa
nibs. The nibs were ground in a knife-grinder (Jaf Inox, São Paulo, Brazil), with sugar added in this phase. The cocoa paste was then refined in a grinder-roller (Jaf Inox, São Paulo, Brazil), yielding a cocoa paste with an adequate granulation (21 μm) for
making chocolate. The refined paste was conched, which was performed in a horizontal shell at 60 ºC for 48 hours. The cocoa butter and the lecithin were
added during this phase. The chocolate was conveyed
stable crystals were obtained. The chocolate was molded into 5 g bars using a polyethylene mold,
cooled, packaged and maintained at 18 ºC.
QDA(STONE; SIDEL, 2004) was used to describe the differences and similarities between the chocolate samples obtained from three different cocoa cultivars. Ethical clearance approval for this study was granted by the Research Ethics Committee, Faculty of Medical Science, Federal
University of Bahia-UFBA (Process no 2011/1652). Forty individuals participated in the recruitment
(employees, researchers and students from the
Pharmacy Faculty-UFBA). Fourteen candidates were prescreened on the basis of their availability, general food habits, their ability to participate in group discussions, their ability to discriminate differences
between products (the Triangle Test was used)
and their ability to describe their perceptions. The fourteen candidates were given four training sessions
over a period of four weeks. Sensory descriptors for appearance, odor, flavor and texture were developed
through brainstorming about the similarities and
differences among the chocolate samples. The next step consisted in the development and definition
of each descriptive term under the supervision of a leader, aiming to join similar descriptive terms and to produce reference samples using round-table
consensus (Table 1). The training was finished when the fourteen individuals had no difficulty in evaluating
the samples using the descriptive evaluation ballot. In a final session, each sample was evaluated in triplicate by each panelist using a complete
block statistical design. Statistical evaluation was performed using an analysis of variance (ANOVA) for each descriptive term. The significance levels (p) for the F test (samples and replicates) were calculated
for each panelist. Ten individuals were selected as
panelists using the following criteria (DAMÁSIO; COSTELL, 1991): discriminatory power (psamples
<0.50) and reproducibility (preplicates ≥ 0.05).
The sensory evaluations of the samples were conducted on three series of tests. The chocolate
samples (2.5 g) of each treatment were placed in plastic plates codified with three-digit numbers and served at room temperature (22 ºC). The samples
were presented to the panelists using a balanced
complete block statistical design in order to eliminate
any serving order effect. The tests were conducted in the morning, at the Laboratory of sensory analysis - UFBA, using individual booths and white light.
It was recommended the use of filtered water for
cleansing the palate between samples. Ten panelists rated the intensity of each sensory descriptor for each sample, in triplicate, using unstructured scales of 9
cm, labeled on both ends with intensity terms, in the
left (lower anchor) and in the right (upper anchor).
The acceptance and purchase intention tests of the three chocolate samples were conducted with
sixty consumers of varied ages, who were students,
professors and employees of the UFBA, using a randomized design. A nine-point structured hedonic
scale (1= disliked extremely and 9= liked extremely)
was used in the acceptance test to evaluate the
appearance, odor, flavor, texture and global quality
of the samples. The purchase intention was evaluated
using a scale of 5 points (1= certainly would not buy
this product and 5= certainly would buy this product). The fracture tests were conducted in chocolate
samples conditioned at 25 ºC using a HDP/3PB Texture Analyzer (Stable Micro Systems LTD, Surrey, England) equipped with an 8 mm tip diameter
plunger, operating with the following conditions: 2.0 mm s-1 pre-test speed, test speed and post-test speed,
10 mm depth and 25% strain; trigger force 0.05 N,
compression force - return to start (ASAE, 2005).
The maximum force was expressed in Newtons (N).
The samples of each treatment were chocolate bars
measuring 9.0 x 2.5 x 1.3 cm, and the tests were
conducted in triplicate.
The QDA results were evaluated by ANOVA,
the sources of variance being the samples and the panelists for each sensory descriptor, using an F
test, and Tukey’s test (MSD-minimum significant difference) for multiple comparisons of means (α = 0.05). Principal Component Analysis (PCA) was
performed on the means of the subjects in each replicate, in order to describe the main variation in
the sensory data and to obtain the descriptive profiles. A correlation matrix was obtained to all quality attributes. An ANOVA for the acceptance test and the texture instrumental evaluation was performed using
an F test, and the treatment means were compared
using Tukey’s multiple range test at α = 0.05. SAS statistical software (SAS, 2008) was used for all
statistical analyses.
RESULTS AND DISCUSSION
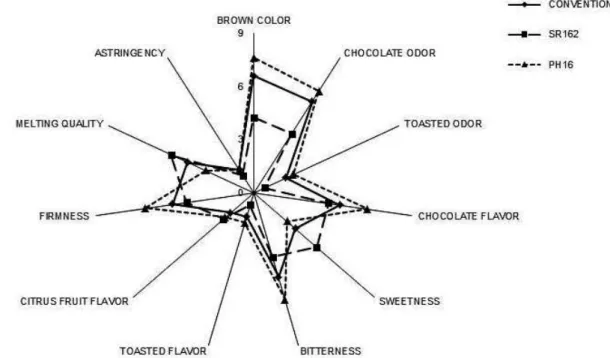
According to the QDA, there were significant differences (p < 0.05) in the sensory quality of the
chocolate samples from the cocoa cultivars studied. Figure 1 graphically displays the sensory
profile of each chocolate sample. The zero point of
the descriptor scale is the center, with the intensity
increasing toward the extremities of the figure. The
mean value of each descriptor for each sample is
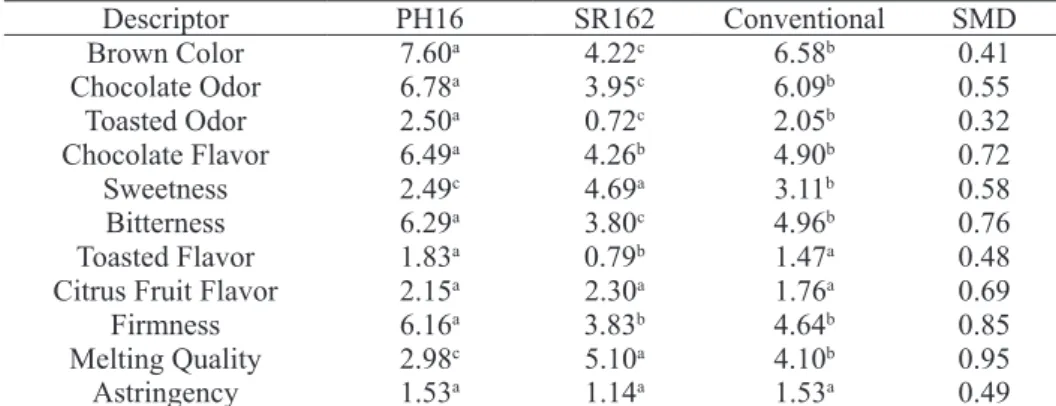
The results showed that the chocolate samples
differed significantly from each other (Table 2). The chocolate of PH16 cultivar was distinguished
from the other samples as a result of its greater intensity in descriptors brown color, chocolate odor,
chocolate flavor, bitterness and firmness and its lower intensity in sweetness and melting quality. However, the chocolate samples from SR162 demonstrated a more intense sweetness and greater melting quality. The citrus fruit flavor and the astringency presented
low intensity in the three samples, and there was no
significant difference (p>0.05) among them (Table 2); therefore, these descriptors were considered to be
not important in characterizing these products. The
toasted odor and toasted flavor also presented low intensity in the three samples, but showed significant
differences among them.
Figure 2 illustrates the PCA results, in which
each sample is represented by a triangle. Each vertex
of the triangles corresponds to the mean value attributed by the panelist group for each replicate.
Samples are located near the descriptors (vectors)
that characterize them. In the present study, the two principal components were used together and
explained 92.6% of the total variability observed among the treatments. PCA confirmed ANOVA results. The chocolate samples from the PH16
cultivar were characterized by descriptors brown
color, chocolate odor, chocolate flavor, bitterness,
firmness, toasted odor and toasted flavor. The
chocolate samples from the SR162 cultivar were
characterized primarily by sweetness and melting
quality. Chocolate samples from the conventional
cultivar presented intermediate intensity for all sensory descriptors.
Thamke et al. (2009) examined the analytical skills of consumers from two different locations (Dresden, Germany and Vienna, Austria) to characterize samples of dark chocolate with cocoa contents ranging from 60 to 75%. PCA was used and explained approximately 85% of the total variation
between the products. The authors concluded that chocolate with the lower cocoa content was characterized by the greatest melting and creaminess while the product with the highest cocoa content was characterized as dry dough.
Lanza et al. (2011) studied the sensory characteristics of chocolate known as Sicilian
Modica, using a panel of trained tasters. The panel
identified a different sensory profile from other types
of chocolate, due to the presence of sugar crystals
and a sandy texture, resulting from its peculiar form of production. The total variability explained by the first two principal components was 75%. Despite its
diversity, the chocolate of Modica did not lose two sensory descriptors that are typical characteristics of
chocolate: melting and cocoa flavor.
Misnawi et al. (2005) studied changes
in polyphenol ability to produce astringency
during roasting and fermentation of cocoa; these substances are involved in the chocolate’s flavor
and in the primary sensory characteristics as bitter and astringency intensity of the cocoa. The results indicated that the polyphenols were positively correlated with astringency, bitterness and green notes. The presence of different levels of polyphenols found in the products may be due to the fermentation
and roasting conditions; however, polyphenols are
essential for the sensory characteristics of the cocoa.
Kennedy and Heymam (2009) conducted a study of milk and dark chocolates with two panelist groups (trained and untrained), using Principal Component Analysis (PCA) and multifactor analysis
to generate product maps of the descriptive analysis
and projective mapping data, respectively. Visual
inspection of the PCAs indicated the chocolates were primarily separated by contrasting the sweet and dairy notes with bitterness and astringency. Each panel further differentiated chocolates with terms including fruity, musty and tobacco. Panels appeared to use the descriptors fruity, caramel, dairy, astringent, cocoa and other descriptors in a similar manner, despite no effort to standardize the
use of these terms across the panels. However for
all panels, many of these terms were correlated with each other and grouped closely together in the PCA plots. Some of these terms may be describing related characteristics of the chocolates, especially in regard
to the milk chocolates.
Luna et al. (2002) conducted a study with
a sample of Ecuadorian cocoa to determine the relationship between the genotypes and the chemical
constituents (polyphenols, alkaloids, organic acids
and sugars) involved in the chocolate’s aroma and
flavor, and the primary sensory characteristics of the product (bitter, astringent intensity of the cocoa flavor, fruity acidity, floral notes and green), using
a panel of trained tasters. The results indicated that the polyphenols were positively correlated with astringency, bitterness and negatively correlated with the fruity character. The presence of different levels of polyphenols found in the products may be due to either a genotypic contribution or the fermentation
and roasting conditions; however, polyphenols are
essential for the sensory characteristics of the cocoa. In this study, there was high positive correlation between brown color and the descriptors
(0.94), toasted flavor (0.97), chocolate flavor (0.87) and firmness (0.88), as indicated in Table 3. Thus, the
chocolate sample that had a more intense brown color also yielded a higher intensity in descriptors such as
chocolate odor, chocolate flavor, bitterness, firmness, toasted odor and toasted flavor. Sweetness presented a high negative correlation (-0.94) with bitterness,
and the same relationship was observed with toasted
flavor (-0.97). The chocolate sample with a higher intensity of bitterness and toasted flavor obtained
lower sweetness ratings. A high negative correlation
(-0.97) was also observed between the firmness and melting quality. The chocolate samples that melted quickly required less force to bite.
The results of the fracture tests showed that
the chocolate samples from PH16 required greater force (31.01 N) to rupture while the samples from the SR162 cultivar (23.64 N) and conventional cultivar (24.02 N) required significantly (p<0.05) less force
to rupture. According to the QDA, the chocolate
samples from the PH16 cultivar were characterized by significantly (p<0.05) greater firmness than the other two samples. The texture is one of principal factors used to evaluate the quality of the products by
the consumers, and two other important factors are
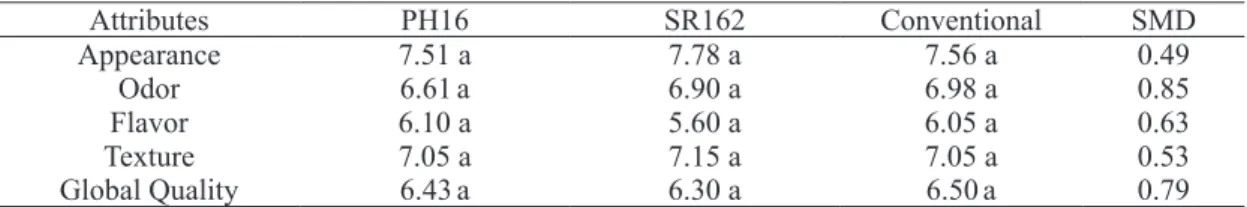
the appearance and flavor (AFOAKWA et al., 2009). In general, the three chocolate samples showed good sensory acceptance related to all
studied attributes: appearance, odor, flavor, texture and global quality. They reached score corresponding to hedonic terms “liked slightly” and “liked very much”. The results of the acceptance test indicated that there were not significant differences (p>0.05)
in the acceptance of the three chocolate samples
(Table 4). The results of the purchase intention test
indicated that the attitude of the consumers was highly positive for all the chocolate samples. The
purchase intention scores were 46.7%, 38.3% and 46.6% for the chocolate samples from the PH16, the SR162 and the conventional cultivar, respectively.
FIGURE 1 - Sensory profile of the chocolate samples produced from resistant and conventional cocoa
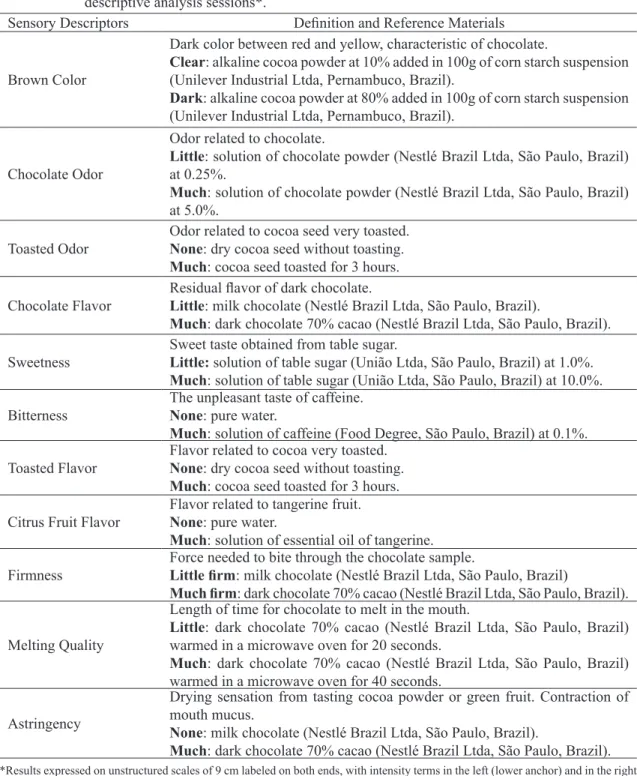
TABLE 1 – Sensory descriptors, definition and reference materials used during panel training and quantitative
descriptive analysis sessions*.
Sensory Descriptors Definition and Reference Materials
Brown Color
Dark color between red and yellow, characteristic of chocolate.
Clear: alkaline cocoa powder at 10% added in 100g of corn starch suspension (Unilever Industrial Ltda, Pernambuco, Brazil).
Dark: alkaline cocoa powder at 80% added in 100g of corn starch suspension (Unilever Industrial Ltda, Pernambuco, Brazil).
Chocolate Odor
Odor related to chocolate.
Little: solution of chocolate powder (Nestlé Brazil Ltda, São Paulo, Brazil) at 0.25%.
Much: solution of chocolate powder (Nestlé Brazil Ltda, São Paulo, Brazil) at 5.0%.
Toasted Odor
Odor related to cocoa seed very toasted.
None: dry cocoa seed without toasting. Much: cocoa seed toasted for 3 hours.
Chocolate Flavor
Residual flavor of dark chocolate.
Little: milk chocolate (Nestlé Brazil Ltda, São Paulo, Brazil).
Much: dark chocolate 70% cacao (Nestlé Brazil Ltda, São Paulo, Brazil).
Sweetness
Sweet taste obtained from table sugar.
Little: solution of table sugar (União Ltda, São Paulo, Brazil) at 1.0%.
Much: solution of table sugar (União Ltda, São Paulo, Brazil) at 10.0%.
Bitterness
The unpleasant taste of caffeine.
None: pure water.
Much: solution of caffeine (Food Degree, São Paulo, Brazil) at 0.1%.
Toasted Flavor
Flavor related to cocoa very toasted.
None: dry cocoa seed without toasting. Much: cocoa seed toasted for 3 hours.
Citrus Fruit Flavor
Flavor related to tangerine fruit.
None: pure water.
Much: solution of essential oil of tangerine.
Firmness
Force needed to bite through the chocolate sample.
Little firm: milk chocolate (Nestlé Brazil Ltda, São Paulo, Brazil)
Much firm: dark chocolate 70% cacao (Nestlé Brazil Ltda, São Paulo, Brazil).
Melting Quality
Length of time for chocolate to melt in the mouth.
Little: dark chocolate 70% cacao (Nestlé Brazil Ltda, São Paulo, Brazil)
warmed in a microwave oven for 20 seconds.
Much: dark chocolate 70% cacao (Nestlé Brazil Ltda, São Paulo, Brazil)
warmed in a microwave oven for 40 seconds.
Astringency
Drying sensation from tasting cocoa powder or green fruit. Contraction of mouth mucus.
None: milk chocolate (Nestlé Brazil Ltda, São Paulo, Brazil).
Much: dark chocolate 70% cacao (Nestlé Brazil Ltda, São Paulo, Brazil).
FIGURE 2 - Principal Component Analysis (PCA) of sensory data of chocolate samples produced from
resistant and conventional cocoa cultivars. PCA loadings and scores for principal component 1 and 2, including all evaluated sensory descriptors.
TABLE 2 – Means of sensory descriptors that characterized the chocolate samples produced from resistant
and conventional cocoa cultivars.
Descriptor PH16 SR162 Conventional SMD Brown Color 7.60a 4.22c 6.58b 0.41 Chocolate Odor 6.78a 3.95c 6.09b 0.55 Toasted Odor 2.50a 0.72c 2.05b 0.32 Chocolate Flavor 6.49a 4.26b 4.90b 0.72 Sweetness 2.49c 4.69a 3.11b 0.58 Bitterness 6.29a 3.80c 4.96b 0.76 Toasted Flavor 1.83a 0.79b 1.47a 0.48 Citrus Fruit Flavor 2.15a 2.30a 1.76a 0.69 Firmness 6.16a 3.83b 4.64b 0.85 Melting Quality 2.98c 5.10a 4.10b 0.95 Astringency 1.53a 1.14a 1.53a 0.49
For each attribute, means (n=3) in the same line accompanied by the same letter no differ significantly, according to Tukey test (p≤ 0.05). SMD = significative minimum difference (Tukey’s test).
PH16 and SR162= cultivars resistant to Moniliophtora perniciosa; Conventional= no resistant.
TABLE 3 – Correlation coefficients between the sensory descriptors obtained from principal component
analysis of chocolate samples produced from resistant and conventional cocoa cultivars.
BROC CHOO TOAO CHOFSWETBITT TOAF CIFF FIRM MELT ASTR BROC 1.00
CHOO 0.98 1.00
TOAO 0.98 0.97 1.00
CHOF 0.87 0.84 0.86 1.00 SWET -0.98 -0.97 -0.99 -0.88 1.00
BITT 0.94 0.92 0.92 0.96 -0.94 1.00
TOAF 0.97 0.96 0.98 0.88 -0.97 0.92 1.00
CIFF -0.23 -0.32 -0.20 0.11 0.16 -0.02 -0.16 1.00
FIRM 0.88 0.86 0.84 0.95 -0.87 0.96 0.85 0.08 1.00
MELT -0.88 -0.88 -0.84 -0.89 0.88 -0.93 -0.84 0.02 -0.97 1.00
ASTR 0.64 0.68 0.59 0.42 -0.58 0.58 0.62 -0.47 0.48 -0.48 1.00
CONCLUSIONS
1-There was significant difference among
the chocolate samples according to Quantitative Descriptive Analysis and the Principal Component
Analysis explained 96.6% of total variability. The chocolate samples from the PH16 cultivar were
characterized by a higher intensity of brown color, chocolate odor, chocolate flavor, bitterness and
firmness. The chocolate samples from the SR162
cultivar were characterized primarily by sweetness
and melting quality. The chocolate samples from
the conventional cultivar presented an intermediate intensity for all sensory descriptors studied. The three chocolate samples showed good sensory acceptance
related to all studied attributes (appearance, odor, flavor, texture and global quality), without significant
differences among them.
2-High correlations were found among
sensory characteristics, as positive correlation of
chocolate odor, chocolate flavor, bitterness, toasted
odor and toasted flavor with brown color, and
negative correlation of bitterness and toasted flavor with sweetness, firmness and melting quality.
TABLE 4 – Sensory acceptance means of the chocolate samples produced from resistant and conventional
cocoa cultivars.
Attributes PH16 SR162 Conventional SMD
Appearance 7.51 a 7.78 a 7.56 a 0.49
Odor 6.61a 6.90 a 6.98 a 0.85
Flavor 6.10 a 5.60 a 6.05 a 0.63
Texture 7.05 a 7.15 a 7.05 a 0.53
Global Quality 6.43a 6.30 a 6.50a 0.79
For each attribute, means (n=60) in the same line accompanied by the same letter no differ significantly, according to Tukey test (p≤ 0.05). SMD = significative minimum difference (Tukey’s test).
PH16 and SR162= cultivars resistant to Moniliophtora perniciosa; Conventional= no resistant.
REFERENCES
ABICAB - Associação Brasileira da Industria de Chocolates, Cacau, Amendoim, Balas e Derivados..
Exportação. Disponível em: <http://www.abicab. org.br>. Acesso em: 12 abr. 2012.
AFOAKWA, E.O.; PATERSON, A.; FOWLER, M.; VIEIRA, J. Microstructure and mechanical properties
related to particle size distribution and composition
in dark chocolate. International Journal of Food Science and Technology, Oxford, v. 44, p.111–119,
2009.
ASAE - American Society of Agricultural Engineers. Agricultural engineers yearbook of standards. 16th ed. St. Joseph, 2005.
BRASIL. Ministério da Saúde. Agência Nacional de Vigilância Sanitária. Legislação. VisaLegis.
ResoluçãoRDC Nº 264, de 22 de setembro de 2005.
Regulamento técnico para chocolate e produtos de cacau. Disponível em: <http://e-legis.bvs.br/leisref/ public/showAct.php>. Acesso em: 06 mar. 2012.
DAMASIO, M.H.; COSTELL, E. Análisis sensorial descriptivo: generación de descriptores y seleción de
catadores. Revista Agroquímica de Technología de Alimentos, San Jose, v. 31, n. 2, p. 165-178, 1999.
KENNEDY, J.; HEYMANN, H. Projective Mapping and descriptive analysis of milk and dark chocolates.
Journal of Sensory Studies, Washington, v. 24, n.1,
p.220-233, 2009.
LANZA, C.M.; MAZZAGLIA, A.; PAGLIARINI, E. Sensory profile of a specialty sicilian chocolate.
International Journal of Food Science, Oxford, v. 23, p.36-44, 2011.
LUNA, F.; CROUZILLAT, D.; CIROU, L.; BUCHELI, P. Chemical composition and flavor of Ecuadorian cocoa liquor. Journal of Agricultural Food Chemistry, Washington, v. 50, n.12,
p.3527-3532, 2002.
MISNAWI, J.S.; JINAP, S.; JAMILAH, B.; NAZAMID, S. Achanges in polyphenol ability to produce astringency during roasting of cocoa liquor.
Journal of the Science of Food and Agriculture,
London, v. 85, n. 6, p. 917-924, 2005.
REHEM, B.C. Respostas fisiológicas de clones de Theobroma cacao L. ao alagamento do substrato.
SAS - Statistical Analysis System for windows. User’s procedures guide. Version 6. Cary, 2008. 2v.
STONE, H.; SIDEL, J.L. Sensory evaluation pratices. 3.ed. London: Elsevier Academic Press, 2004. 377 p. (Food Science and Technology. International Series).
SVEINSDÓTTIR, K.; MARTINSDÓTTIR, E.; HYLDIG, G.; SIGURGÍSLADÓTTIR, S. Sensory
Characteristics of Different Cod Products. Journal of Sensory Studies, Chicago, v. 25, p.294–314, 2010.
THAMKE, I.; DURRSCHMID, K.; ROHMA, H.
Sensory description of dark chocolates by consumers.
Food Science Technology, Chicago, v. 42, p.534–