Ana Paula Bortoletto MartinsI Maria Helena D’Aquino BenicioII
I Programa de Pós-graduação em Nutrição
em Saúde Pública. Faculdade de Saúde Pública (FSP). Universidade de São Paulo (USP). São Paulo, SP, Brasil
II Departamento de Nutrição. FSP-USP. São
Paulo, SP, Brasil Correspondence:
Ana Paula Bortoletto Martins Faculdade de Saúde Pública da USP Av. Dr. Arnaldo, 715 – Cerqueira Cesar 01246-904 São Paulo, SP, Brasil E-mail: [email protected] Received: 7/23/2010
Approved: 4/6/2011
Article available from: www.scielo.br/rsp
Infl uence of dietary intake
during gestation on postpartum
weight retention
ABSTRACT
OBJECTIVE: To evaluate the infl uence of dietary intake during gestation on postpartum weight retention.
METHODS: A total of 82 healthy pregnant women who began prenatal care
at public healthcare services in the Municipality of São Paulo (Southeastern Brazil) between April and June 2005 were followed up. Weight and height were measured in the fi rst interview (up to 16 weeks of gestation) and the weight measure was repeated during a household visit 15 days after delivery. The 24-Hour Dietary Recall method was employed to evaluate dietary intake at the three trimesters of gestation. The mean ingestion of saturated fat, fi bers, added sugar, soft drinks, processed foods, fruits and vegetables, as well as the dietary energy density were calculated. Weight retention was estimated by the difference between the measure of the postpartum weight and the fi rst measured weight. The infl uence of dietary intake on postpartum weight retention was assessed by multiple linear regression analysis and the linear trend test was performed. The variables used to adjust the model were: body mass index at the beginning of gestation, height, per capita family income, smoking, age, and level of schooling.
RESULTS: The mean body mass index at the beginning of gestation was 24
kg/m2 and the mean weight retention was 1.9 kg. The increase in saturated
fat intake (p=0.005) and processed foods ingestion (p=0.014) signifi cantly increased postpartum weight retention, after adjustment by the control variables. The other dietary intake variables did not present a signifi cant relationship to the outcome variable.
CONCLUSIONS: The increased intake of unhealthy food, such as processed
foods, and of saturated fat infl uences the increment of postpartum weight retention.
DESCRIPTORS: Pregnancy. Food Consumption. Weight Gain.
Postpartum Period.
INTRODUCTION
According to the World Health Organization (WHO), inadequate diet and sedentary lifestyle are the two risk factors that most contribute to the increase in the prevalence of overweight and obesity all over the world.27 Unhealthy
dietary habits are present in all the phases of the vital cycle and can affect even more vulnerable population groups, including women in the gestation period. One of the habits that promote excessive weight gain is the high ingestion of sugar-sweetened beverages and foods with high energy density which, in general, are poor in fi bers, micronutrients and water, and high in fat, sugar or starch.26 In addition, the literature reports the association between greater
Excessive weight gain during gestation predisposes to postpartum obesity and its complications. Numerous studies show the positive association between exces-sive weight gain during gestation and weight retention for up to three years after delivery.8,10,14,16 A study
based on data from 50 Demographic Health Surveys conducted in developing countries pointed to the importance of excessive weight gain during gestation and weight retention after delivery as predictors of the increase in overweight prevalence in women of child-bearing age, mainly in richer developing countries, such as those of Latin America.9
The relationship between higher ingestion of calories and the increase in weight gain during gestation has been demonstrated in the literature since the 1990s.8
Nowadays, studies aim to relate dietary characteristics and patterns during gestation to weight gain in this period and postpartum weight retention. Studies associate the increased energy density of the diet and a dietary pattern characterized by fast food (candies, chocolates, processed meat, soft drinks, among others) in the gesta-tional period with the increase in weight gain at the end of pregnancy.5,24 According to Oken et al,19 unhealthy
dietary habits, like higher frequency of snacks and lower number of main dishes (lunch) are associated with higher weight retention up to one year after delivery.
Lacerda et al11 (2007) administered a food frequency
questionnaire referring to the gestational period to 467 puerperal women in the Municipality of Rio de Janeiro, Southeastern Brazil, and observed excessive intake of energy and saturated fat during gestation and in the postpartum period.
Also in the Municipality of Rio de Janeiro, Rodrigues et al21 (2008) administered a food frequency
question-naire to 173 women. Gestational weight gain was lower among those who presented adequate energy intake, in accordance with the recommendation of the Food and Agriculture Organization.
Up to the present moment, Brazilian studies that eval-uate the infl uence of the dietary pattern during gestation on postpartum weight retention are not known. Thus, this study aimed to evaluate the infl uence of dietary intake during gestation on weight retention 15 days after delivery.
METHODS
This is a study nested in a cohort of 225 pregnant women who received prenatal care at fi ve primary care units of the Municipality of São Paulo (Southeastern
Brazil). The inclusion criteria were: women older than 18 years, with low-risk pregnancy, and gestational age equal to or below 16 weeks at the moment of the
fi rst interview. For the analyses of the present study, pregnant women with no weight information 15 days after delivery or with energy intake below 500 kcal or above 5,000 kcal were excluded, so as to withdraw biologically implausible data.26
The fi nal sample was constituted of 82 pregnant women, who began to receive prenatal care between April and June 2005. The Figure illustrates the total number of captured and eligible pregnant women and the reasons for the losses. Information on socioeconomic level, lifestyle and obstetric history was obtained during interviews performed during the prenatal consultations. Gestational age was calculated based on the date of the last menstruation informed by the pregnant woman. Standardized procedures were followed for anthropo-metric assessment.15 All the anthropometric measures
were calculated twice and their mean was considered for analysis. The weight was measured by Tanita scales with acuity of 200 g and capacity for 150 kg. The height was measured by a Seca stadiometer with acuity of 1.0 mm and capacity for 2.0 m.
Weight and height were measured in the fi rst interview. In the other interviews and in the puerperium household visit, the weight measure was repeated. The means of the two weight and height measures calculated in the
fi rst prenatal consultation (up to the 16th week; 72%
occurred before the 14th week) were used to calculate
the body mass index (BMI = weight/height2) at the
beginning of pregnancy.
The 24-Hour Dietary Recall method (Rec24h) was employed to evaluate the dietary intake, being administered once in each trimester of gestation, in distinct weekdays, including weekends and holidays. The mean intake of the three measures was used for the analyses. The foods informed in each one of the recalls were converted into energy, fi ber and saturated fat according to the nutritional food composition of the Brazilian Food Composition Table.a The ingestion of
added sugar (in grams and kilocalories) was calculated based on a specifi c table of the U.S. Department of Agriculture.b Whenever necessary, the calculation
was made based on the recipes and the corresponding correction factor, duly applied.c
After the calculation of the chemical composition, the foods were classifi ed into the following groups: fruits and vegetables (FV), soft drinks and processed
a Universidade Estadual de Campinas, Núcleo de Pesquisas em Alimentação - NEPA. Tabela Brasileira de Composição de Alimentos - TACO.
2. ed. Campinas; 2004.
b U.S. Department of Agriculture, Agricultural Research Center, Nutrient Data Laboratory. USDA database for added sugars content of selected
foods: release 1. Beltsville; 2006.
c Instituto Brasileiro de Geografi a e Estatística - IBGE. Estudo Nacional de Despesa Familiar - ENDEF: tabela de composição de alimentos. 4.
foods. Cookies, salty foods, soft drinks, cold meats and sausages, candies, cakes, bread, pizzas, fast-food sandwiches, broths, sauces and ready-to-eat meals were considered processed foods. Finally, the total dietary energy density (kcal/g) was determined by the division between the total energy intake and the sum of the quan-tity in grams of all ingested foods (except for liquids). Postpartum weight retention was evaluated by the net weight gain, that is, the difference between the weight measured in the puerperium visit (performed approximately 15 days after delivery) and the weight measured in the fi rst interview. That measure expresses the total fat accumulated during pregnancy, in view of the fact that at this moment of the postpartum period, the liquid accumulated during pregnancy has already been eliminated.13
The total energy intake, the ingested amount (g or kcal) of each food or nutrient and the dietary energy density were considered to characterize the pegnant women’s diet, based on the information provided in the three Rec24h. The dietary intake variables were analyzed in continuos form (mean and 95% confi dence intervals) and also categorized in thirds. The mean weight reten-tion was calculated by each third of the dietary intake variables: FV, fi ber and saturated fat (g); added sugar, soft drinks and processed foods (kcal); and dietary energy density (kcal/g).
Simple and multiple linear regression analyses were carried out separately for each dietary intake variable, with postpartum weight retention as the outcome. The following adjustment variables were used in the regres-sion models: BMI at the beginning of the follow-up, woman’s height, per capita family income, level of schooling (completed years of study), age and smoking, categorized as “smokes or stopped smoking during gestation” and “does not smoke or stopped smoking before gestation”. The control variables correlated (p<0.20) with the response variable were tested, or the ones that were considered relevant in the study’s context. Those which modifi ed by more than 10% the regression coeffi cient were maintained. The dichotomous variables were categorized as “0” and “1” and the other categorical variables were transformed into dummy variables. To test for linear trend among each third of dietary intake variables, a similar linear regression model was performed, but without the transformation of these vari-ables into dummy varivari-ables. A level of signifi cance of 0.05 was adopted in all the statistical tests. The software Stata 9.1 was utilized for the analyses.
The research project was approved by the Ethics Committee of the School of Public Health of
Universidade de São Paulo. All the interviewees signed a consent document after being informed of the research.
Figure. Eligible, non-eligible pregnant women and loss to follow-up. São Paulo, Southeastern Brazil, 2005.
Beginning of follow-up n = 225
12 abortions 11 high-risk gestations 1 twin pregnancy
1 pregnant woman with gestational age above 16 weeks 1 case of toxoplasmosis
9 cases attended only one prenatal consultation
n= 189
33 losses to follow-up 10 refusals
1 pregnant woman moved to another city
6 pregnant women attended less than 3 consultations
n= 139
23 pregnant women with no weight retention data 16 pregnant women without three 24-hour dietary recalls 18 pregnant women with implausible dietary intake
n= 82 pregnant women Losses n = 50
26.5% of the eligible women non-eligible
n= 36
Losses of the present study n= 57
RESULTS
The studied pregnant women were, on average, 26 years old and their mean BMI at the beginning of pregnancy was 24 kg/m2. Follow-up started, on average, in the
12th week of gestation, and it was the fi rst gestation
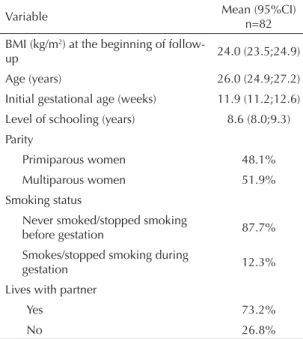
for approximately half of the women. The majority never smoked or stopped smoking before gestation (87.7%) and lived with their partners (73.2%) (Table 1). No statistically signifi cant differences were detected between the studied cohort and loss to follow-up regarding sociodemographic characteristics such as age, level of schooling, parity, income, smoking and pres-ence of partner, and concerning the initial nutritional status (data not shown).
The mean ingestion of added sugar was approximately 271 kcal. Calories of the processed foods (393.1 kcal)
represented 20.4% of the total energy intake (TEI). Dietary energy density corresponded to 1.9 kcal/g, and calories obtained from liquid foods were equivalent to approximately 5% of the TEI (Table 2).
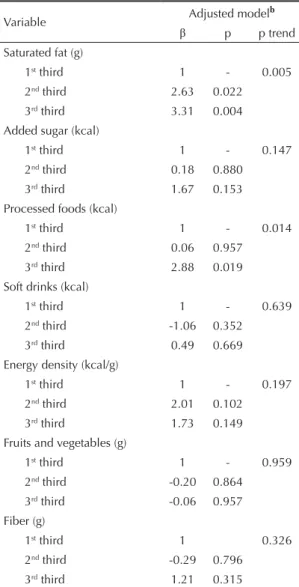
The mean weight retention of the studied women was 1.9 kg. In the crude analysis, it was verifi ed that the mean postpartum weight retention increased as the intake of saturated fat, fi ber, processed foods and added sugar increased. In the simple linear regression analyses, a statistically signifi cant association was detected between the increased intake of saturated fat (p for trend = 0.006) and of processed foods (p for trend = 0.009) and the increase in weight retention (Table 3). In the multiple linear regression analyses, the linear and positive trend of weight retention remained statistically signifi cant as the intake of saturated fat (p for trend = 0.005) and of processed foods (p for trend = 0.014) increased (Table 4).
The outcome variable had normal distribution in the regression analyses. The residuals analysis of the linear regression models indicated that the models are well adjusted (data not shown).
DISCUSSION
Higher intake of saturated fat and processed foods showed a statistically signifi cant correlation to weight retention 15 days after delivery, independently of family income and maternal level of schooling, height, age and smoking.
The mean weight retention was 1.9 kg, in accor-dance with the fi ndings of Walker et al (2005),25 who
conducted a literature review and found weight reten-tion values between -0.6 kg and 9.6 kg, in periods that varied from two to six weeks after delivery. According to Walker et al,25 weight gain during gestation is one of
the main predictors of weight retention in a time interval of up to six weeks after delivery. Besides, few studies approach other possible factors related to this outcome. A cohort study carried out in Sweden between the decades of 1980 and 1990 evaluated the diet of women before, during and after pregnancy by means of a ques-tionnaire with seven questions. The authors of the study concluded that weight retention from one to six months after delivery was higher among women who increased energy intake and the frequency of snacks per day in the gestational period.18
A meta-analysis with 19 controlled intervention studies concluded that ad libitum diets low in lipids promoted a reduction of at least 3.2 kg in a period of 2 to 12 months.1 Diets high in fat tend to have higher energy
density compared to isocaloric diets with reduced levels of this nutrient. Diets with high energy density, in turn, have been related to weight gain during gestation since
Table 1. Characterization of the fi nal sample, according to socioeconomic, anthropometric and lifestyle variables. São Paulo, Southeastern Brazil, 2005.
Variable Mean (95%CI)n=82
BMI (kg/m2) at the beginning of
follow-up 24.0 (23.5;24.9)
Age (years) 26.0 (24.9;27.2)
Initial gestational age (weeks) 11.9 (11.2;12.6)
Level of schooling (years) 8.6 (8.0;9.3)
Parity
Primiparous women 48.1%
Multiparous women 51.9%
Smoking status
Never smoked/stopped smoking
before gestation 87.7%
Smokes/stopped smoking during
gestation 12.3%
Lives with partner
Yes 73.2%
No 26.8%
BMI: Body mass index
Table 2. Dietary intake during gestation. São Paulo, Southeastern Brazil, 2005. (n=82)
Variable Mean 95%CI
Energy (kcal) 1922.7 1810.5;2035.0
Saturated fat (g) 20.6 18.2;22.9
Fruits and vegetables (g) 335.7 279.4;391.9
Fiber (g) 6.5 5.3;7.6
Added sugar (kcal) 270.9 226.0;315.7
Soft drinks (kcal) 90.1 68.3;112.0
Processed foods (kcal) 393.1 330.3;455.9
the 1990s.8 According to Lagiou et al, the increase in
the ingestion of animal fat is related to higher weight gain up to the 27th week of gestation, after adjustment
by BMI and other lifestyle factors.12
Oken et al19 (2007) found an association between the
retention of at least 5 kg one year after delivery with the increased intake of total and trans fat and the reduction in fi ber ingestion.
Considering that energy unbalance is part of the mecha-nism of the dietary infl uence on weight retention, the model was not adjusted by energy intake, because, by doing this, the effect that is the object of this study is eliminated.26 Studies confi rm that the total caloric
ingestion, besides being part of the studied mechanism, is associated with the outcome, excluding the need to
adjust it in the model.2 In fact, the results obtained when
adjusting the multiple linear regression models by energy showed that the relations between weight reten-tion and the ingesreten-tion of saturated fat and processed foods lost statistical signifi cance (data not shown). The measurement of dietary intake by Rec24h has advantages over other methods, such as the possibility of characterizing the ingestion of a wide variety of foods, as the instrument is open and any type and amount of food is registered. Perssonet al20 (2001),
in a longitudinal assessment of Rec24h with 451 pregnant women, concluded that the utilization of the mean of three Rec24h, administered on different weekdays, allows the characterization of dietary intake, mainly of energy and macronutrients that have lower intra-individual variability. Furthermore, to minimize
Table 3. Mean weight retention 15 days after delivery and 95% confi dence intervals, according to dietary intake variables. São Paulo, Southeastern Brazil, 2005. (n=82)
Variable retention (kg)Weight 95%CI Crude model
a
β p p trend
Saturated fat (g)
1st third 0.21 -1.33;1.77 1 - 0.006
2nd third 1.88 0.46;3.29 1.66 0.124
3rd third 3.22 1.52;4.92 3.00 0.007
Added sugar (kcal)
1st third 1.17 -0.54;2.88 1 - 0.121
2nd third 1.27 -0.01;2.55 0.10 0.929
3rd third 2.90 1.13;4.68 1.73 0.122
Processed foods (kcal)
1st third 2.18 0.55;3.80 1 - 0.009
2nd third 1.22 0.03;2.42 0.60 0.576
3rd third 1.94 -0.04;3.92 2.89 0.009
Soft drinks (kcal)
1st third 0.62 -0.98;2.22 1 - 0.833
2nd third 1.22 -0.20;2.64 -0.95 0.395
3rd third 3.51 1.87;5.14 -0.23 0.833
Energy density (kcal/g)
1st third 1.20 -0.38;2.78 1 - 0.558
2nd third 2.25 0.83;3.66 1.05 0.350
3rd third 1.86 0.01;3.71 0.66 0.559
Fruits and vegetables (g)
1st third 1.71 -0.07;3.49 1 - 0.735
2nd third 1.53 0.00;3.06 -0.18 0.871
3rd third 2.09 0.52;3.66 0.38 0.736
Fiber (g)
1st third 0.87 -1.04;2.78 1 - 0.056
2nd third 1.46 0.08;2.85 0.59 0.588
3rd third 3.00 1.57;4.43 2.12 0.057
a Model 1: univariate model separately for fruits and vegetables, fi ber, saturated fat, added sugar, processed foods, soft drinks
possible errors, the pregnant women with energy intake considered biologically implausible were excluded
from the present study and the dietary intake variables were analyzed in ingestion intervals (thirds).26
As for internal validity, the similarities found between the studied women and the loss to follow-up suggest the inexistence of a selection bias of the followed cohort despite the high number of women excluded from the analysis. Cohort studies during gestation conducted in Brazil have reported diffi culties in follow-up during the entire gestation period.17,21 The reduced
sample size of the present study limits the capacity to detect associations. However, the assessment of the anthropometric measures and the acquirement of the other information through personally administered questionnaires contribute to the greater reliability of the data obtained in this sample. The power of the test, calculated a posteriori, was higher than 90% for the multiple linear regression models of saturated fat and of processed foods. For the other models, a larger sample would be necessary to detect associations, as the power of the test was not higher than 70%.4
Weight retention 15 days after delivery directly expresses the accumulation of fat during gestation.13
The utilization of this outcome is more adequate than weight gain during gestation in studies that aim to evaluate the determinants of the nutritional status at the end of gestation.14
The literature reports that there are many determinants of weight retention after delivery7 and that the
mainte-nance of overweight in puerperium contributes to the increase in the prevalence of overweight and obesity in women, mainly among those with low socioeconomic level.23 It is necessary to conduct other prospective
studies in different populations of pregnant and puer-peral women, with larger sample size, to elucidate the infl uence of the dietary pattern during gestation on post-partum weight retention. Understanding the changes in dietary quality during and after gestation, with methods that analyze the diet as a whole, may contribute to the formulation of effi cient interventions in the prevention of women’s obesity and other related diseases.
Table 4. Multiple linear regression models for the infl uence of dietary intake on weight retention 15 days after delivery. São Paulo, Southeastern Brazil, 2005. (n=82)
Variable Adjusted model
b
β p p trend
Saturated fat (g)
1st third 1 - 0.005
2nd third 2.63 0.022
3rd third 3.31 0.004
Added sugar (kcal)
1st third 1 - 0.147
2nd third 0.18 0.880
3rd third 1.67 0.153
Processed foods (kcal)
1st third 1 - 0.014
2nd third 0.06 0.957
3rd third 2.88 0.019
Soft drinks (kcal)
1st third 1 - 0.639
2nd third -1.06 0.352
3rd third 0.49 0.669
Energy density (kcal/g)
1st third 1 - 0.197
2nd third 2.01 0.102
3rd third 1.73 0.149
Fruits and vegetables (g)
1st third 1 - 0.959
2nd third -0.20 0.864
3rd third -0.06 0.957
Fiber (g)
1st third 1 0.326
2nd third -0.29 0.796
3rd third 1.21 0.315
b Model 2: Model 1 + maternal initial body mass index,
height, per capita income, smoking, age and level of schooling.
1. Astrup A, Grunwald GK, Melanson EL, Saris WH, Hill JO. The role of low-fat diets in body weight control: a meta-analysis of ad libitum dietary intervention studies. Int J Obes Relat Metab Disord. 2000;24(12):1545-52.
2. Bergmann MM, Flagg EW, Miracle-McMahill HL, Boeing H. Energy intake and net weight gain in pregnant women according to body mass index (BMI) status. Int J Obes Relat Metab Disord. 1997;21(11):1010-7.
3. Bes-Rastrollo M, van Dam R , Martinez-Gonzalez MA,
Li TY, Sampson L, Hu FB. Prospective study of dietary energy density and weight gain in women. Am J Clin Nutr. 2008;88(3):769-77.
4. Cohen J. Statistical power analysis for the bahavioral sciences. New York: Lawrence Erlbaum Associates; 1988.
5. Deierlein AL, Siega-Riz AM, Herring A. Dietary energy density but not glycemic load is a ssociated with gestational weight gain. Am J Clin Nutr. 2008;88(3):693-9.
Research fi nanced by Conselho Nacional de Desenvolvimento Científi co e Tecnológico (CNPq – Process no.: 505912/2004-0). The authors declare no confl icts of interests.
6. Field AE, Willett WC, Lissner L, Colditz G. Dietary fat and weight gain among women in the Nurses’ Health Study. Obesity (Silv er Spring). 2007;15(4):967-76. DOI:10.1038/oby.2007.616
7. Gunderson EP, Murtaugh MA, Lewis CE, Quesenberry CP, West DS, Sidney S. Excess gains in weight and waist circumference associ ated with childbearing: The Coronary Artery Risk Development in Young Adults Study (CARDIA). Int J Obes Relat Metab Disord. 2004;28(4):525-35. DOI:10.1038/sj.ijo.0802551 8. Institute of Medicine (US); National Research Council.
Weight gain during pregnancy: reexamining the g uidelines. Washington, DC: The National Academies Press; 2009.
9. Kim SA, Stein AD, Martorell R. Country development and the association between parity and overweight. Int J Obesity (Lo nd). 2007;31(5):805-12. DOI:10.1038/ sj.ijo.0803478
10. Lacerda EMA, Leal MC. Fatores asso ciados com a retenção e o ganho de peso pós-parto: uma revisão sistemática. Rev Bras Epidemiol. 2004;7(2):187-200. DOI:10.1590/S1415-790X2004000200008
11. Lacerda EMA, Kac G, Cunha CB, Leal MC. Consumo alimentar na gestação e no pós-parto segundo cor da pele no município do Rio de Janeiro. Rev Saude Publica. 2007;41(6):985-94. DOI:10.1590/S0034-89102007000600014
12. Lagiou P, Tami mi RM, Mucci LA, Adami H-O, Hsieh C-C, Trichopoulos D. Diet during pregnancy in relation to maternal weight gain and birth size. Eur J Clin Nutr. 2004;58(2):231-7. DOI:10 .1038/sj.ejcn.1601771 13. Lawrence M, Mckillop FM, Durnin JV. Women who gain
more fat during pregnancy may not have bigger babies: implications for recommended weight gain during pregnancy. Br J Obstet Gynaecol. 1991;9 8 (3):254-9. 14. Linné Y, Dy e L, Barkeling B, Rössner S. Weight
development over time in parous women: the SPAWN study: 15 years follow-up. Int J Obes Relat Metab Disord. 2003;27(12):1516-22. DOI:10.1038/ sj.ijo.0802441
15. Lohman TG, Roc he AF, Martorell R. Anthropometric standardization reference manual. Abridged ed. Human Kinetics Books; 1988.
16. Maddah M, Niko oyeh B. Weight retention from early p regnancy to three years postpartum: a study in Iranian women. Midwifery. 2009;25(6):731-7. DOI:10.1016/j. midw.2008.01.004
17. Nucci LB, Dunc an BB, Mengue SS, Branchtein L, Schmidt MI, Fleck ET. Assessment of weight gain
during pregnancy in general prenatal care services in Brazil. Cad Saude Publica. 2001;17(6):1367-74. DOI:10.1590/S0102-311X2001000600020
18. Öhlin A, Rössner S. Trends in eating patterns, physical activity and socio-demographic factors in relation to postpartum body weight development. Br J Nutr. 1994;71(4):457-70.
19. Oken E, Taveras EM, Popoola FA, Rich-Edwards JW, Gillman MW. Television, walking, and diet: associations with postpartum weight retention. Am J Prev Med. 2007;32(4):305-11. DOI:10.1016/j. amepre.2006.11.012
20. Persson V, Winkv ist A, Ninuk T, Hartini S, Greiner T, Hakimi M, et al. Variability in nutrient intakes among pregnant women in Indonesia: implications for the design of epidemiological studies using the 24-h recall method. J Nutr. 2001;131(2):325-30.
21. Rodrigues PL, La cerda EMA, Schlüssel MM, Spyrides MLC, Kac G. Determinants of weight gain in pregnant women attending a public prenatal care facility in Rio de Janeiro, Brazil: a prospective study, 2005-2007. Cad Saude Publica. 2008;24 Suppl 2:S272–84. DOI:10.1590/S0102-311X2008001400012
22. Schulze MB, Manso n JE, Ludwig DS, Colditz GA, Stampfer MJ, Willett WC, et al. Sugar-sweetened beverages, weight gain, and incidence of type 2 diabetes in young and middle-aged women. JAMA. 2004;292(8):927-34. DOI:10.1001/jama.292.8.927 23. Shrewsbury VA, Ro bb KA, Power C, Wardle J.
Socioeconomic differences in weight retention, weight-related attitudes and practices in postpartum women. Matern Child Health J. 2009;13(2):231-40. DOI:10.1007/s10995-008-0342-4
24. Uusitalo U, Arkko la T, Ovaskainen M-L, Kronberg-Kippilä C, Kenward MG, Veijola R, et al. Unhealthy dietary patterns are associated with weight gain during pregnancy among Finnish women. Public Health Nutr. 2009;12(12):2392-9. DOI:10.1017/ S136898000900528X
25. Walker LO, Sterling BS, Timmerman GM. Retention of pregnancy-related weight in the early postpartum period: implications for women’s health services. J Obstet Gynecol Neonatal Nurs. 2005;34(4):418-27. DOI: 10.1177/0884217505278294
26. Willett W. Nutritio nal epidemiology. 2. ed. New York: Oxford University Press; 1998. Chapter 13, Issues in analysis and presentation of dietary data; p. 321-46. 27. World Health Organization. Diet, nutrition and the