Use of dried brewers’ grains instead of soybean meal to feed lactating cows
Andressa Faccenda1*, Maximiliane Alavarse Zambom1, Deise Dalazen Castagnara2, André Sanches de Avila1, Tatiane Fernandes3, Everline Inês Eckstein1, Fernando Andre Anschau1,
Cibele Regina Schneider1
1 Universidade Estadual do Oeste do Paraná, Programa de Pós-graduação em Zootecnia, Marechal Cândido Rondon, PR, Brazil. 2 Universidade Federal do Pampa, Uruguaiana, RS, Brazil.
3 Universidade Federal de Lavras, Programa de Pós-graduação em Zootecnia, Lavras, MG, Brazil.
ABSTRACT - The objective of this study was to determine the optimal level of dried brewers’ grains (DBG) to replace soybean meal in diets for lactating Holstein cows. Five cows, around 88±28 days in milk, were distributed in a 5 × 5 Latin square design and fed diets containing different levels of DBG (0, 25, 50, 75, and 100%). The forage:concentrate ratio of the diet was 50:50. Feed intake, dry matter, nutrient digestibility, microbial synthesis, milk production and composition, and the economic viability of the diets were evaluated. There was reduction in dry matter intake and, consequently, in crude protein and non-fiber carbohydrates with increased levels of DBG. This occurred due to physical limitation of rumen caused by increased neutral detergent fiber intake. Ether extract intake also increased with levels of DBG due to higher concentrations of this nutrient in the diet. Apparent dry matter, organic matter, ether extract, and neutral detergent fiber digestibility increased with replacement of soybean meal by DBG. Milk production showed a quadratic effect and the levels of fat, protein, and total solids reduced linearly. Each 1% of soybean meal replaced by DBG in concentrate led to a reduction of 0.04, 0.02, and 0.06 g kg–1 of
milk fat, protein, and total solids, respectively. The milk production efficiency increased linearly and the microbial synthesis efficiency was not affected. The economic return increased along with the DBG levels. Thus, DBG levels replacing up to 75% of soybean meal can be used to feed lactating cows, since it provides improvements in digestibility, milk production efficiency, and economic return without affecting microbial efficiency.
Key Words: by-product, digestibility, intake, milk composition, protein, purine
Brazilian Journal of Animal Science
© 2017 Sociedade Brasileira de Zootecnia ISSN 1806-9290
www.sbz.org.br
R. Bras. Zootec., 46(1):39-46, 2017
Received: May 25, 2016
Accepted: October 19, 2016
*Corresponding author: [email protected] http://dx.doi.org/10.1590/S1806-92902017000100007
How to cite: Faccenda, A.; Zambom, M. A.; Castagnara, D. D.; Avila, A. S.; Fernandes, T.; Eckstein, E. I.; Anschau, F. A. and Schneider, C. R. 2017. Use of dried brewers’ grains instead of soybean meal to feed lactating cows. Revista Brasileira de Zootecnia 46(1):39-46.
Copyright © 2017 Sociedade Brasileira de Zootecnia. This is an Open Access article distributed under the terms of the Creative Commons Attribution License (http://creativecommons.org/licenses/by/4.0/), which permits unrestricted use, distribution, and reproduction in any medium, provided the original work is properly cited.
Introduction
In Brazil, the most commonly used ingredient as protein source in animal feed is soybean meal. However, the majority of soybeans are exported, mainly for the European market (Coronel et al., 2009), which has raised the grain and soybean meal cost in the domestic market. This scenario has motivated the search for alternative feed ingredients that can be stored, cost less, and have a comparable nutritional composition.
The use of agribusiness waste for ruminant feed provides a reduction in feed cost and allows for the reuse of organic material in animal production, thus preventing
waste accumulation and environmental pollution (Brochier and Carvalho, 2009). Among the various industrial wastes, brewers’ grains has increased due the excessive supply used for increased beer production in Brazil (Albuquerque et al., 2011). The amount of wet brewers’ grains is 32.02% higher than the amount of barley used for the initial process of brewing beer (Brochier and Carvalho, 2009).
High humidity of waste might limit its utilization on farms distant from the brewing industry, because the humidity prevents transportation and storage. Thus, the drying process is an interesting alternative, which also increases the lifespan of brewer’s grains and reduces the storage volume (Aliyu and Bala, 2011). However, data using dried brewers’ grains (DBG) in lactating cow diets are scarce. The use of brewer waste in the wet and fermented forms for lactating cows have showed positive results, because it does not affect the dry matter intake (Chiou et al., 1998) and milk production (West et al., 1994; Firkins et al., 2002; Geron et al, 2010; Imaizumi et al., 2015), but causes an increase in fat contents (Davis et al., 1983) and milk protein (West et al., 1994).
With a protein content ranging between 190 g kg–1 and
Filho et al., 2006), DBG is an alternative protein ingredient of lower cost, which can be used instead of soybean meal in ruminant feed, as ruminants have the capacity to convert plant waste into nutrients through the action of rumen microorganisms (Silva Filho et al., 1999). In this context, the objective of this study was to determine the optimal level of DBG for replacement of soybean meal in diets for lactating Holstein cows.
Material and Methods
The experimental protocol was approved by the Ethic Committee on Animal Use (case no. 35/13) and performed following the ethical principles of animal experimentation. Five pregnant Holstein cows between the first and third lactation were used, with 88 + 28 days in milk, an average body weight of 626±31.9 kg (mean ± standard deviation),
and an average initial milk yield of 27.0±4.86 kg d–1. The
animals were assigned to a 5 × 5 Latin square design of 21 days, with 14 days for adaptation and seven days for data collection, totaling 105 days. The treatments were 0, 25, 50, 75, and 100% of DBG levels replacing soybean meal in the diets.
Brewer’s grains were acquired in the wet form from a brewery located at Toledo, Paraná, Brazil. The wet waste was passed through a 31-h dehydration process. Sixteen hours involving direct sun exposure, in which the waste was distributed on a concrete surface forming a layer of approximately 1.5 cm with a density of 0.998 kg of DM
per m2. The material was spread and turned over every
hour. At the end of the dehydration process, the DBG was collected, packed in bags, and stored in a covered barn.
The ingredients used in the formulation of experimental
diets were Cynodon sp. hay, corn silage, ground corn, DBG,
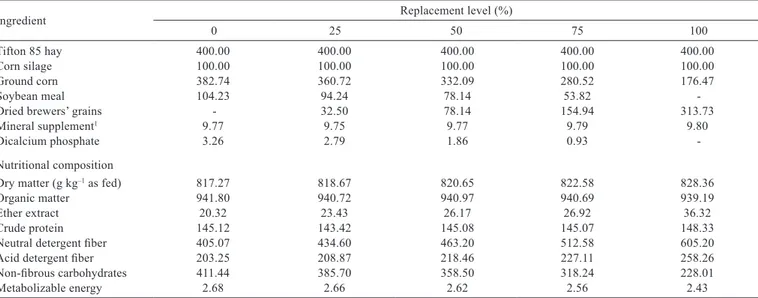
soybean meal, and a mineral and inorganic phosphate supplement. Diets were formulated to be isonitrogenous, according to the NRC (2001) for dairy cows with a body weight of 626 kg that are producing 27 kg of milk per day. The forage:concentrate ratio was 50:50 (Table 1).
Animals were housed in individual stalls in a barn. At the beginning and end of each experimental period, the cows were weighed before the morning feeding. The feed was offered twice daily at 06.30 h and 04.30 h, with
700 g kg–1 and 300 g kg–1 of feed provided at each time,
respectively. The refusals were weighed daily and adjusted
for 100 g kg–1 of DM offered. Dry matter and nutrient intake
were determined by the difference between the offered and refused feed.
From the 15th to 21st day of the study period, diet samples were collected, including silage, hay, concentrate, and refusals, and stored at –20 °C. To determine the digestibility, fecal samples were collected directly from the rectum according to the following schedule: 15th day (08.00 h), 16th day (10.00 h), 17th day (12.00 h), 18th day (14.00 h), 19th day (16.00 h) and 20th day (18.00 h). Subsequently, samples of diets, refusals and feces were dried in a forced-ventilation oven (55 °C for 72 h) and ground to pass through a 1-mm mill screen. The pool of samples was collected to compose a representative sample of diets, refusals, and feces per animal per period.
Ingredient Replacement level (%)
0 25 50 75 100
Tifton 85 hay 400.00 400.00 400.00 400.00 400.00
Corn silage 100.00 100.00 100.00 100.00 100.00
Ground corn 382.74 360.72 332.09 280.52 176.47
Soybean meal 104.23 94.24 78.14 53.82
-Dried brewers’ grains - 32.50 78.14 154.94 313.73
Mineral supplement1 9.77 9.75 9.77 9.79 9.80
Dicalcium phosphate 3.26 2.79 1.86 0.93
-Nutritional composition
Dry matter (g kg–1 as fed) 817.27 818.67 820.65 822.58 828.36
Organic matter 941.80 940.72 940.97 940.69 939.19
Ether extract 20.32 23.43 26.17 26.92 36.32
Crude protein 145.12 143.42 145.08 145.07 148.33
Neutral detergent fiber 405.07 434.60 463.20 512.58 605.20
Acid detergent fiber 203.25 208.87 218.46 227.11 258.26
Non-fibrous carbohydrates 411.44 385.70 358.50 318.24 228.01
Metabolizable energy 2.68 2.66 2.62 2.56 2.43
1 Chemical composition (quantities in kg–1): Ca, 215 g; P, 65 g; Co, 45 mg; Mg, 12 g; Mn, 425 mg; Zn, 1900 mg; Se, 35 mg; I, 65 mg; S, 10 g; F, 650 mg; Fe, 1700 mg; Cu, 800 mg;
Na, 75 g (commercial product).
Samples were analyzed for DM, mineral matter (MM), crude protein (CP), and ether extract (EE) by AOAC (1990) methodology and neutral detergent fiber (NDF) and acid detergent fiber (ADF) quantification according to Van Soest et al. (1991). The amount of organic matter (OM) was calculated as the difference between the MM content and total DM. Non-fiber carbohydrate levels (NFC) were calculated according to equations proposed by Sniffen et al. (1992). Dietary metabolizable energy was calculated according to the equation from the NRC (2001).
The DM and nutrient digestibilities were estimated by the difference between the amount consumed and amount excreted. To estimate the daily fecal excretion, insoluble
acid detergent fiber (iADF) was used as an internal marker.
The iADF was estimated in samples of offered feed,
refusals, and feces by an in situ digestibility procedure. The
iADF was obtained after 264 h of incubation (Casali et al.,
2008) in F57 filters (ANKOM® Technology Corporation)
and then analyzed for ADF.
Cows were milked twice daily at 06:00 and 04:00 h. Milk production was recorded during the collection period using gauges attached to the milking equipment. The fat
corrected milk (FCM) for 35 g kg–1 of fat was calculated
according to Sklan et al. (1992). Milk production efficiency (MPE) was calculated by dividing the milk yield average of each cow by its DM intake average in each experimental period.
Milk samples were collected on the 15th and 16thday
of each period and were composed proportionally from the morning and afternoon milking. For chemical analysis, milk
samples were placed in plastic vials containing Bronopol®
(2-bromo-2-nitropopano-1,3-diol), which were mailed to the laboratory to determine the contents of fat, protein, lactose, and total solids.
To measure milk allantoin and urea nitrogen, milk samples were deproteinized on filter paper using 5 mL of 25% trichloroacetic acid to 10 mL of milk. Subsequently, the filtrate was used to determine allantoin by the same method used in determination of urine allantoin according to Chen and Gomes (1992). Milk urea nitrogen was measured using a commercial kit.
For evaluation of microbial synthesis, urine was collected on the 17th day as spot sampling 4 h after the morning feeding. Uric acid and creatinine concentrations were determined by the colorimetric method. The average daily excretion of creatinine, considered to indicate the
urinary volume, was 24.05 mg kg–1 body weight (Chizzotti
et al., 2007). Total purine excretion was estimated by the sum of allantoin excreted in urine and milk plus uric acid
excreted in the urine. Absorbed microbial purines (mmol d–1)
were estimated by the equation proposed by Verbic et al.
(1990). The intestinal flow of microbial nitrogen (g d–1) was
estimated from the equation by Chen and Gomes (1992). To determine the economic viability of DBG, we considered the amount paid to the farmer for a liter of milk (US$ 0.43 per L) and prices related to the ration ingredients practiced in Paraná in November, 2014: corn silage, US$ 0.11 per kg of DM; Tifton hay, US$ 0.17 per kg of DM; ground corn, US$ 0.21 kg per of DM; soybean meal, US$ 0.50 per kg of DM; DBG, US$ 0.17 per kg of DM; mineral supplement, US$ 1.02 per kg of DM; and inorganic phosphate, US$ 0.84 per kg of DM. The value of US$ 1.00 in the economic analysis period was equivalent to R$ 2.557. The economic approach only considered the feed cost due to research purposes.
The ration cost per kilogram was calculated from the chemical composition of each ingredient in the diet and its cost. The feed cost was obtained by multiplying the ration cost by the animal’s average intake of each treatment diet. Similarly, the gross revenue obtained for each treatment was calculated with the milk liter value and the milk production. The gross margin was calculated as the difference between gross revenue and feed cost. The equilibrium point was calculated by the ration cost divided by the milk liter value. The equilibrium point shows the exact production volume when there is zero return, i.e., when the gross revenue is equal to the feed cost.
The data were analyzed as a 5 × 5 Latin square design using the MIXED procedure of SAS (Statistical Analysis System, version 9.2.). The mathematical model used was:
γijk = µ + τi + pj + ck + εijk,
in which γijk = observation, µ = population mean, τi =
diet effect (i = 1 to 5), pj = period effect (j = 1 to 5), ck =
cow effect (k = 1 to 5), and εijk = residual error. Various
covariance structures of errors were fitted. The first-order autoregressive structure (AR(1)) was selected based on the lowest Bayesian information criterion. The effects of DBG levels were evaluated by orthogonal polynomials testing linear and quadratic effects. Significance was declared at P≤0.05.
Results
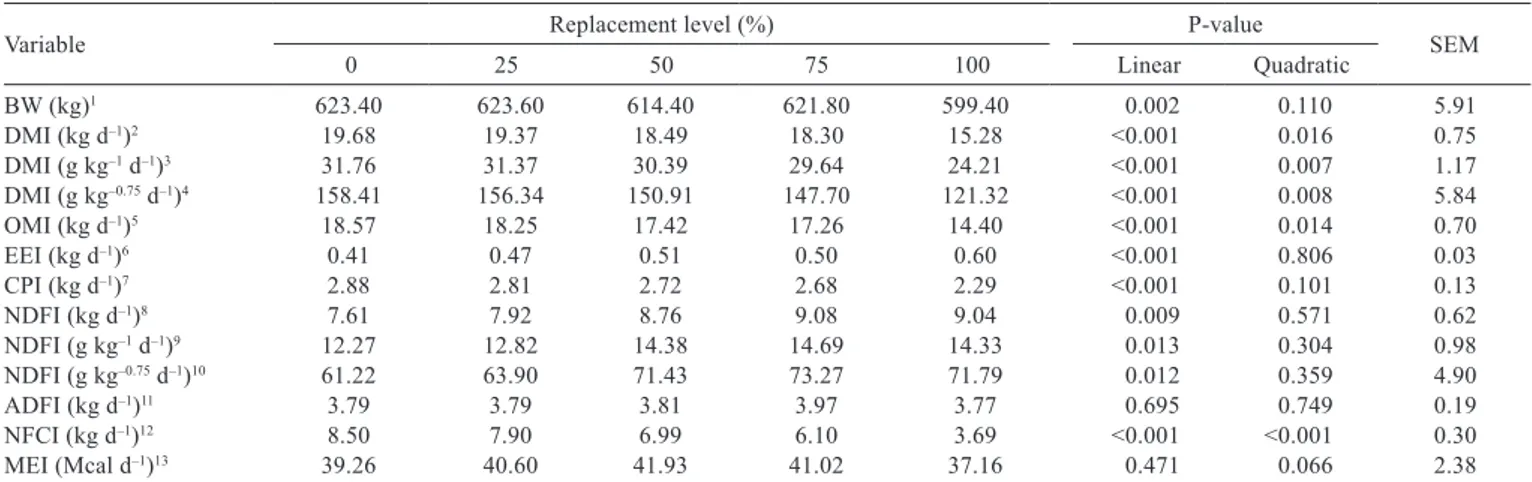
The use of DBG instead of soybean meal had a linear effect, decreasing the body weight, DM, OM, CP, and
NFC intake in kg d–1 (P<0.05) (Table 2). Dry matter intake
g kg–1 d–1 and g kg–0.75 d–1 had a quadratic effect (P<0.05).
The maximum intake was estimated using the replacement levels of 22.5% and 18.4% of DBG, respectively. Ether
and g kg–0.75 d–1 showed a positive linear effect with the increase of DBG in the diet (P<0.05). The ADF intake and metabolizable energy did not show any effect by the replacement levels (P>0.05).
Apparent DM and OM digestibilities were linearly increased (P<0.05) with DBG levels (Table 3). A positive linear effect was also obtained for EE and NDF digestibilities with an increasing level of DBG in the concentrate (P<0.05). The CP digestibility showed a quadratic effect with minimal digestibility estimated when there was 11.2% of DBG in
the concentrate replacing soybean meal (P<0.05). The ADF and NFC digestibility was not affected (P>0.05) by the treatments (Table 3).
Milk production and fat corrected milk showed quadratic effect (P<0.05) (Table 4). Milk production efficiency increased linearly (P<0.05). Milk fat, protein,
and total solids expressed in g kg−1 showed a decreasing
linear effect (P<0.05). Milk fat, lactose, and total solids
in kg d−1 showed a quadratic effect (P<0.05) with the
production peak estimated at 23.7%, 23.7%, and 31.5% of
Variable Replacement level (%) P-value SEM
0 25 50 75 100 Linear Quadratic
BW (kg)1 623.40 623.60 614.40 621.80 599.40 0.002 0.110 5.91
DMI (kg d–1)2 19.68 19.37 18.49 18.30 15.28 <0.001 0.016 0.75
DMI (g kg–1 d–1)3 31.76 31.37 30.39 29.64 24.21 <0.001 0.007 1.17
DMI (g kg–0.75 d–1)4 158.41 156.34 150.91 147.70 121.32 <0.001 0.008 5.84
OMI (kg d–1)5 18.57 18.25 17.42 17.26 14.40 <0.001 0.014 0.70
EEI (kg d–1)6 0.41 0.47 0.51 0.50 0.60 <0.001 0.806 0.03
CPI (kg d–1)7 2.88 2.81 2.72 2.68 2.29 <0.001 0.101 0.13
NDFI (kg d–1)8 7.61 7.92 8.76 9.08 9.04 0.009 0.571 0.62
NDFI (g kg–1 d–1)9 12.27 12.82 14.38 14.69 14.33 0.013 0.304 0.98
NDFI (g kg–0.75 d–1)10 61.22 63.90 71.43 73.27 71.79 0.012 0.359 4.90
ADFI (kg d–1)11 3.79 3.79 3.81 3.97 3.77 0.695 0.749 0.19
NFCI (kg d–1)12 8.50 7.90 6.99 6.10 3.69 <0.001 <0.001 0.30
MEI (Mcal d–1)13 39.26 40.60 41.93 41.02 37.16 0.471 0.066 2.38
Table 2 - Body weight, daily dry matter, and nutrient intake of Holstein cows fed diets containing different levels of dried brewers’ grains replacing soybean meal
BW - body weight; DMI - dry matter intake; OMI - organic matter intake; EEI - ether extract intake; CPI - crude protein intake; NDFI - neutral detergent fiber intake; ADFI - acid detergent fiber intake; NFCI - non-fibrous carbohydrate intake; MEI - metabolizable energy intake; SEM - standard error of the mean.
1 Ŷ = 626.4800 − 0.1992x. 2 Ŷ = 20.1971 − 0.0395x. 3 Ŷ = 31.4326 + 0.0453x − 0.0011x2. 4 Ŷ = 156.8702 + 0.1989x − 0.0054x2. 5 Ŷ = 19.0440 − 0.0373x.
6 Ŷ = 0.4169 + 0.0016x. 7 Ŷ = 2.9404 − 0.0053x. 8 Ŷ = 7.6760 + 0.0161x. 9 Ŷ = 12.5044 + 0.0239x. 10 Ŷ = 62.2232 + 0.1220x. 11 Ŷ = 3.826.
12 Ŷ = 8.9202 − 0.0456x. 13 Ŷ = 39.994.
Variable Replacement level (%) P-value SEM
0 25 50 75 100 Linear Quadratic
DMD1 630.75 643.85 636.26 652.80 667.79 0.049 0.563 17.02
OMD2 654.06 665.88 658.83 675.98 691.33 0.036 0.468 15.98
EED3 551.73 630.02 684.78 662.35 786.02 <0.001 0.824 22.50
CPD4 597.74 617.65 617.95 649.64 713.08 <0.001 0.026 17.51
NDFD5 538.98 573.38 596.23 622.96 663.41 <0.001 0.646 18.04
ADFD6 478.09 510.62 476.94 471.50 514.56 0.656 0.593 35.15
NFCD7 762.69 764.66 765.65 760.03 748.91 0.521 0.431 20.08
Table 3 - Apparent dry matter and nutrient digestibility (g kg–1 of dry matter) of Holstein cow diets containing different levels of dried
brewers’ grains replacing soybean meal
DMD - dry matter digestibility; OMD - organic matter digestibility; EED - ether extract digestibility; CPD - crude protein digestibility; NDFD - neutral detergent fiber digestibility; ADFD - acid detergent fiber digestibility; NFCD - non-fibrous carbohydrate digestibility; SEM - standard error of the mean.
1 Ŷ = 629.6845 + 0.3321x. 2 Ŷ = 652.2879 + 0.3386x. 3 Ŷ = 562.7931 + 2.0037x. 4 Ŷ = 603.5974 − 0.3029x + 0.0135x2. 5 Ŷ = 539.3026 + 1.1936x. 6 Ŷ = 490.342.
DBG, respectively. Milk urea nitrogen concentrations were not affected by DBG levels (P>0.05).
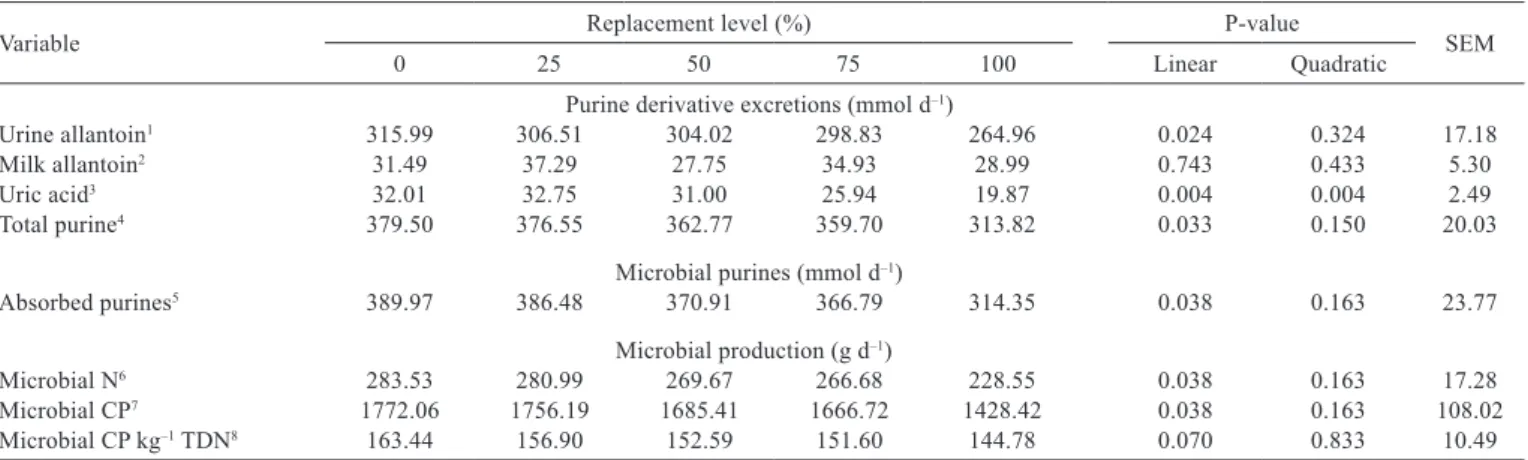
Allantoin and urine uric acid showed linear and quadratic effects (P<0.05) respectively, with the increase of DBG in the concentrate, while milk allantoin (P<0.05) showed no effect (Table 5). As a result of the decline in urine allantoin concentrations, total purines also showed
a linear decrease (P<0.05). Microbial purines absorbed
in mmol d–1, N-microbial production, and microbial CP
expressed in g d–1 showed a linear effect with different DBG
levels in the concentrate (P<0.05). However, efficiency of
microbial protein synthesis (g of CP-mic kg–1 d–1 of total
digestible nutrients) did not differ (P<0.05) between the different DBG levels (Table 5).
Variable Replacement level (%) P-value SEM
0 25 50 75 100 Linear Quadratic
Milk production (kg d–1)1 24.40 24.25 25.00 24.40 22.40 0.0206 0.047 0.96
3.5% Fat corrected milk (kg d–1)2 25.31 25.34 25.21 24.64 20.92 <0.001 0.004 0.83
Milk production efficiency3 1.26 1.29 1.36 1.34 1.47 0.007 0.746 0.05
Fat (g kg–1)4 36.97 36.04 35.46 36.01 31.52 0.002 0.072 1.08
Fat (kg d–1)5 0.91 0.90 0.88 0.87 0.70 <0.001 0.001 0.03
Protein (g kg–1)6 31.92 31.54 30.52 31.13 29.52 0.006 0.713 0.65
Protein (kg d–1)7 0.78 0.79 0.77 0.75 0.65 0.005 0.107 0.04
Lactose (g kg–1)8 44.80 45.23 45.41 45.43 45.34 0.364 0.341 0.32
Lactose (kg d–1)9 1.10 1.13 1.15 1.10 1.01 0.022 0.038 0.04
Total solids (g kg–1)10 123.58 122.71 121.25 122.34 116.14 <0.001 0.065 1.33
Total solids (kg d–1)11 3.03 3.07 3.05 2.96 2.58 0.002 0.016 0.12
Milk urea nitrogen (mg dL–1)12 13.31 13.30 13.66 14.67 14.31 0.205 0.844 1.14
Table 4 - Milk production, composition, and urea nitrogen of Holstein cows fed diets containing different levels of dried brewers’ grains replacing soybean meal
SEM - standard error of the mean.
1 Ŷ = 24.3314 + 0.0479x − 0.0007x2. 2 Ŷ = 25.0453 + 0.0528x − 0.0009x2. 3 Ŷ = 1.2484 + 0.0019x.
4 Ŷ = 37.3860 − 0.0437x. 5 Ŷ= 0.8926 + 0.0019x − 0.00004x2. 6 Ŷ = 31.9680 − 0.0208x. 7 Ŷ = 0.8096 − 0.0012x. 8 Ŷ = 45.242.
9 Ŷ = 1.0940 + 0.0019x − 0.00004x2. 10 Ŷ = 124.2540 − 0.0610x. 11 Ŷ = 3.0091 + 0.0063x − 0.0001x2. 12 Ŷ = 13.820.
Variable Replacement level (%) P-value SEM
0 25 50 75 100 Linear Quadratic
Purine derivative excretions (mmol d–1)
Urine allantoin1 315.99 306.51 304.02 298.83 264.96 0.024 0.324 17.18
Milk allantoin2 31.49 37.29 27.75 34.93 28.99 0.743 0.433 5.30
Uric acid3 32.01 32.75 31.00 25.94 19.87 0.004 0.004 2.49
Total purine4 379.50 376.55 362.77 359.70 313.82 0.033 0.150 20.03
Microbial purines (mmol d–1)
Absorbed purines5 389.97 386.48 370.91 366.79 314.35 0.038 0.163 23.77
Microbial production (g d–1)
Microbial N6 283.53 280.99 269.67 266.68 228.55 0.038 0.163 17.28
Microbial CP7 1772.06 1756.19 1685.41 1666.72 1428.42 0.038 0.163 108.02
Microbial CP kg–1 TDN8 163.44 156.90 152.59 151.60 144.78 0.070 0.833 10.49
Table 5 - Purine derivative excretions and microbial synthesis of lactating Holstein cows fed diets containing different levels of dried brewers’ grains replacing soybean meal
CP - crude protein; TDN - total digestible nutrients; SEM - standard error of the mean.
1 Ŷ = 320.0112 − 0.4389x. 2 Ŷ = 32.090.
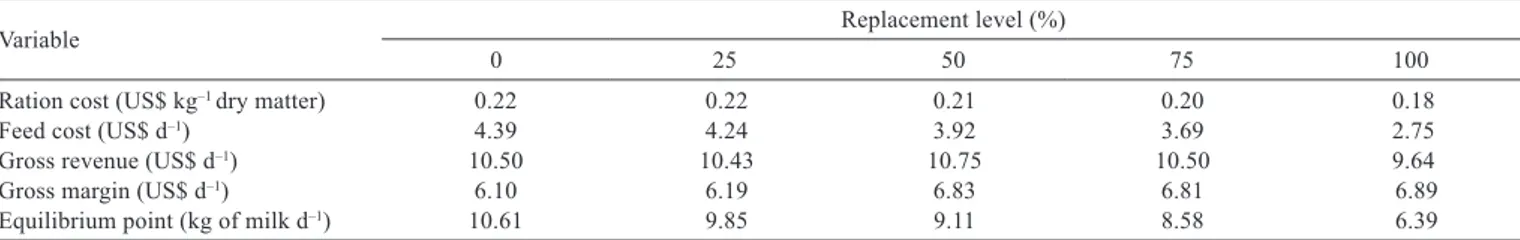
The economic viability (Table 6) shows the gross margin of greater value and the lowest equilibrium point that occurred to treatment of 100% DBG.
Discussion
Body weight decreased with the increase in the level of DBG because the diets with DBG had lower energy density. Animals fed diets with higher levels of DBG showed reduction in dry matter intake and mobilized body reserves to maintain their milk production. Animals fed diets containing 100% DBG consumed 4.4 kg DM per day less than the control treatment (Table 2). Using DBG above these levels may have limited the DM intake due to its
high NDF (663 g kg–1 DM), which led to intake regulation
by physical filling. Davis et al. (1983) also observed that DM intake was reduced when 30 or 40% of DM from wet brewers’ grain was used in the feed.
Ether extract and NDF intake increased along with DBG level in the diet (Table 1). Geron et al. (2010) also
showed an increase in EE intake (g kg–0.75 d–1) of around
8% when lactating cows were fed 15% brewer’s grain silage compared with cows fed a diet with 0% brewers’ grain silage. Mertens (1992) suggested that NDF intake of
an animal up to 12 g kg–1 d–1 of body weight is the main
mechanism of physical regulation of DM intake. Thus the NDF intake observed for the treatments with 50%, 75%,
and 100% DBG was 14.4, 14.7, and 14.3 g kg–1 d–1 of body
weight, respectively, confirming the fact that high levels of DBG in the concentrate limited feed intake.
Organic matter, CP, and NFC intake decreased as a result of a reduction in DM intake. In the case of NFC, this reduction also occurred due to the low NFC concentration in diets with greater amounts of DBG.
Apparent DM and OM digestibility increased with DBG levels (Table 3), which may be related to an increased feed retention time in the rumen due to higher NDF in diets with DBG. Doreau et al. (2003) reported that the main cause of digestibility variation in the diet is the retention time of particles in the rumen (i.e., a lower DM intake leads
to a reduction in passage rate and a consequent increase in its apparent digestibility). The increase in EE and NDF digestibility can be attributed to a slower passage rate and a greater concentration of these nutrients in the diets with higher DBG levels. The greater digestibility of NDF can also be associated with an improved ruminal condition, since the use of fibrous byproducts increases rumen motility and maintains a higher pH, which favors the fibrolytic microorganisms.
The CP digestibility was high because, although the brewers’ grains present low ruminal degradability, high intestinal digestibility (Santos et al., 1984) leads to a high total apparent digestibility. This was also reported by Geron et al. (2007), who found larger amounts of rumen undegradable protein but degradable in the small intestine
with fermented beer residue (394 g kg–1 CP) compared with
soybean meal (187 g kg–1 CP).
Milk production and fat corrected milk showed quadratic effect with maximum production estimated at 34.2% and 29.3% of DBG replacing soybean meal, respectively. This corroborates with the results of Imaizumi et al. (2015), who demonstrated higher fat corrected milk with 20% of wet brewers’ grains in the diet DM. This estimated maximum production may have occurred due to better nutrient synchronization and the presence of essential amino acids for milk synthesis such as lysine and methionine. According to the NRC (2001), DBG contains 10.4 g of lysine per 100 g of CP and 4.3 g of methionine per 100 g of CP, while soybean meal has 13.9 g of lysine per 100 g of CP and 3.2 g of methionine per 100 g of CP.
Milk production efficiency increased along with a reduction in DM intake with increased levels of DBG. However, it should be noted that this increase in milk production efficiency disregards the reduction in body weight observed in cows consuming larger amounts of DBG, which, in the long term, may adversely affect production and reproduction. Davis et al. (1983) also assessed feed efficiency and obtained an apparent increase in this ratio due to body weight loss along with increasing wet brewers’ grain levels in the diet.
Variable Replacement level (%)
0 25 50 75 100
Ration cost (US$ kg–1 dry matter) 0.22 0.22 0.21 0.20 0.18
Feed cost (US$ d–1) 4.39 4.24 3.92 3.69 2.75
Gross revenue (US$ d–1) 10.50 10.43 10.75 10.50 9.64
Gross margin (US$ d–1) 6.10 6.19 6.83 6.81 6.89
Equilibrium point (kg of milk d–1) 10.61 9.85 9.11 8.58 6.39
The reduction in milk fat may have occurred as a result of the reduction in DM intake and also because DBG is a rich source of polyunsaturated fatty acids (Geron et al., 2007), which can promote milk fat depression. For protein, each 1% of soybean meal replaced by DBG in the concentrate lead to
a reduction of 20.8 mg kg–1 and 1.2 g d–1 of milk protein. This
differed from West et al. (1994) and Cozzi and Polan (1994), who found an increase in the milk protein content of cows fed brewers’ grains in both wet and dry forms.
Concentrations of milk urea nitrogen were not affected, although DBG and soybean meal showed some differences regarding their protein use by animals. After ruminal incubation for 16 h, Geron et al. (2007) noted
values of rumen degradable protein of 436 g kg–1 of DM
for wet brewers’ grains and 797 g kg–1 of DM for soybean
meal, while the rumen undegradable protein was 564 g kg–1
CP for wet brewers’ grains and 204 g kg–1 CP for soybean
meal. As the diets in the present study were isoproteic, these factors were not enough to characterize differences in urea nitrogen concentrations. Additionally, the milk urea nitrogen values obtained are near the range between 10 and
14 mg dL–1, which was described by Powell et al. (2011) as
the ideal, since it demonstrates adequate synchronization between proteins and carbohydrates in the diet.
N-microbial production and microbial CP in g d–1
decreased with increasing DBG levels. Santos and Pedroso (2011) emphasized that the reduction in microbial production may be related to lower carbohydrate availability and lower dietary protein degradability for protein synthesis. This can explain the results of the current study because, according to Santos et al. (1984), brewers’ grains generate a smaller contribution of ammonia N due to lower ruminal degradable CP present in this feed. Additionally, diets with higher DBG levels also had lower corn proportions (Table 1), which reduced the availability of rapidly fermenting carbohydrates, limiting microbial growth and protein synthesis. However, microbial efficiency was not affected by treatments regardless of the difference in rumen degradable protein content of diets (628.5 g of
rumen degradable protein kg–1 of CP for diet containing 0%
DBG and 575.8 g of rumen degradable protein kg–1 of CP
for diet containing 100% DBG). This effect may be due to the lower DM intake and consequently higher retention time in the rumen of diets with higher DBG, which probably allowed a more efficient protein degradation of this diet (Table 5). Microbial efficiency for all levels of DBG was
greater than the 130 g kg–1 of total digestible nutrients
recommended by the NRC (2001).
The economic viability showed that the total replacement of soybean meal by DBG reduces the cost
in US$ by $0.04 per kg of dietary DM, due to the 64.6% lower cost of this waste comparted with the soybean meal (Table 6). The average daily cost of feed also decreased with increasing DBG levels due to the reduction in the cost per kg of dietary DM and to the decline in DM intake.
The gross margin of greater value and the lowest equilibrium point occurred with 100% DBG replacement, making this the most advantageous diet over the short term. However, treatment with 75% DBG showed a gross margin similar to treatment with 100% DBG, the latter causing a marked reduction in DM intake as well as reduced body weight of the animals.
Conclusions
Dried brewers’ grains can be used instead of soybean meal in dairy cow feed as it provides improvements in digestibility, milk production efficiency, and economic return to the producer without affecting microbial efficiency. However, due to the decrease in dry matter intake, body weight, milk production, milk fat, and milk protein, the use of DBG is not recommended to replace more than 75% of soybean meal.
Acknowledgments
The authors would like to thank the Coordenação de Aperfeiçoamento de Pessoal de Nível Superior (CAPES grant - PNPD 2891/2010) for their financial support.
References
Albuquerque, D. M. N.; Lopes, J. B.; Klein Junior, M. H.; Merval, R. R.; Silva, F. E. S. and Teixeira, M. P. F. 2011. Resíduo desidratado de cervejaria para suínos em terminação. Arquivo Brasileiro de Medicina Veterinária e Zootecnia 63:465-472.
Aliyu, S. and Bala, M. 2011. Brewer’s spent grain: A review of its potentials andapplications. African Journal of Biotechnology 10:324-331.
AOAC - Association of Official Analytical Chemists. 1990. Official methods of analysis. 16th ed. AOAC Internacional, Arlington. Brochier, M. A. and Carvalho, S. 2009. Aspectos ambientais, produtivos
e econômicos do aproveitamento de resíduo úmido de cervejaria na alimentação de cordeiros em sistema de confinamento. Ciência e Agrotecnologia 3:1392-1399.
Casali, A. O.; Detmann, E.; Valadares Filho, S. C.; Pereira, J. C.; Henriques, L. T.; Freitas, S. G. and Paulino, M. F. 2008. Influência do tempo de incubação e do tamanho de partículas sobre os teores de compostos indigestíveis em alimentos e fezes bovinas obtidos por procedimentos in situ. Revista Brasileira de Zootecnia 37:335-342.
Chiou, P. W. S.; Chen, C. R.; Chen, K. J. and Yu, B. 1998. Wet brewers’ grains or bean curd pomance as partial replacement of soybean meal for lactating cows. Animal Feed Science and Technology 74:123-134.
Chizzotti, M. L.; Valadares Filho, S. C.; Valadares, R. F. D.; Chizzotti, F. H. M.; Marcondes, M. I. and Fonseca, M. A. 2007. Consumo, digestibilidade e excreção de uréia e derivados de purinas em vacas de diferentes níveis de produção de leite. Revista Brasileira de Zootecnia 36:138-146.
Coronel, D. A.; Machado, J. A. D. and Carvalho, F. M. A. 2009. Análise da competitividade das exportações do complexo soja brasileiro de 1995 a 2006: Uma abordagem de market-share. Revista de Economia Contemporânea 13:281-307.
Cozzi, G. and Polan, C. E. 1994. Corn gluten meal or dried brewers grains as partial replacement for soybean meal in the diet of Holstein cows. Journal of Dairy Science 77:825-834.
Davis, C. L.; Grenawalt, D. A. and McCoy, G. C. 1983. Feeding values of pressed brewers’ grains for lactating dairy cows. Journal of Dairy Science 66:73-79.
Doreau, M.; Michalet-Doreau, B.; Grimaud, P.; Atti, N. and Nozière, P. 2003. Consequences of underfeeding on digestion and absorption in sheep. Small Ruminant Research 49:289-301.
Firkins, J. L.; Harvatine, D. I.; Sylvester, J. T. and Eastridge, M. L. 2002. Lactation performance by dairy cows fed wet brewers grain or whole cottonseed to replace forage. Journal of Dairy Science 85:2662-2668.
Geron, L. J. V.; Zeoula, L. M.; Branco, A. F.; Erke, J. A.; Prado, O. P. P. and Jacobi, G. 2007. Caracterização, fracionamento protéico, degradabilidade ruminal e digestibilidade in vitro da matéria seca e proteína bruta do resíduo de cervejaria úmido e fermentado. Acta Scientiarum. Animal Science 29:291-299.
Geron, L. J. V.; Zeoula, L. M.; Erkel, J. A.; Prado, I. N.; Bublitz, E. and Prado, O. P. P. 2010. Consumo, digestibilidade dos nutrientes, produção e composição do leite de vacas alimentadas com resíduo de cervejaria fermentado. Acta Scientiarum. Animal Science 32:69-76.
Imaizumi, H.; Batistel, F.; Souza, J and Santos, F. A. P. 2015. Replacing soybean meal for wet brewer’s grains or urea on the performance of lactating dairy cows. Tropical Animal Health Production 47:877-882.
Mertens, D. R. 1992. Analysis of fiber and its uses in feed evaluation and ration formulation. p.1-32. In: Anais do 29° Simpósio
Internacional de Ruminantes, Reunião Anual da Sociedade Brasileira de Zootecnia, Lavras.
NRC - National Research Council. 2001. Nutrient requirements of dairy cattle. 7th ed. National Academy Press, Washington, D.C. Powell, J. M.; Wattiaux, M. A. and Broderick, G. A. 2011. Short
communication: Evaluation of milk urea nitrogen as a management tool to reduce ammonia emissions from dairy farms. Journal of Dairy Science 94:4690-4694.
Russ, W.; Mörtel, H. and Meyer-Pittroff, R. 2005. Application of spent grains to increase porosity in bricks. Construction and Building Materials 19:117-126.
Santos, K. A.; Stern, M. D. and Satter, L. D. 1984. Protein degradation in the rumen and amino acid absorption in the small intestine of lactation dairy cattle fed various protein sources. Journal of Animal Science 51:244-255.
Santos, F. A. P. and Pedroso, A. M. 2011. Metabolismo de proteínas. p.265-297. In: Nutrição de ruminantes. 2nd ed. Berchielli, T. T.; Pires, A. V. and Oliveira, S. G., eds. Funep, Jaboticabal.
Silva Filho, J. C.; Armelin, M. J. A. and Silva, A. G. 1999. Determinação da composição mineral de subprodutos agroindustriais utilizados na alimentação animal pela técnica de ativação neutrônica. Pesquisa Agropecuária Brasileira 34:235-241.
Sklan, D.; Ashkenazi, R.; Braun, A.; Devorin, A. and Tabori, K. 1992. Fatty acids, calcium soaps of fatty acids, and cottonseeds fed to high yielding cows. Journal of Dairy Science 75:2463-2472. Sniffen, C. J.; O’Connor, J. D.; Van-Soest, P. J.; Fox, D. G. and
Russell, J. B. 1992. A net carbohydrate and protein system for evaluating cattle diets: II. Carbohydrate and protein availability. Journal of Animal Science 70:3562-3577.
Valadares Filho, S. C.; Magalhães, K. A.; Rocha Júnior, V. R. and Capelle, E. R. 2006. Tabelas brasileiras de composição de alimentos para bovinos: CQBAL 2.0. 2.ed. UFV, Viçosa, MG. Van Soest, P. J.; Robertson, J. B. and Lewis, B. A. 1991. Carbohydrate
methodology, metabolism, and nutritional implications in dairy cattle. Journal of Dairy Science 74:3583-3597.
Verbic, J.; Chen, X. B.; MacLeod, N. A. and Orskov, E. R. 1990. Excretion of purine derivatives by ruminants. Effect of microbial nucleic acid infusion on purine derivative excretion by steers. Journal of Agricultural Science 114:243-248.