UNIVERSIDADE FEDERAL DE SÃO CARLOS CENTRO DE CIÊNCIAS BIOLÓGICAS E DA SAÚDE
PROGRAMA DE PÓS-GRADUAÇÃO EM ECOLOGIA E RECURSOS NATURAIS DEPARTAMENTO DE BOTÂNICA
Physiological and biochemical responses of Scenedesmus quadricauda exposed to copper ions
Jaqueline Carmo da Silva
UNIVERSIDADE FEDERAL DE SÃO CARLOS CENTRO DE CIÊNCIAS BIOLÓGICAS E DA SAÚDE
PROGRAMA DE PÓS-GRADUAÇÃO EM ECOLOGIA E RECURSOS NATURAIS DEPARTAMENTO DE BOTÂNICA
Jaqueline Carmo da Silva
Physiological and biochemical responses of Scenedesmus quadricauda exposed to copper ions
Dissertação apresentada ao Programa de Pós-Graduação em Ecologia e Recursos Naturais (PPGERN) como parte dos requisitos para obtenção do título de Mestre em Ecologia e Recursos Naturais.
Orientadora: Profa Dra Ana Teresa Lombardi
Agradecimentos
À Professora Ana, por seus ensinamentos, paciência, dedicação, confiança, amizade, por todas as oportunidades que me ofereceu ao longo desses anos. Muito obrigada por tudo!
Ao Ricardo, pela dedicação, paciência, companheirismo e por me incentivar nas horas difíceis, por sempre me apoiar em todos os momentos, por nunca desistir de mim e por me mostrar o quão bela pode ser a vida.
Aos meus pais, que não mediram esforços para que eu pudesse chegar nesta etapa da minha vida.
Aos meus grandes e eternos amigos, Daiane Arruda e Douglas Baracho, por todos os momentos felizes, pelo companheirismo, por acreditarem em mim, por todo o apoio incondicional e por serem essas pessoas maravilhosas que eu amo muito.
Aos meus amigos, Farid e Vinicius, por todos os momentos vividos no laboratório, por nossas risadas e companheirismo.
Aos meus amigos, Isabela França, Roberta Mafra e Pablo Trevisoli, por ouvir meus desabafos, companheirismo, risos, apoio e por serem pessoas fantásticas. Obrigada pela amizade ao longo desses anos.
Aos amigos do laboratório que sempre me ajudaram direta e indiretamente para a conclusão do trabalho.
SUMARY
LIST OF FIGURES
LIST OF TABLES
ABBREVIATIONS, ACRONYMS AND SYMBOLS
ABSTRACT
RESUMO
1. INTRODUCTION ... 15
1.1. General Introduction ... 15
1.2. Effect of copper in the photosynthesis of phytoplankton ... 17
2. OBJECTIVES ... 20
2.1. Main Objectives ... 20
2.2. Specific Objectives ... 20
2.3. Hypothesis ... 20
3. MATERIALS AND METHODS ... 21
3.1. Culture conditions ... 21
3.2. Growth, biomass determination and cell size ... 21
3.3 Photosynthesis analysis ... 22
3.4 Biochemical analysis ... 24
3.4.1 Carbohydrates... 24
3.4.2 Proteins ... 24
3.4.3 Lipids ... 25
3.5 Cellular copper ... 26
3.6 Free Copper ... 26
3.7 Statistical analysis ... 26
4. RESULTS AND DISCUSSION ... 28
4.1. CHAPTER 1 - Higher biomolecules yield in phytoplankton under copper exposure ... 28
4.1.1. RESULTS... 28
4.1.2. DISCUSSION ... 33
4.2.1. RESULTS... 37
4.2.2. DISCUSSION ... 44
4.2.3. CONCLUSION ... 47
5. FINAL CONSIDERATIONS ... 48
6. REFERENCES ... 49
LIST OF FIGURES
Figure. 1. Cellular copper (g cell-1) in S. quadricauda at 96 h as a function of log Cu concentrations (mol L-1) added to culture medium. Sigmoid regression equation: Y =-2.14 x 10⁻¹³ + (8.13x10⁻¹¹) / 1 + exp ((-4.22– x)/ 0.47), r = 0.989. Error bars represent standard deviation of the mean (n = 3).
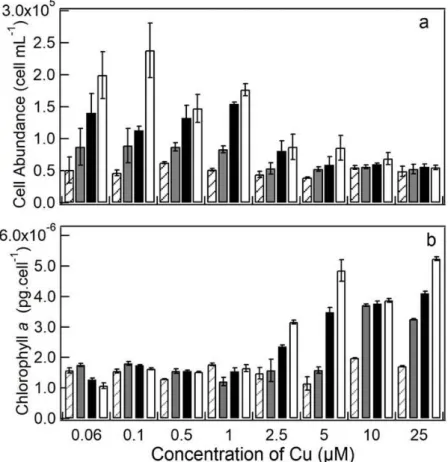
Figure 2. Measurements of S. quadricauda culture density for the experimental period reported as a function of Cu (µM) concentrations. (a) Cell abundance (cells mL−1); (b) Chlorophyll a concentration (pg cells-1). Dashed bars: 24 h; Gray bars: 48 h; Black bars: 72 h; White bars: 96 h. Error bars represent standard deviation of the mean (n = 3).
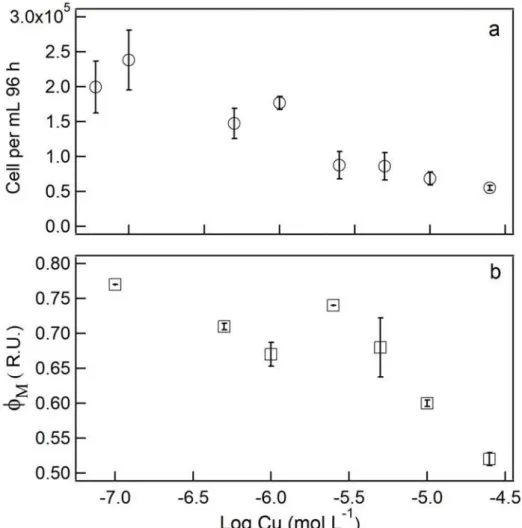
Figure 3. Biomass density (a, cell mL-1) and maximum photosynthetic quantum yield of PSII (b, ΦM) in relative fluorescence units (R.U.) at 96 h in cultures of S. quadricauda reported as a function of log of added Cu (mol L-1). Error bars represent standard deviation of the mean (n = 3).
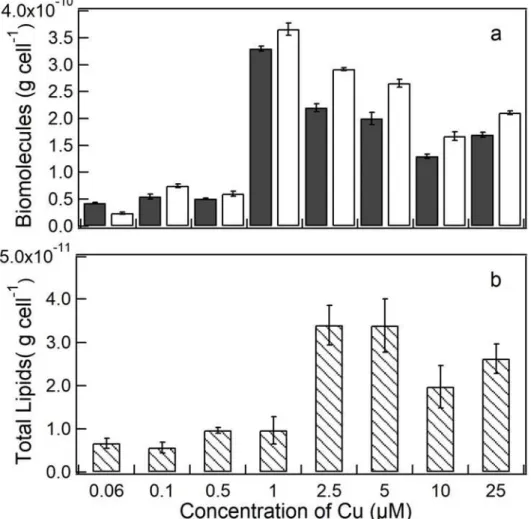
Figure 4. Total biomolecules (g cell-1) in S. quadricauda exposed to Cu at 96 h. (a) Total proteins (black bars), total carbohydrates (white bars). (b) Total lipids (g cell-1). Error bars represent standard deviation of the mean (n = 3).
Figure 5. Population density in cultures of S. quadricauda at 96 h Cu exposure as function of copper concentrations. (a) Cell abundance (cells mL-1); (b) Viable cells (cells mL-1). Error bars represent standard deviation of the mean (n = 3).
Figure 6. Chlorophyll a per unit cell volume (mg L-1 µm-3, a), cell volume (µm-3, b), and
chlorophyll a (pg cell-1, c) in culture of S. quadricauda. Data for both 6a and 6b were obtained
at 96 h Cu exposure and are reported as function Cu Concentration (µM). Error bars represent standard deviation of the mean (n = 3).
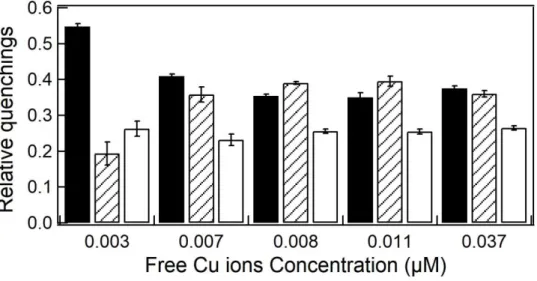
Figure 8. Relative distribution of the PSII dissipation energy processes. Black bars: relative photochemical quenching (qP(rel)); Dashed bars: relative unquenched fluorescence (UQF(rel)); White bars: relative non-photochemical quenching (qN(rel)). Error bars represent standard deviation of the mean (n = 3).
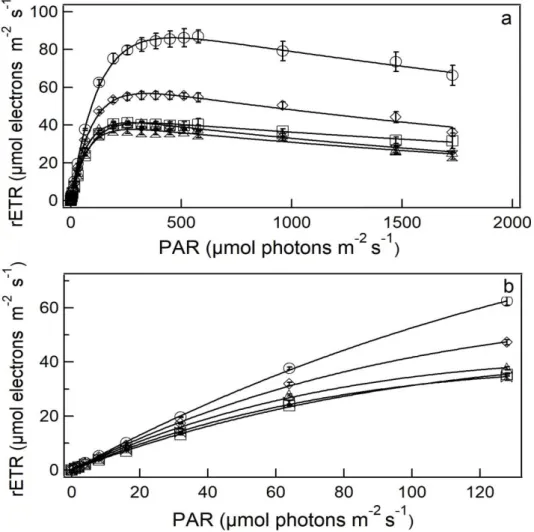
Figure 9. Light saturation curves (a) and initial phase of light saturation curves (b) expressed as relative electron transport rate (rETR) for S. quadricauda at 96 h copper exposure as function photosynthetically active radiation (PAR). Circle: 0.06; Diamond: 0.5; Triangle: 1.0; Hourglass: 2.5; Square: 5.0 µM Cu. Error bars represent standard deviation of the mean (n = 3).
LIST OF TABLE
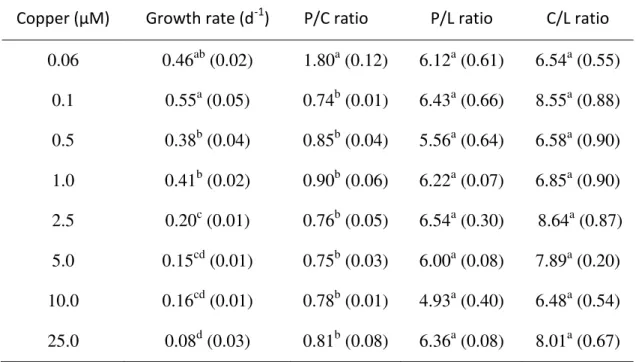
Table 1. Growth rates and biomolecules ratios in Scenedesmus quadricauda exposed to, the several copper concentrations (µM). Ratios P/C: proteins/carbohydrates; P/L: proteins/lipids; C/L: carbohydrates/lipids. Values represent the mean of n=3, and value within brackets the standard deviation from the mean.
LIST OF ABREVIATIONS, ACRONYMS AND SYMBOLS
α Photosynthetic efficiency µ Specific growth rate µg Microgram
µL Microliter µM Micromolar µm-3 Cubic micrometer % Percentage ~ Aproximately °C Celsius degree
O2.- Superoxide radical anions H2O2 Hydrogen peroxide ATP Adenosine triphosphate ca. Circa
Cd Cadmium CH2Cl2 Chloroform Chl a Chlorophyll a Co Cobalt
CO2 Carbon dioxide Cu Copper
CuCl2 Copper chloride
EC50 50% effect concentrations Fe Iron
g Gram (1/1000 Kg) h Hour
HCl Hydrochloric acid Hg Mercury
HNO3 Nitric acid L Liter Log Logarithm m Meters M Molar MeOH Methane min Minutes mL Milliliter mm Millimeter Mn Manganese N Normal
NADPH Nicotinamide adenine nucleotide phosphate NaOH Sodium hydroxide
Ni Nickel
nm Nanometer nM Nanomolar
NPQ Non-photochemical quenching PAR Photosynthetically active radiation Pb Lead
qP Photochemical quenching
qP(rel) Relative photochemical quenching R.U. Relative units
rETR Relative electron transport rate
rETRmax Maximum relative electron transport rate ROS Reactive oxygen species
s Second (1/3600 h)
UFQ (rel) Relative unquenched fluorescence Φ’
ABSTRACT
Copper is an important metal for industry, and its threshold in natural ecosystems has increased since the industrial revolution. As a micronutrient, it is required in minute amounts (~10-8 molL-1 Cu2+ ions), but can be toxic in concentrations above that, causing great biochemical transformations in microalgae. This study aimed at investigating the physiology of Scenedesmus quadricauda, a cosmopolitan species, exposed to copper concentrations including those that trigger intracellular biochemical modifications. It was divided in two parts, one to investigate the general physiology of the microalgae and the other to investigate the photosynthetic process. Copper concentrations ranged from 0.1 to 25 µM, thus including environmentally important levels. Microalgae cultures were kept under controlled environmental conditions and monitored daily for cell density, in vivo chlorophyll a, and photosynthetic quantum yield (ΦM). After 96 h Cu exposure, cellular Cu concentration, total carbohydrates, proteins and lipids were determined. The results showed that cellular copper and chlorophyll a per cell increased proportionally to Cu concentration in the culture medium and that microalgae cell density was mostly affected at 2.5 µM Cu and above. Approximately 31% decrease in quantum yield was obtained at the highest Cu concentration (25 µM) in comparison with the control, but at a concentration 10 times lower (2.5 µM Cu), the highest biomolecule yield was obtained for carbohydrates and proteins, but not for lipids. Results of the second part showed that the photosynthetic parameters, chlorophyll per cell volume, and viability decreased as a function of the copper added, whereas biovolume and chlorophyll a per cell increased. The present results suggest that at the range of Cu concentration tested, copper inhibited S. quadricauda cell division and significantly affected the photosynthetic process. This study is a contribution to the understanding of the effects of environmentally significant copper concentrations in the physiology of S. quadricauda.
RESUMO
O cobre é um metal importante para a indústria e seu limiar em ecossistemas naturais vem aumentando desde a revolução industrial. Como micronutriente esse elemento é necessário em pequenas quantidades (~10-8 mol L-1 Cu2+ íons livre), mas pode ser tóxico em concentrações acima disso, causando grandes transformações bioquímicas em microalgas. Este estudo teve como objetivo investigar a fisiologia de Scenedesmus quadricauda, uma espécie cosmopolita, exposta a concentrações de cobre, incluindo as que desencadeiam modificações bioquímicas intracelulares. Dividimos esta pesquisa em duas etapas, uma destinada a investigar a fisiologia geral da microalga e a outra o processo fotossintético. As concentrações de cobre testadas variaram de 0,1 a 25 μM, incluindo, portanto, níveis ambientalmente importantes. Os cultivos da microalga foram mantidos sob condições ambientais controladas. Na primeira etapa monitorou-se diariamente a densidade celular, clorofila a in vivo e rendimento quântico fotossintético (ΦM). Após 96 h de exposição ao Cu, foi determinada a concentração de Cu celular, carboidratos, proteínas e lipídios totais. Os resultados mostraram que o cobre celular e a clorofila a por célula aumentaram proporcionalmente à concentração de Cu no meio de cultura e que a densidade celular das microalgas foi principalmente afetada acima de 2,5 μM de Cu. Aproximadamente 31% do rendimento quântico diminuiu na maior concentração de Cu (25 μM) em comparação com o controle, mas em concentração 10 vezes menor (2,5 μM Cu), o maior rendimento de carboidratos e proteínas foi obtido. Os resultados da segunda etapa mostraram que os parâmetros fotossintéticos, clorofila a por unidade de volume celular e a viabilidade celular diminuíram em função do cobre adicionado, enquanto o biovolume e clorofila por celular aumentou. Os presentes resultados sugerem que, na gama de concentrações testadas, o cobre inibiu a divisão celular de S. quadricauda e afetou significativamente o processo fotossintético. Este estudo é uma contribuição para a compreensão dos efeitos do cobre na fisiologia e fotossíntese de S. quadricauda.
1. INTRODUCTION
1.1. General Introduction
Metal pollution can originate from both natural and anthropogenic sources. The increase of industrialized and urbanized regions has led to an increase of contaminants in the environment, and many of these pollutants have as final destination the aquatic ecosystems (ABO-FARHA et al., 2009). Metals are also common in industrial applications such as in the manufacture of pesticides, batteries, alloys, electroplated metal parts, textile dyes, and steel (SHARMA and AGRAWAL, 2004). Nowadays, metals are among the most important pollutants in treated water for human use and industrial wastewater is a major contributor for its increase in the environment (PINTO et al., 2003a; TORRES et al., 2008).
Natural sources of metals are geologic parent material or rock outcroppings that together with the environmental conditions that generates the weathering process, can also introduce metals into the environment. Considerable amounts of Mn, Co, Ni, Cu can be introduced naturally in aquatic ecosystems (SHARMA and AGRAWAL, 2004).
Metal ions cannot be degraded nor destroyed, so persist in the environment; they can be harmful to aquatic life (RAI, 2009). However, some of these metals are micronutrients necessary for essential metabolic processes (e.g. Zn, Cu, Mn, Ni, and Co), while others have unknown biological function and are toxic (e.g. Cd, Pb, and Hg) (GAUR and ADHOLEYA, 2004). Currently, industrial and domestic activities, agricultural practices, copper mine drainages and antifouling paints release metal compounds into aquatic ecosystems, which may have detrimental effects to the aquatic biota (PEÑUELAS and FILELLA 2002; SRINIVASAN and SWAIN 2007).
16
biodiversity losses, as well as bioaccumulation and biomagnification processes in food chains (PEÑA-CASTRO et al., 2004).
The toxicity of Cu to phytoplankton arises from its redox activity that at concentrations of 10-8 – 10-7 µM stimulates the formation of reactive oxygen species (ROS) by Fenton-Haber-Weiss reactions (TRIPATHI and GAUR, 2006). The damage copper cause to cell membranes and essential biomolecules, can lead to nutrient losses (HSU and GUO, 2002). Moreover, excess copper inhibits photosynthesis (KÜPPER et al., 2002; ECHEVESTE et al., 2017), disrupting electron transport in PSII (NIELSEN et al., 2003b), and reduce pigment concentration (PINTO et al., 2003), affecting growth and respiratory rates (NALEWAJKO and OLAVESON, 1995). To face this toxicity, microorganisms have developed several strategies, such as metal ion exclusion by reduction of cell membrane permeability (BROWN et al., 1988), and/or release of organic ligands that complex metals, as the synthesis of phytochelatins and metallothioneins, decreasing their bioavailability (GLEDHILL et al., 1997). In natural reservoirs in Brazil total copper concentration are usually within 1.4 x 10⁻¹⁰ - 2 x 10⁻⁷ µM (CONAMA 2005).
Photosynthetic organisms, such as microalgae, are the main via of metals entrance into aquatic food chains, accumulating and transferring them to higher trophic levels (MORENO SANCHEZ and DEVARS, 1999). Microalgae are sensitive indicators of environmental changes, being considered natural sentinels of the impacts of metals in the environment (MAYER-PINTO et al., 2010). Therefore, studies concerning the physiological and biochemical perturbations of basal-level trophic-chain organisms are an essential diagnostic tool to analyze the fate of metals and health of freshwater ecosystems (LA ROCCA et al., 2009).
1.2. Effect of copper in the photosynthesis of phytoplankton
Metal ions play important role in phytoplankton growth photosynthesis and biochemical responses. Photosynthetic process is driven by two photosystems, photosystem I (PSI) and II (PSII), and involves a series of reactions that start with light absorption, involves the synthesis of NADPH and ATP as intermediate energy-conserving compounds, and lead to CO2 fixation in the Calvin cycle (FALKOWSKI and RAVEN, 1997). When a photon of light enters a chloroplast, it excites chlorophyll a molecule to an elevated state. This excitation energy can be used in one of the three ways: (1) it can be transferred down through the electron transport chain to ultimately fix carbon (photochemical quenching), (2) it can be dissipated as heat (non-photochemical quenching) or (3) it can be re-emitted at a slightly longer wavelength in the form of fluorescence (55% of absorbed energy) (JUNEAU et al., 2002; RALPH et al., 2007; ECHEVESTE et al., 2017; CAMARGO and LOMBARDI 2017; CANDIDO and LOMBARDI, 2018). Thus, chlorophyll a fluorescence enables a wide range of photochemical processes linked with photosynthesis to be monitored, providing an insight into the organism’s overall ‘health’.
Copper is an essential microelement for photosynthesis, because, it is an important constituent of plastocyanin, which enables the transport of electrons between PS II and PS I (DROPPA and HORVATH, 1990). Photosystem II (PSII) is a large protein complex in the thylakoid membrane with about 25 protein subunits that catalyzes the light-driven reduction of plastoquinone, This is accomplished by electrons from water that is oxidized to molecular oxygen (DEBUS, 1992). Excess Cu inhibits this process, but the target for Cu inhibition within the PSII complex is not clear. Several investigations indicate that the site for copper ions have effectively blocked photosynthetic electron transport at the level of PSII both at oxidizing (donor) and reducing (acceptor) sites (CLIJSTERS and VAN ASSCHE, 1985; KRUPA and BASZYNSKI, 1995). As a consequence of PSII inhibition, the excited chlorophylls might also produce reactive hydroxyl radical (OH ) with aggressive singlet oxygen. The OH radicals induce liquid peroxidation, which results in the destruction of chlorophylls, carotenoids, and finally the entire membrane structure (AGGARWAL et al., 2012).
18
KETNER, 1997). The inhibition of the reducing side of PSI results in the enhanced O2 reduction producing superoxide radical anions (O2). The disproportion of O2 to H2O2 and its reaction with Cu produces the highly reactive hydroxyl radical (OH ), Cu inhibits PS I electron transport at the level of ferredoxin and, as a consequence, lipid peroxidation is induced. Metals exert their toxic action mostly by damaging chloroplast and disturbing photosynthesis. The inhibition of photosynthesis is the consequence of interference of metal ions with photosynthetic enzymes and chloroplast membranes (DROPPA and HORVÁTH, 1990).
Inhibition of photosynthesis compromises the supply of the main source of organic matter for growth and the metabolic demands of all other organisms in the ecosystem. Hence, the rate of photosynthesis places an upper bound on the overall biomass and productivity of ecosystems and constrains the overall biological flow of energy on the surface of this planet (FALKOWSKI and RAVEN, 2007)
The measurement of algae fluorescence has been used as a simple, rapid, and sensitive method of evaluating photoinhibitory and pollutant effects (KRAUSE AND WEIS 1984; SCHREIBER et al., 1994; EL JAY et al., 1997; MARWOOD et al., 2000, ECHEVESTE et al., 2017).
Chlorophyll a fluorescence parameter can be used as indicators of stress affecting photochemical pathway of utilization of absorbed light energy based on chlorophyll fluorescence techniques (LOMBARDI et al., 2011; CAMARGO and LOMBARDI, 2017; ECHEVESTE et al., 2017; CANDIDO and LOMBARDI, 2018).
Microalgae are important constituents of many ecosystems ranging from marine and freshwater environments to desert sands, and from hot springs to snow and ice. They account for more than half total primary production at the base of the food chain worldwide (REYNOLDS, 2006).
ARUMUGAM, 2015).
20
2. OBJECTIVES
2.1. Main Objectives
Our main objective was to investigate and evaluate on the effects of copper ions on the physiology and biochemistry of the freshwater phytoplankton species, Scenedesmus quadricauda.
2.2. Specific Objectives
a) Evaluate the main effects of sub-lethal and lethal concentrations of Cu ions to the microalgae Scenedesmus quadricauda;
b) Examine the physiological responses such as growth, chlorophyll a concentration, cell volume, and population density in cultures of S. quadricauda as a function of copper concentrations;
c) Determine the biochemical composition of S. quadricauda at the several Cu concentrations tested;
d) Determine copper concentrations in the cells, and free copper ions in the medium at the several Cu concentrations tested;
e) Examine the photosynthetic response of the microalga using PAM fluorometry;
2.3. Hypothesis
We hypothesized that, up to a certain threshold, S. quadricauda is able to alter its biochemical composition in order to keep maximum growth and photosynthetic rates as a strategy to deal with Cu toxicity.
3. MATERIALS AND METHODS
This research was divided in two parts. Testing a large range of copper concentrations that included environmentally important values, the first part intended to investigate the general microalgae physiology, analyzing parameters mostly related to growth. The second part was designed to investigate the photosynthetic process as well as the cell volume under specific copper concentrations that were defined considering the results of the first part. The experimental conditions for microalgae cultures were the same for both the first and second parts of the present research.
3.1. Culture conditions
Scenedesmus quadricauda was obtained from the Canadian Center for the Culture of Microorganisms at the University of British Columbia (Vancouver, Canada) and it is kept in the Algae Biotechnology Laboratory (Botany Department, Universidade Federal São Carlos, SP, Brazil). The microalga was grown in 1000 mL polycarbonate bottles (Nalgene, U.S.A) containing 300 mL sterile and two times concentrated LC Oligo culture medium (AFNOR, 1980). Sterilization was performed through autoclaving (121 °C, 20 min). Final pH was adjusted to 7.0 before autoclaving and cultures were kept under controlled conditions of light intensity (130 µmol m-2 s-1), temperature (25 ± 2°C) and light/dark cycle (12:12 h). Exponentially growing cells were inoculated (4 x 10⁴ cells mL-1) in the culture medium and experiments lasted 96 h. Copper was added as CuCl2 (Merck, titrimetric AAS standard) at seven final concentrations: 0.1, 0.5, 1.0, 2.5, 5.0, 10.0 and 25.0 µM for the first experiment and at 4 concentrations (0.5, 1.0, 2.5 and 5.0 µM) for the second experiments. The controls contained the copper concentration present in the modified LC Oligo medium (0.06 µM). Three experimental replicates were performed.
3.2. Growth, biomass determination and cell size
22
E200, Japan). Cell viability was determined through flow cytometry using a Muse® Cell Analyzer (MilliporeSigma). Chlorophyll a was determined by in vivo fluorescence (Turner Designs, Trilogy, USA). For this, a calibration curve was constructed by plotting chlorophyll a concentration extracted from exponentially growing Chlorella vulgaris cells (SHOAF and LIUM, 1976) against in vivo chlorophyll a fluorescence. The linear section of this curve was fitted by means of linear regression and used to calculate chlorophyll a concentration.
Growth rates were determined by linear regression of the natural logarithm of cell density versus time (days) for the exponential growth phase, with the slope corresponding to the specific growth rate. All mathematical calculations and data plotting were performed using the software Igor Pro (Wavemetrics, USA).
Cell shape and size were accurately measured at the end of the experiments and cell volume calculated by approximation to the nearest simple geometric shape (HILLEBRAND et al., 1999), from the dimensions of ca. 100 cells measured at x 400 under transmitted light microscope (Nikon, Japan).
3.3 Photosynthesis analysis
Maximum quantum yield (ΦM) was determined using a PhytoPAM fluorometer (Heinz-Walz, Germany). A 3 mL aliquot was sampled from the cultures in the exponential phase and were dark adapted (15 min) to allow complete oxidation of photosystem II (PSII) reaction centers. The maximum quantum yield of PSII represents the difference between the maximum and minimum fluorescence divided by the maximum fluorescence (FV/FM) (Schreiber, 2004), being FM the maximum fluorescence yield and FV the difference between FM and the minimum fluorescence (F0).
Oxborough and Baker (1997) were used to obtain F0’. The photochemical (qP) and non -photochemical (qN and NPQ) quenching coefficients were also calculated:
𝑞𝑃 =
𝐹′𝑀− 𝐹𝑠𝐹′𝑀−𝐹′0 (1)
𝑞𝑁 =
1−( 𝐹′𝑀−𝐹′0)𝐹𝑀−𝐹0 (2)
𝑁𝑃𝑄 =
𝐹𝑀−𝐹′𝑀𝐹′𝑀 (3)
qP represents the proportion of light energy trapped by open PSII reaction centers and used for electron transport, while qN and NPQ represent the light energy dissipation of all the non-radiative processes of excitation (fluorescence reflection) and heat dissipation, respectively.
The light saturation curve was obtained by gradually increasing the intensity of photosynthetically active radiation (PAR; 0–2000 μmol photons m−2 s−1). Light pulses were applied every 20 s, resulting in a series of successive Φ′M values. The relative electron transport rate (rETR; μmol electrons m−2 s−1) was determined using the equation, as recommended by Ralph et al. (2002):
𝑟𝐸𝑇𝑅 = 𝛷′𝑀 𝑥 𝑃𝐴𝑅 (4)
Light saturation curve was fitted according to Platt et al., (1980):
𝑟
𝐸𝑇𝑅 = 𝐸𝑇𝑅𝑠
[1 − 𝑒
( −𝛼.𝐼𝐸𝑇𝑅𝑠 )] [𝑒
( −𝛽.𝐼𝐸𝑇𝑅𝑠)] (5)
𝑟𝐸𝑇𝑅
𝑚𝑎𝑥= 𝐸𝑇𝑅
𝑠[𝛼 (𝛼 + 𝛽)]
⁄
[𝛽 (𝛼 + 𝛽)]
⁄
(6)24
rETRmax: maximum relative electron transport rate (μmol electrons m−2 s−1) could be obtained.
β: fotoinhibition
Beyond α and rETRmax, is possible to calculate the saturating irradiance (Ek):
𝐸𝑘 =
𝑟𝐸𝑇𝑅𝑚𝑎𝑥𝛼(7)
3.4 Biochemical analysis
At the end of the experiments (96 h), total intracellular lipids, carbohydrates and proteins yields were calculated as the product of the respective biomolecule content per cell basis and the growth rate. Biomolecules were determined as described below.
3.4.1 Carbohydrates
Total carbohydrates in algal biomass were determined according to Liu et al. (1973). It is based in the phenol-sulfuric acid method with glucose as standard for the calibration curve. Culture samples (10 mL) were centrifuged at 3920 g for 10 min at 10 °C in a refrigerated centrifuge (Thermo Scientific, Legend XTR, USA), the supernatant was discarded and the pellet used for the carbohydrate determination with the absorbance determined at 490 nm using a spectrophotometer (Femto 800 XI, Brazil).
3.4.2 Proteins
determined against a calibration curve made with bovine albumin standard (Sigma Aldrich, St Louis, Missouri, USA).
3.4.3 Lipids
Lipid extraction was performed using a modified Folch method that uses dichloromethane:methanol (2:1) as proposed in Parrish (1999). Previously baked (400 °C, 8 h) GF/C filters (0.47 mm diameter) were used for 100 mL cultures samples filtering. The filters containing the biomass were placed in glass flasks containing 2 mL dichloromethane and stored in a freezer until analysis. For lipids extraction, screw capped 50 mL Teflon® centrifuge tubes (Nalgene®) were used; immediately prior to use, they were rinsed with chloroform and methanol. The filters and the 2 mL previously stored dichloromethane were transferred to the Teflon® tubes containing 4 mL dichloromethane (CH2Cl2):methanol (MeOH) (2:1) and spiked with 10 µg of internal standard (hexadecane-3-one, a ketone) to measure recovery efficiency. The filter was then sonicated using a stainless steel sonicator (Unique Group, Indaiatuba, Brazil) for 5 min under ice bath. Following this, the sample was centrifuged at 1850 g for 5 min (Eppendorf centrifuge, Germany), the supernatant was removed and another extraction performed. The two extracts were mixed and concentrated in a rotary evaporator (RV05 S25, IKA, Germany) at environment temperature (21 oC).
26
3.5 Cellular copper
Cellular copper was determined after acid digestion according to the methodology described in Lombardi et al. (2002). A culture sample (45 mL) was filtered through previously acid washed (10% HCl, 24 h) cellulose acetato membrane filters (0.47 mm diameter - Sartorius, Germany) that were further digested in 3M HNO3/1M HCl (acqua regia solution) for 24 h at 25oC temperature. This acid solution was then filtered through previously acid washed membrane filter, the filter was discarded and the solution followed to copper determination by atomic absorption spectrophotometer equipped with graphite furnace (LSFAAS- Perkin Elmer®). Only ultrapure acids (Fluka) were used throughout.
3.6 Free Copper
Free copper ions were determined using a cupric ion-selective electrode (Orion, model 94-29) in conjunction with an ANALION double junction reference electrode. Potential readings were obtained using an Orion model 710A pH meter with 0.01 mV resolution. Constant temperature (25 °C) was maintained throughout. The ionic strength was adjusted to 0.01 M by using high purity NaNO3 (MicroSelect, FLUKA, Switzerland).
3.7 Statistical analysis
The Cu concentration at which growth and photosynthetic efficiency were altered by 50% with respect to controls, were defined as the 50% Effect Concentrations (EC50) and calculated by linear regression applying equation 8 (ECHEVESTE et al., 2017).
EC50 = − ln 0.5 / Ω (8)
28
4. RESULTS AND DISCUSSION
4.1. CHAPTER 1 - Higher biomolecules yield in phytoplanktonunder copper exposure
This chapter refers to the results of the first part of the research, for which Scenedesmus quadricauda was cultivated in 8 different Cu concentration ranging from 0.06 – 25 µM. nominal values. We evaluated the microalgae growth physiology, what included chlorophyll a, maximum photosynthetic efficiency, biochemical composition, cellular copper and biomolecule yield. In this chapter 1, all copper values are reported as nominal values.
4.1.1. RESULTS
The present results showed that in general, copper affected the biochemical composition and growth physiology of S. quadricauda.
As reported in figure 1, cellular copper, which is a representation of both the adsorbed and/or absorbed metal, increased with the increase of Cu concentrations in culture medium at 2.5 µM Cu and above.
Figure. 1. Cellular copper (g cell-1) in S. quadricauda at 96 h as a function of log
Cu concentrations (mol L-1) added to culture medium. Sigmoid regression
equation: Y =-2.14 x 10⁻¹³ + (8.13x10⁻¹¹) / 1 + exp ((-4.22– x)/ 0.47), r = 0.989. Error
bars represent standard deviation of the mean (n = 3).
25x10-12 20 15 10 5 0
C
ellular
C
u
(g
c
ell
-1)
-7.5 -7.0 -6.5 -6.0 -5.5 -5.0 -4.5
Growth rates are reported in Table 1 for the several copper concentrations tested. We observed that growth rate for the lowest Cu concentration tested (0.1 µM) was statistically similar with respect to the control (p>0.05) (Table 1). However, at higher Cu levels, progressively lower growth rates were obtained, reaching the lowest growth rate at the highest copper concentration tested (25 µM) that was 82% lower than the control (Table 1).
Table 1. Growth rates and biomolecules ratios in Scenedesmus quadricauda exposed to, the several copper concentrations (µM). Ratios P/C: proteins/carbohydrates; P/L: proteins/lipids; C/L: carbohydrates/lipids. Values represent the mean of n=3, and value
within brackets the standard deviation from the mean.
Copper (µM) Growth rate (d-1) P/C ratio P/L ratio C/L ratio
0.06 0.46ab (0.02) 1.80a (0.12) 6.12a (0.61) 6.54a (0.55) 0.1 0.55a (0.05) 0.74b (0.01) 6.43a (0.66) 8.55a (0.88) 0.5 0.38b (0.04) 0.85b (0.04) 5.56a (0.64) 6.58a (0.90) 1.0 0.41b (0.02) 0.90b (0.06) 6.22a (0.07) 6.85a (0.90) 2.5 0.20c (0.01) 0.76b (0.05) 6.54a (0.30) 8.64a (0.87) 5.0 0.15cd (0.01) 0.75b (0.03) 6.00a (0.08) 7.89a (0.20) 10.0 0.16cd (0.01) 0.78b (0.01) 4.93a (0.40) 6.48a (0.54) 25.0 0.08d (0.03) 0.81b (0.08) 6.36a (0.08) 8.01a (0.67)
30
approximately 69% and 74% decrease in population density at 96 h (Fig. 2A), respectively, while at lower Cu concentrations (0.1, 0.5, and 1.0 µM) reductions ranged from 31 to 34% (Fig. 2A). These observations allowed the identification of the EC50 at 3.6 µM Cu.
Chlorophyll a concentration per cell increased at 2.5 µM Cu concentrations and above (Fig. 2B), being significantly higher at 5.0 µM (p<0.05; Fig. 2B). As with cell abundance, no significant differences were observed within the first 24 h of experiment, with alterations occurring after 48 h (Fig. 2B). The apparent decrease in chlorophyll a of the control as they aged was not statistically significant (p>0.05). At 10.0 and 25.0 µM Cu, statistically significant chlorophyll a increase was achieved at 48 h, confirming that the highest the Cu concentration, the earlier its effect in S. quadricauda (Fig. 2B).
Figure 2. Measurements of S. quadricauda culture density for the experimental
period reported as a function of Cu (µM) concentrations. (a) Cell abundance (cells mL−1); (b) Chlorophyll a concentration (pg cells-1). Dashed bars: 24 h; Gray bars:
Cell abundance and maximum quantum yield (ΦM) at 96 h are reported as a function of log Cu concentration (mol L-1) in the medium in Fig. 3. We observe that the cell number per mL culture began decreasing before the effect on ΦM could be detected, revealing that the photosynthetic parameter was less sensitive to Cu than cell abundance in the cultures (EC50 3.6 µM). It was only at 10.0 (ΦM 0.59) and 25.0 µM Cu (ΦM 0.53) that ΦM was significantly lower (p<0.05) than the controls (0.76). As these reductions represented 21% and 32% of the controls, the EC50 for ΦM was higher than 25 µM.
Figure 3. Biomass density (a, cell mL-1) and maximum photosynthetic quantum
yield of PSII (b, ΦM) in relative fluorescence units (R.U.) at 96 h in cultures of S. quadricauda reported as a function of log of added Cu (mol L-1).
32
composition remained similar to the controls (ANOVA p>0.05), with 4-5 pg cell-1 of proteins, 2-6 pg cell-1 of carbohydrates, and 0.7-1.0 pg cell-1 lipids. At 1.0 µM, a significant increase (p<0.05) of around sevenfold proteins and 15 times higher carbohydrates as compared to controls were observed. At this concentration total lipid content remained similar (p>0.05). However, at 2.5µM the total lipids was 5 times higher (p<0.05) in comparison with the controls, while carbohydrates and proteins decreased, similar to that observed at 5.0 µM Cu (Fig. 4b). At 10 µM Cu, all biomolecules decreased (p>0.05).
Figure 4. Total biomolecules (g cell-1) in S. quadricauda exposed to Cu at 96 h.(a)
Total proteins (black bars), total carbohydrates (white bars). (b)Total lipids (g cell-1).
(p<0.05) at the lowest Cu concentration added (0.1 µM), reaching values lower than one. This means higher carbohydrates in comparison to proteins were present in the cells, pointing to cellular stress even in environmentally important Cu concentrations (Table 1). Subsequent Cu additions did not alter this P/C ratio (p>0.05), which was kept low in relation to the control (Table 1). The protein/lipid (P/L) ratio remained around ~ 6.00, throughout the treatments with no significant differences (Table 1). Cu treatments had no effects in C/L and P/L (p>0.05) (Table 1).
4.1.2. DISCUSSION
Scenedesmus quadricauda has been one of the most studied species throughout the history of research on the interactions of metals with phytoplankton, including those on Cu effects (GIBSON, 1972; PETERSEN, 1982; STARODUB and WONG, 1987; GUANZON et al., 1994; BILGRAMI and KUMAR, 1997; FARGAŠOVÁ et al., 1999; KÜPPER et al., 2002; AWASTHI and RAI, 2005; MOHAMMED and MARKERT, 2006; KOVÁČIK et al., 2010; PIOVÁR et al., 2011). Many parameters define the inhibitory properties of metals to microalgae, i.e., the amount of metal ions inside the cells or bound to its surface (FRANKLIN et al., 2002; MA et al., 2003): the composition of the culture medium, mainly the presence of organic chelators that alter metal bioavailability (LOMBARDI et al., 2007; MA et al., 2003), the exposure time, requiring larger time frames at lower metal concentrations to achieve similar results at rather higher concentrations (ANGEL et al., 2017), or even the strain origin, as it may
determine a high sensitivity or acquired tolerance to metals (BOSSUYT and JANSSEN, 2004; D’ORS et al., 2010).
34
ions. This resulted in the good correlation we obtained between added nominal Cu concentrations and cellular Cu, confirming previous observations (LOMBARDI et al., 2002; KADUKOVÁ and VIRČÍKOVÁ, 2005; FLOUTY and ESTEPHANE, 2012).
The decrease of S. quadricauda cell abundance at Cu concentrations higher than 1.0 µM, mean that cell division was affected, in agreement with previous results that identified growth as the most sensitive parameter (MOHAMMED and MARKERT, 2006; PERALES-VELA et al., 2007; PIOVÁR et al., 2011). In parallel, chlorophyll a content per cell increased as a response to Cu increase in the medium. Previous works found this pattern at Cu concentrations of 13 x10-8 mol L-1and above, attributing it to cell size increase (PEÑA-CASTRO et al., 2004; ROCHA et al., 2016; ECHEVESTE et al., 2017b). These authors proposed that, in order to adjust the algal machinery to survive, phytoplankton is able to alter its morphology, reducing their surface to volume ratio, so reducing Cu uptake, at the same time that chlorophyll a concentration is increased in the cells (CID et al., 1996; FRANKLIN et al., 2002; ROCHA et al., 2016; ECHEVESTE et al., 2017b). Although we cannot discard cell size increase, our observations showed that it was only at 1x10⁻⁶ mol L-1 Cu that morphological differences were observed while counting the cells under microscope (results not shown).
Furthermore, it is important to consider that the increase in chlorophyll a content can be a response of the cell machinery to solve problems in the photosynthetic light reactions (GUANZON et al., 1994; KÜPPER et al. 1996; LOMBARDI et al., 2002). It is known that Cu can inhibit the photosynthetic activity by disrupting the electron transport chain, and replace Mg at the center of chl a molecules damaging the photosystems and antenna complex (KÜPPER et al., 1996) . The reduced maximum photosynthetic quantum yield observed in our study suggests that the increase in chl a content per cell may have been a response of S. quadricauda to the harmful effects of Cu on the photosynthetic apparatus. Indeed, investing on chl a synthesis the photosynthetic problem was partially overcome, since in the present research photosynthetic activity was less impaired than cell division, as also observed in previous studies (GUANZON et al., 1994; PERALES-VELA et al., 2007; ECHEVESTE et al., 2017b).
phytoplankton may increase its carbohydrate synthesis as a defense mechanism against metal toxicity, since carbohydrates can bind Cu, so decreasing its bioavailability ( PISTOCCHI et al., 1997; AFKAR et al., 2010; ). Also, phytoplankton is able to face metal contamination by stimulating the synthesis of metal binding proteins, such as metallothioneins (COBBETT and GOLDSBROUGH, 2002), or carbonylation of proteins associated to the production of antioxidant defense systems (EINICKER-LAMAS et al., 2002; PÉREZ et al., 2006; TRIPATHI; GAUR, 2006; CHIA et al., 2015). We may rationale that the almost tenfold higher carbohydrates content in S. quadricauda exposed to the highest Cu concentration can be related to a mechanism that reduce Cu bioavailability through its complexation, while the fourfold higher proteins to an increase in cells repairing mechanisms. Thus, both higher carbohydrates and higher proteins would be helping protect cellular physiological fitness. In addition, the fourfold lipids content can be related to energy storage in adverse situation, common in phytoplankton cells (EINICKER-LAMAS et al., 2002; GUSCHINA and HARWOOD, 2006; CHIA et al., 2015b), although the mechanisms underlying this accumulation may be unclear (EINICKER-LAMAS et al., 2002).
36
4.1.3. CONCLUSION
4.2. CHAPTER 2 - Effects of Copper on the photosynthetic process of the microalga Scenedesmus quadricauda
Based on the results of the first part of the present study, we selected 4 copper concentrations where growth was lethal (0.06 – 5 µM) to investigate deeper on the photosynthetic behavior of S. quadricauda. By performing new cultures, photosynthetic parameters were determined, allowing us to understand the effect of copper on the physiology of Scenedesmus quadricauda.
4.2.1. RESULTS
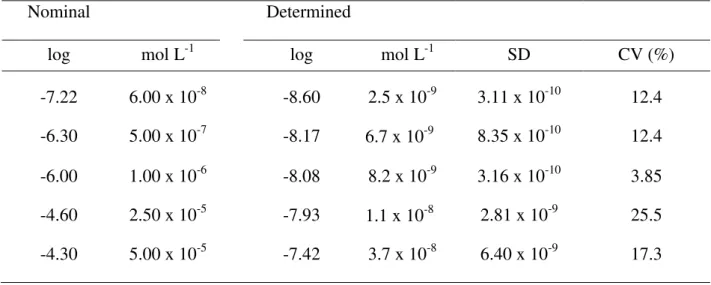
Copper concentrations in the culture medium at the beginning of the experiments and the nominal concentrations are presented in Table 2. Determined copper values, rather than the nominal ones, are used throughout in the results and discussion of this second chapter.
Table 2. Copper speciation in algal growth medium reported as mol L-1 and log of the concentration. Values are the mean of 3 experimental replicates, SD represents the
standard deviation of the mean andCV is the coefficient of variation.
Nominal Determined
log mol L-1 log mol L-1 SD CV (%)
-7.22 6.00 x 10⁻⁸ -8.60 2.5 x 10⁻⁹ 3.11 x 10⁻¹⁰ 12.4 -6.30 5.00 x 10⁻⁷ -8.17 6.7 x 10⁻⁹ 8.35 x 10⁻¹⁰ 12.4 -6.00 1.00 x 10⁻⁶ -8.08 8.2 x 10⁻⁹ 3.16 x 10⁻¹⁰ 3.85 -4.60 2.50 x 10⁻⁵ -7.93 1.1 x 10⁻⁸ 2.81 x 10⁻⁹ 25.5 -4.30 5.00 x 10⁻⁵ -7.42 3.7 x 10⁻⁸ 6.40 x 10⁻⁹ 17.3
38
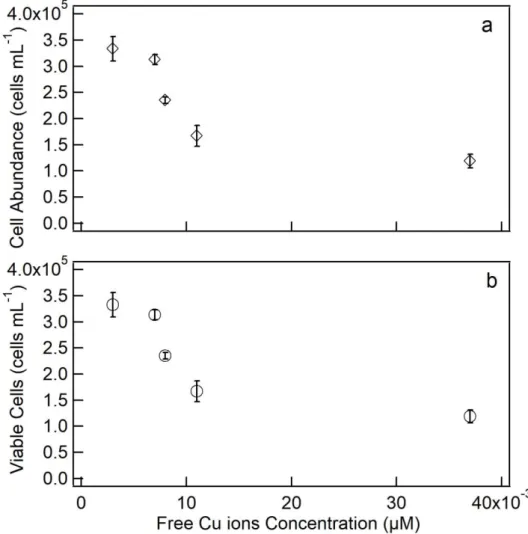
0.011 and 0.037 µM growth was significantly (p<0.05) reduced. Cultures exposed to 0.008, 0.011 and 0.037 µM Cu had approximately 30%, 50% and 64% decrease in population density at 96 h in comparison to the control. Viability of S. quadricauda cells decreased significantly (p<0.05) at 0.008, 0.011 and 0.037 µM Cu compared with the control. For the highest copper concentration (0.037 µM) 64% reduction was obtained (Fig. 5b).
Figure 5. Population density in cultures of S. quadricauda at 96 h Cu exposure as
function of copper concentrations. (a) Cell abundance (cells mL-1); (b) Viable cells (cells
mL-1). Error bars represent standard deviation of the mean (n = 3).
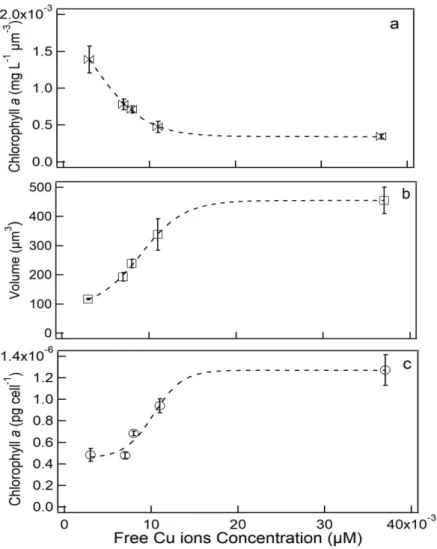
decreased in all treatments (p<0.05; Fig. 6a). In the control, chl a remained ~13 mg µm -3, but above 0.007 µM Cu it decreased with increasing metal addition. The highest decrease in chl a µm-3 was registered at 0.037 µM Cu (3.4 mg µm-3) (Fig. 6a). Cell volume (µm3) was affected by the increase of Cu concentration in culture medium (p<0.05; Fig 6b). The cell volume in the control cultures was 117.1 µm3, but raised up to 338.1 and 455.3 µm3 in cells exposed to 0.011 and 0.037 µM Cu, respectively. No statistically significant (p>0.05) differences were obtained for 0.007 and 0.008 µM Cu. The Chl a concentration per cell significantly increased at 0.011 and 0.037 μM free Cu in relation to control (p<0.05), the concentrations ranged between 0. 48 and 1.27 pg cell−1 up to 0.037 μM of free Cu; this represented an increase of 264% in relation to control.
Figure 6. Chlorophyll a per unit cell volume (mg L-1 µm-3, a), cell volume (µm-3, b), and
chlorophyll a (pg cell-1, c) in culture of S. quadricauda. Data for both 6a and 6b were
40
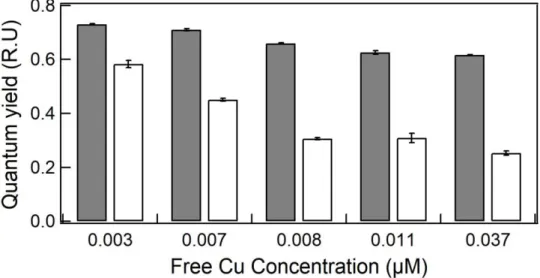
Maximum quantum yield (ΦM) and operational quantum yield (Φ’M) at 96 h are reported as a function Cu concentration (µM) in the medium (Fig. 7). They decreased as Cu increased in the medium. For the maximum quantum yield, it ranged from 0.73 to 0.61 and the lowest values was 15% lower than the control (p<0.05). For the operational quantum yield the lowest values was 56% lower than the control (p<0.05). At 0.007, 0.008 and 0.011 µM Cu did not significantly (p>0.05) affect Φ’
M as compared to control.
Figure 7. Quantum yield (relative units) as function of Cu concentration (µM) at 96 h
exposure. Gray bars: maximum PSII quantum yield; White bars: operational PSII quantum yield. Error bars represent standard deviation of the mean (n = 3).
Approximately 30% of the energy was converted to photochemical quenching, while in the control the corresponding value was about 50%.
Heat dissipation, expressed as relative unquenched fluorescence (UQF(rel)) was significantly higher in relation to the control (p<0.05) for 0.008 and 0.011 µM Cu (Fig. 8). Exposed to these Cu concentrations, S. quadricauda increased heat dissipation to about 40%, while in the control it was 20%. The relative non-photochemical quenching (qN(rel)) remained stable for all copper concentrations tested (p>0.05, Fig. 8).
Figure 8. Relative distribution of the PSII dissipation energy processes. Black bars:
relative photochemical quenching (qP(rel)); Dashed bars: relative unquenched fluorescence (UQF(rel)); White bars: relative non-photochemical quenching (qN(rel)).
Error bars represent standard deviation of the mean (n = 3).
42
irradiance (Ek) shown in Fig. 10b decreased significantly with added copper (p<0.05), and at 0.008 and 0.011 µM the Ek values of 86 and 37 µmol photons m-2 s-1 were obtained the maximum relative ETR (Fig. 10c) was also affected and significantly decreased (p<0.05) to the maximum of 32% lower than the control at 0.008, 0.011 and 0.037 µM Cu exposure.
Figure 9. Light saturation curves (a) and initial phase of light saturation curves (b)
expressed as relative electron transport rate (rETR) for S. quadricauda at 96 h copper
exposure as function photosynthetically active radiation (PAR). Circle: 0.06; Diamond: 0.5; Triangle: 1.0; Hourglass: 2.5; Square: 5.0 µM Cu. Error bars represent standard
Figure 10. Parameters of light saturation curves as functionof Cu concentrations (µM) for S. quadricauda (96 h). (a) Initial slope, α; (b) Saturation irradiance, Ek; (c) Maximum relative
44
4.2.2. DISCUSSION
Copper is one the most widespread trace metals in nature (FERNANDES and HENRIQUES, 1991) and despite the fact that its effects have been extensively studied, its toxicity and influence on organisms physiology is still under debate (ASH and STONE, 2003). In this study we showed that Cu presented toxic effects in the physiology and photosynthesis of S. quadricauda at environmentally important concentrations. In addition, we showed that free copper ions concentrations in LC Oligo culture medium were generally lower than the corresponding nominal values.
The variation in free cupric ion concentration as a function of the nominal copper concentration is in agreement with that observed by Lombardi et al., (2002) and Rodgher et al., (2008). It suggests that after the addition of copper, it interacted with dissolved organic and inorganic ligands, as well as algal cells present in the culture system (ALLEN and HANSEN, 1996; LOMBARDI et al., 2002). This decrease can be a problem in ecotoxicity evaluations if free Cu ions are not determined, since the metals bioavailability can be reduced.
The physiological endpoints such as cell abundance and viability, chlorophyll a and photosynthetic parameters were sensible to the effects of copper. Their decrease as copper was increased in the culture medium is in agreement to other literature results (QIAN et al., 2009; MAGDALENO et al., 2014; CHIA et al., 2015b; LOMBARDI et al., 2011; MACHADO et al., 2015; TSAI et al., 2015).
favor a lower nutrient/metal absorption per unit volume and a consequent lower cell division rate. It may be a strategy for cell to survive the stressing conditions imposed by copper.
The decrease in chlorophyll a synthesis per biovolume we obtained suggest that despite the increase in cell volume, chlorophyll a synthesis was reduced by the action of copper. We can rationale that this increase in chlorophyll a per cell is associated to a response of cell machinery to survive copper stress, however this chlorophyll was not functional since it did not reflect in better photosynthesis. Similar results were observed by Echeveste et al. (2017) when investigating C. braunii exposed to copper. The authors also observed the impacts of copper in the photosynthetic process through decreases in quantum yields, quenchings, and electrons transportation rate.
Analysis of the chlorophyll fluorescence results showed that the maximum quantum yield was the less affected photosynthetic related parameter when compared with growth parameters, such as cell viability and chlorophyll a. These results are in agreement with those that have been observed by other researchers (MIAO et al., 2005; PERALES-VELA et al., 2007; ECHEVESTE et al., 2017). The observed decrease in maximum quantum yield (ΦM) with increase of Cu concentration in culture medium confirmed the toxic effects of Cu in photosynthesis (DEWEZ et al., 2005). The strong effects of copper on the operational quantum yield (Φ’M) showing that in the most stressing condition only ~20% of the absorbed light was directed to photosynthesis confirms that this is a sensitive parameter for measuring the toxic effect Cu. Similar results were observed for Chlamydomonas reinhardtii wherein Φ’M decreased strongly due to the action Cu (JUNEAU et al., 2002). Miao et al. (2005) showed that Synechococcus used just 40% of the absorbed light in photosynthesis with the other 60% being dissipated as non-photochemical quenchings in the higher Cu concentration they tested. According to these authors, the decrease in ΦM and Φ’M is an indication that Cu affects the whole electron transport chain (MIAO et al., 2005).
46
loss of the ability of the photosynthetic apparatus to maintain QA in the oxidized state (BRACK et. al., 1998) and/or inhibits the photosynthetic electron flow to the plastoquinone in PSII by blocking the electron transport chain just after the primary electron acceptor (QA) (FALKOWISK and RAVEN, 1997).
The light energy that was not used for photochemistry was dissipated through non-photochemical quenchings (qN(rel) or UFQ(rel)). The dissipation energy pathways assessed through quenching analysis enabled us to determine when PSII functioning was altered by Cu (HERLORY et al., 2013). With the reduction of qP(rel), qN(rel) and UQF(rel) trend was to increase. In this study, at 0.011 and 0.037 µM Cu, UQF(rel) increased more than qN(rel), indicating that the cells were dissipating more as heat than as fluorescence. Literature information supports the use of UQF(rel) as an index of stress (JUNEAU et al., 2001; MISRA et al. 2012, HERLORY et al., 2013; ECHEVESTE et al., 2017), with high values indicating more stressed algae. The non-photochemical quenching qN has also been considered a sensitive parameter for measuring the toxic effects of copper, as shown by Juneau and Popovic (1999). However, in our study, qN(rel) was not a sensitive parameter for copper exposed S. quadricauda. This is in accordance to the results of Lombardi and Maldonado (2011), which showed that NPQ was more sensitive of Cu effects than qN in phytoplankton. According to Juneau et al. (2002), this parameter may be misleading under extreme conditions. For example, when complete inhibition of the PSII photochemistry occurs, qN cannot express the stress caused by metals, so explaining our results.
The parameters we obtained after modeling the light saturation curves and reported as rETRmax, α, and EK are evidence that S. quadricauda was dealing with a stress situation. The rETR is an approximation of the rate of electrons pumped through the photosynthetic chain (BEER et al., 2001), and its maximum value represents the capacity of the photosystems to utilize the absorbed light energy (BELSHE et al., 2007). Under moderate irradiance, the capacity of the electron transport chain limits photosynthesis and the curve reaches a plateau, where maximum photosynthetic capacity occurs (rETRmax) (SCHREIBER, 2004). Our Ek results showed that Cu added in the medium affected the capacity of S. quadricauda to deal with light, decreasing its ability to support high light intensity.
4.2.3. CONCLUSION
48
5. FINAL CONSIDERATIONS
The physiological behavior of Scenedesmus quadricauda differed when it was exposed to environmentally relevant or to high Cu concentrations. The most sensitive indicator of copper toxicity was growth rate or the cells ability to divide; maximum quantum yield was not a good indicative of Cu toxicity, needing 14 times more Cu to observe similar effect.
The production of biomolecules was triggered at copper concentrations of 1.0 µM and above, with tenfold total carbohydrates and fourfold total proteins in comparison with the controls. However, higher Cu was necessary to induce fourfold lipid accumulation comparing to the controls. Supported by the biomolecules productivity results, we propose that 1.0 µM Cu in culture medium is a compromise between growth rate, cell biomass and biomolecules accumulation in S. quadricauda.
The cell volume increased as metal concentrations increased, although chlorophyll a content per unit volume decreased. This suggests that larger cells divide less and accumulate less pigment, possibly in reason to lack of nutrients and/or copper inhibition.
Copper has significantly altered the photosynthetic process in S. quadricauda, showing its ability to change the photosynthetic apparatus as well as the reaction centers, which are corroborated by the reduction of quantum yields, the light saturation curve and its parameters.
6. REFERENCES
ABO-FARHA, S. A. et al. Removal of some heavy metal cations by synthetic resin purolite C100. Journal of hazardous materials, v. 169, n. 1-3, p. 190-194, 2009. AFKAR, E., ABABNA, H., FATHI, A.A. Toxicological response of the green alga Chlorella vulgaris, to some heavy metals. America Journal of Environmental Science. v. 6, p. 230–237, 2010.
AFNOR - Association Française Normalisation, Norme experimentale. T90-304. Essais deseaux. Determination de I’inhibition de Scendesmus quadricauda par une substance, Paris, France 1980.
AGGARWAL, A. et al. Metal toxicity and photosynthesis. Photosynthesis: overviews on recent progress and future perspectives, p. 229-236, 2012.
ANAND, J., ARUMUGAM, M.,. Enhanced lipid accumulation and biomass yield of Scenedesmus quadricauda under nitrogen starved condition. Bioresource Technology. v. 188, p. 190–194, 2015.
ANGEL, B.M., SIMPSON, S.L., GRANGER, E., GOODWYN, K., JOLLEY, D.F. Time-averaged concentrations are effective for predicting chronic toxicity of varying copper pulse exposures for two freshwater green algae species. Environmental Pollution. v. 230, p. 787–797, 2017.
ASH, C.; STONE, R. A question of dose. Science v. 300 (5621), p. 925, 2003.
AWASTHI, M., RAI, L.C., Toxicity of nickel, zinc, and cadmium to nitrate uptake in free and immobilized cells of Scenedesmus quadricauda. Ecotoxicology Environmental Safety v. 61, p. 268–272, 2005.
BAKER, N. R. Chlorophyll fluorescence: a probe of photosynthesis in vivo. Annual Review of Plant Biology, v. 59, p. 89-113, 2008.
BELSHE, E. F.; DURAKO, M. J.; BLUM, J. E. Photosynthetic rapid light curves (RLC) of Thalassia testudinum exhibit diurnal variation. Journal of Experimental Marine Biology and Ecology, v. 342, n. 2, p. 253-268, 2007.
BILGRAMI, K.S., KUMAR, S. Effects of copper, lead and zinc on phytoplankton growth. Biologia Plantarum v. 39(2), p. 315-317, 1997.
50
BOSSUYT, B.T.A., JANSSEN, C.R. Long-term acclimation of Pseudokirchneriella subcapitata (Korshikov) Hindak to different copper concentrations: Changes in tolerance and physiology. Aquatic Toxicology. v. 68, p. 61–74, 2004.
BRACK, W; FRANK, H. Chlorophyll a Fluorescence: A Tool for the Investigation of Toxic Effects in the Photosynthetic Apparatus. Ecotoxicology and Environmental Safety, v. 40, n. 1-2, p. 34-41, 1998.
BRADFORD, M.M. A rapid and sensitive method for the quantitation of microgram quantities of protein utilizing the principle of protein-dye binding. Analytical Biochemistry, v.72, p. 248–254, 1976.
BROWN, L. N., ROBINSON, M. G., HALL, B. D. Mechanisms for copper tolerance in Amphora coffeaeformis-internal and external binding. Marine Biology, v. 97(4) p. 581-586, 1988.
CAMARGO, E. C.; LOMBARDI, A. T. Effect of cement industry flue gas simulation on the physiology and photosynthetic performance of Chlorella sorokiniana. Journal of Applied Phycology, p. 1-11, 2016.
CANDIDO, C; LOMBARDI, A. T. The physiology of Chlorella vulgaris grown in conventional and biodigested treated vinasses. Algal Research, v. 30, p. 79-85, 2018.
CHIA, M.A., GALADIMA, S.Y., JAPHET, W.S., Combined effect of atrazine and copper on the growth, biomass production, morphology and antioxidant response of Scenedesmus quadricauda. Phycologia v. 54, p. 109–117, 2015a.
CHIA, M.A., LOMBARDI, A.T., MELÃO, M.G.G., PARRISH, C.C. Combined nitrogen limitation and cadmium stress stimulate total carbohydrates, lipids, protein and amino acid accumulation in Chlorella vulgaris (Trebouxiophyceae). Aquatic Toxicology, v. 160, p. 87–95, 2015b.
CHONG, A.M.Y., WONG, Y.S., TAM, N.F.Y. Performance of different microalgal species in removing nickel and zinc from industrial wastewater. Chemosphere v. 41, p. 251–257, 2000.
CHOUDHARY, M. et al. Effect of heavy metal stress on proline, malondialdehyde, and superoxide dismutase activity in the cyanobacterium Spirulina platensis-S5. Ecotoxicology Environmental Safety, v. 66, p. 204–209, 2007.
CID, Á., HERRERO, C., ABALDE, J. Functional analysis of phytoplankton by flow cytometry: a study of the effect of copper on a marine diatom. Science Marine, v. 60, p. 303-308, 1996.
CLIJSTERS, H. v; VAN ASSCHE, F. Inhibition of photosynthesis by heavy metals. Photosynthesis Research, v. 7, n. 1, p. 31-40, 1985.
D’ORS, et al. Toxic effects and specific chromium acquired resistance in selected strains of Dyctiosphaerium chlorelloides. Chemosphere v. 81, p. 282–287, 2010. CONAMA-Conselho Nacional do Meio Ambiente- Resolução N° 357, 17 de Março de 2005. Disponível: http://www.mma.gov.br/port/conama/res/res05/res35705.pdf acesso: 15/03/2018
DE BEER, D.; LARKUM, A. W. D. Photosynthesis and calcification in the calcifying algae Halimeda discoidea studied with microsensors. Plant, Cell & Environment, v. 24, n. 11, p. 1209-1217, 2001.
DEBUS, R. J. The manganese and calcium ions of photosynthetic oxygen evolution. Biochimica et Biophysica Acta (BBA)-Bioenergetics, v. 1102, n. 3, p. 269-352, 1992.
DEWEZ, D. et al. Determination of photosynthetic and enzymatic biomarkers sensitivity used to evaluate toxic effects of copper and fludioxonil in alga Scenedesmus obliquus. Aquatic Toxicology, v. 74, n. 2, p. 150-159, 2005.
DROPPA, M; HORVÁTH, G. The role of copper in photosynthesis. Critical reviews in plant sciences, v. 9, n. 2, p. 111-123, 1990.
ECHEVESTE, P., CROOT, P., VON DASSOW, P.,. Differences in the sensitivity to Cu and ligand production of coastal vs offshore strains of Emiliania huxleyi. Science of the Total Environment. In press. 2017a.
ECHEVESTE, P., SILVA, J.C., LOMBARDI, A.T., Cu and Cd affect distinctly the physiology of a cosmopolitan tropical freshwater phytoplankton. Ecotoxicology Environmental Safety, v. 143, p. 228–235, 2017b.
EINICKER-LAMAS, M., et al. Euglena gracilis as a model for the study of Cu2+ and Zn2+ toxicity and accumulation in eukaryotic cells. Environmental Pollution, v. 120, p. 779–786, 2002.
FALKOWSKI, P. G.; RAVEN, J. A. Aquatic Photosynthesis. Princeton University Press, 2007.
FARGAŠOVÁ, A., BUMBÁLOVÁ, A., HAVRÁNEK, E. Ecotoxicological Effects and Uptake of Metals (Cu+, Cu2+, Mn2+, Mo6+, Ni2+, V5+) in freshwater alga Scenedesmus quadricauda. Chemosphere v. 38, p. 1165–1173, 1999.
FAUCHER, S.L.; BEHRA, R. Phytochelatin induction, cadmium accumulation, and algal sensitivity to free cadmium ion in Scenedesmus vacuolatus. Environmental Toxicology and Chemistry Oxford v. 24, p. 1731-7, 2005.
52
A comparative study. Journal Environmental Management, v. 111, p. 106–114, 2012.
FRANKLIN, N.M., STAUBER, J.L., LIM, R.P., PETOCZ, P. Toxicity of metal mixtures to a tropical freshwater alga (Chlorella sp): the effect of interactions between copper, cadmium, and zinc on metal cell binding and uptake. Environ. Toxicol. Chem. v. 21, p. 2412–2422, 2002.
GANTAR, M., OBREHT, Z., DALMACIJA, B. Nutrient removal and algal succession during the growth of Spirulina platensis and Scenedesmus quadricauda on swine wastewater. Bioresource Technology, v. 36, p. 167–171, 1991.
GAUR, A; ADHOLEYA, A. Prospects of arbuscular mycorrhizal fungi in phytoremediation of heavy metal contaminated soils. Current Science, p. 528-534, 2004.
GIBSON, C. E. Algicidal effect of copper on a green and a blue-green-alga and some ecological implications. Journal Applied Ecology, v. 9, p. 513-518, 1972.
GLEDHILL, M. et al. The toxicity of copper (II) species to marine algae, with particular reference to macroalgae. Journal Phycology, v. 33, p. 2–11, 1997.
GORBI, G., ZANNI, C., CORRADI, M.G. Sulfur starvation and chromium tolerance in Scenedesmus acutus: A possible link between metal tolerance and the regulation of sulfur uptake/assimilation processes. Aquatic Toxicology. v. 84, p. 457–464, 2007. GRIFFITHS, M. J., VAN HILLE, R. P., HARRISON, S. T. L. Lipid productivity, settling potential and fatty acid profile of 11 microalgal species grown under nitrogen replete and limited conditions. Journal Applied Phycology, v. 24, p. 989–1001, 2012. GUANZON, G., NAKAHARA, H., YOSHIDA, Y. Inhibitory effects of heavy metals on growth and photosynthesis of three freshwater microalgae. Fisheries Science, v. 60(4), p. 379-384, 1994.
GUSCHINA, I.A., HARWOOD, J.L. Lipids and lipid metabolism in eukaryotic algae. Progress in Lipid Research, 45, 160–186 (2006).
HERLORY, O; BONZOM, J-M.; GILBIN, R. Sensitivity evaluation of the green alga
Chlamydomonas reinhardtii to uranium by pulse amplitude modulated (pam)
fluorometry. Aquatic Toxicology, V. 140, P. 288-294, 2013.
HORVÁTH, G., ARELLANO, J.B., DROPPA, M., BARÓN, M. Alterations in photosystem II electron transport as revealed by thermoluminescence of Cu-poisoned chloroplasts. Photosynthesis Research, v. 57, p. 175–182, 1998.
JAY, A. E. et al. A high-sensitivity chlorophyll fluorescence assay for monitoring herbicide inhibition of photosystem II in the chlorophyte Selenastrum capricornutum: comparison with effect on cell growth. Archiv für Hydrobiologie, p. 273-286, 1997. JEGERSCHOLD, C. et al. Copper (II) inhibition of electron transfer through photosystem II studied by EPR spectroscopy. Biochemistry v. 34, p. 12747–12754, 1995.
JUNEAU, P.; EL BERDEY, A.; POPOVIC, R. PAM fluorometry in the determination of the sensitivity of Chlorella vulgaris, Selenastrum capricornutum, and Chlamydomonas reinhardtii to copper. Archives of environmental contamination and toxicology, v. 42, n. 2, p. 155-164, 2002.
JUNEAU, P.; HARRISON, P. J. Comparison by PAM fluorometry of photosynthetic activity of nine marine phytoplankton grown under identical conditions. Photochemistry and photobiology, v. 81, n. 3, p. 649-653, 2005.
JUNEAU, P.; POPOVIC, R. Evidence for the rapid phytotoxicity and environmental stress evaluation using the PAM fluorometric method: importance and future application. Ecotoxicology, v. 8, n. 6, p. 449-455, 1999.
KADUKOVÁ, J., VIRČÍKOVÁ, E. Comparison of differences between copper bioaccumulation and biosorption. Environment International v. 31, p. 227–232, 2005. KOVÁČIK, J., KLEJDUS, B., HEDBAVNY, J., BAČKOR, M. Effect of copper and salicylic acid on phenolic metabolites and free amino acids in Scenedesmus quadricauda (Chlorophyceae). Plant Science v.178, p. 307–311, 2010.
KRAUSE GH, WEIS E. Chlorophyll fluorescence as a tool in plant physiology. II. Interpretation of fluorescence signals. Photosynthesis Research v. 5, p.139–157, 1984. KRUPA, Z.; BASZYNSKI, T. Some aspects of heavy metals toxicity towards photosynthetic apparatus-direct and indirect effects on light and dark reactions. Acta Physiologiae Plantarum, v. 2, n. 17, 1995.
KÜPPER, H., KÜPPER, F., SPILLER, M. Environmental relevance of heavy metal-substituted chlorophylls using the example of water plants. Journal of Experimental Botany, v. 47, p. 259–266, 1996.
KÜPPER, H., SETLÍK, I., SPILLER, M., KÜPPER, F.C., PRÁSIL, O. Heavy metal-induced inhibition of photosynthesis: Targets of in vivo heavy metal chlorophyll formation. Journal Phycology v. 38, p. 429–441, 2002.