Cleverson Henrique de Freitas(1), Fabrina Bolzan Martins(1) and Marcel Carvalho Abreu(1)
(1)Universidade Federal de Itajubá, Instituto de Recursos Naturais, Avenida BPS, no 1.303, Pinheirinho, CEP 37500-903 Itajubá, MG, Brazil. E-mail: [email protected], [email protected], [email protected]
Abstract – The objective of this work was to estimate cardinal temperatures and phyllochron for the leaf development of the eucalyptus species Corymbia citriodora and Eucalyptus urophylla, in the seedling phase.
A field experiment was carried out in a completely randomized design, in a 2x11 factorial arrangement, with the two eucalyptus species, 11 sowing dates, and five replicates, in the municipality of Itajubá, in the state of Minas Gerais, Brazil. The cardinal temperatures – base, optimum, and maximum – for leaf development
were, respectively, 8.7, 17.1, and 41.3°C, for C. citriodora, and 11.5, 17.1, and 40.5°C for E. urophylla. The phyllochron of C. citriodora was 62.95°C day per leaf, and that of E. urophylla was 46.03°C day per leaf, which indicates that E. urophylla requires less energy accumulation than C. citriodora for leaf emission in the main stem.
Index terms: air temperature, leaf emission rate, phyllochron, seedling quality, thermal requirement.
Temperaturas cardinais para o desenvolvimento foliar de
mudas de
Corymbia citriodora e Eucalyptus urophylla
Resumo – O objetivo deste trabalho foi estimar as temperaturas cardinais e o filocrono para o desenvolvimento
foliar das espécies de eucalipto Corymbia citriodora e Eucalyptus urophylla, durante a fase de muda. Um
experimento de campo foi realizado em delineamento inteiramente casualizado, em arranjo fatorial 2x11, com as duas espécies de eucalipto, 11 épocas de semeadura e cinco repetições, em Itajubá, MG. As temperaturas
cardinais – basal inferior, ótima e basal superior – para o desenvolvimento foliar foram, respectivamente, 8,7, 17,1 e 41,3°C, para C. citriodora, e11,5, 17,1 e 40,5°C, para E. urophylla. O filocrono de C. citriodora foi de 62,95°C dia por folha, e o de E. urophylla, de 46,03°C dia por folha, o que é indício de que E. urophylla necessita de menor acúmulo energético do que C. citriodora para a emissão de folhas na haste principal.
Termos para indexação: temperatura do ar, taxa de emissão foliar, filocrono, qualidade de mudas, necessidade
térmica.
Introduction
Air temperature has a direct effect on the physiological processes of plants, moderating the biochemical reactions of photosynthesis and photorespiration, besides regulating the enzymatic activities, the transportation and translocation speed of solutes, and the balance between transpiration and soil water consumption. These processes directly affect the plant development rate (Soltani & Sinclair, 2012; Callejas et al., 2014), with emphasis on leaf emission rate, known as phyllochron (Erpen et al., 2013), and on yield. Air temperature is considered the meteorological element that most affects the development of annual and perennial plants (Rosa et al., 2009; Lisboa et al., 2012).
represents the temperature at which plant development is maximum. The cardinal temperatures vary between species, genotypes of the same species and also according to the evaluated period of development (Lago et al., 2009).
In most cases, cardinal temperatures are determined by statistical methods, based on data of phenological observations and average air temperature (Lago et al., 2009; Souza & Martins, 2014). For the Tb estimation, there is a variety of methods, among which the most used ones are: standard deviation in days and days, the coefficient of variation in days and degree-days, regression coefficient, X-intercept, and the smallest value for the mean square error (Yang et al., 1995; Sinclair et al., 2004). In order to estimate the optimum temperature, plants should be subjected to the best developmental conditions, which is usually done under controlled experimental conditions (Soltani & Sinclair, 2012) using of growth rooms, which are expensive. However, for the estimation of TB, the number of methodologies is reduced and, generally, they have a high cost of determination. Moreover, these temperatures are hardly reached during the development cycle in the field (Lima & Silva, 2008; Souza & Martins, 2014).
The knowledge of cardinal temperatures and phyllochron values is important to optimize the management strategies, to improve seedling production and quality, to support selection and breeding programs, and to choose species that are more adapted to the climatic conditions of the growing location (Müller et al., 2009; Martins et al., 2012). Studies of this nature are widely carried out on agricultural (Sinclair et al., 2004; Lago et al., 2009; Lucas et al., 2012), ornamental, and medicinal crops (Luz et al., 2012), but are still scarce on perennial crops (Lima & Silva, 2008; Callejas et al., 2014; Souza & Martins, 2014), especially forest species, even on those of great economic interest, such as eucalyptus (Martins et al., 2007).
The increasing demand for products from eucalyptus (Abreu et al., 2015), as well as the importance of producing and using good quality seedlings for success in field establishment (Martins et al., 2007), makes this information important for increasing the efficiency of this crop chain of production.
The objective of this work was to estimate cardinal temperatures and phyllochron for leaf development
of the eucalyptus species Corymbia citriodora and Eucalyptus urophylla, in the seedling phase.
Materials and Methods
The experiment was carried out in the experimental area of the Universidade Federal de Itajubá, in the municipality of Itajubá, in the state of Minas Gerais, Brazil. According to Köppen-Geiger’s classification, the climate of the region is Cwa, tropical of altitude, with dry winters, and hot and rainy summers (Abreu et al., 2015).
The experiment was conducted in a completely randomized design, in a 2x11 factorial arrangement, with two eucalyptus species, Corymbia citriodora (Hook) K. D. Hill & L. A. S. Johnson and Eucalyptus urophylla S. T. Blake, 11 sowing dates, and 5 replicates, totalizing 110 experimental units (EU). Each EU contained two plants, grown in 8 L pots filled with soil of the A horizon of a Latossolo Vermelho distrófico típico (Santos et al., 2013), a Rhodic Hapludox.
The chemical and physical analyses of the soil were carried out, with subsequent correction of acidity and fertility by the application of 10.18 g of simple superphosphate, 0.31 g of potassium chloride, and 0.20 g of ammonium sulfate, in each pot, in addition to liming with 12.32 g of CaCO3, according to Ribeiro
et al. (1999).
The pots were coated with newsprint paper to prevent substrate heating by the absorption of solar radiation, which could be a source of experimental error (Martins et al., 2007). Daily and regular watering was carried out in the evening period, aimimg at leaving the soil close to saturation in each pot, in order to eliminate the possibility of water stress occurrence, which could affect leaf emission. Watering was not performed on rainy days.
Leaf development was quantified by the number of leaves accumulated in the main stem (NL) during the seedling phase, which began when plants reached 50% of the emergence, and ended when each experimental unit reached an average of 20 accumulated leaves (Martins et al., 2007; Abreu et al., 2015). The axillary shoots were removed, in order to keep only the main stem growing. The number of leaves was counted once a week, when each leaf was at least 1.0 cm length (Martins et al., 2012).
Daily data of average air temperature were collected from the automatic meteorological station of the Universidade Federal de Itajubá, located 500 m apart from the experimental area.
In order to estimate Tb, the methodology of the smallest mean square error (MSE) (Sinclair et al., 2004) was used, which was chosen for its precision and simplicity (Martins et al., 2012). For each species and sowing date (E1 to E4), simple linear regressions were carried out between the mean NL, given by the arithmetic mean of the NL of the five experimental units, and the accumulated thermal time (TT, °C day), obtained by the expression
TT Tmed Tb T Tb T Tb
i n med med = − = =
∑
1, if < ,
in which: Tmed is the medium air temperature, obtained
by the arithmetic mean of hourly temperatures from the automatic weather station (°C); Tb is the base temperature (°C); ‘i’ is the date of emergence; and ‘n’ is the end date of the seedling phase. For the calculation of TT, a Tb series that varied from 0 to 20°C was used at 0.5°C intervals (Lucas et al., 2012). The Tb value for each sowing date was the one that showed the lowest MSE value of the linear regressions (Martins et al., 2012); while the Tb value, for each species, was obtained by the arithmetic mean of the Tb values observed at different sowing dates.
To estimate TB, the methodology modified by Lima & Silva (2008) was used with the following expressions:
Case 1: TB>Tmed> Tb.
A N TM TM N TM Tm B N TM TM N TM Tm C ( TM Tm
2 1 2 2 2 1
1 1 2 1 1 2
1 1
= ⋅ ⋅ − ⋅ ⋅
= − ⋅ ⋅ + ⋅ ⋅
= − + )) ( TM Tm )
D N Tm N 2 Tm N N Tb Tm Tm N E Tm
2 2
1 2
2
2 2 1 2 2 1 1
2 2 ⋅ − + = ⋅ ⋅ − ⋅ ⋅ ⋅ ⋅ − ⋅ ⋅ = − ⋅⋅ ⋅ + ⋅ ⋅ − ⋅ ⋅ + ⋅ ⋅ ⋅ = ⋅ ⋅
TM N N TM Tm Tm N Tm 2 Tm N Tb F Tm N TM
1 1 2
2 2
1 2 1 2
2
2 2 2
2 1 1 2 2 2 2 2 1 1 2 2 1 1 2 2 1 2
2 1 1
2 N TM Tb 2 N TM Tb G TM N TM Tm N N 2 Tm
− ⋅ ⋅ ⋅ − ⋅ ⋅ ⋅
= ⋅ ⋅ + ⋅ ⋅ − ⋅ ⋅⋅ ⋅ ⋅
= ⋅ ⋅ ⋅ + ⋅ ⋅ ⋅ ⋅ + ⋅ ⋅ ⋅ ⋅
= −
N N Tb H 2 Tm N Tb 2 N TM N Tb 2 N TM N Tb I 2
2 1
1 2 2
1 2 2 2 1 1
⋅⋅ ⋅ ⋅ ⋅ + ⋅ ⋅ − ⋅ ⋅
= − ⋅ + ⋅ +
N TM N TM N TM TM Tm N TM J N TM N Tm N
2 1 1 2 2
2
1 2 1 2
2 2 1 2 1 2 2⋅⋅TM1−N2⋅Tm1
TB=[A+B± C×(D+E+ +F G+H+I)] J
Case 2: TB> Tb>Tmed. For calculation purposes, the highest TB value is considered:
A N Tb TM N Tb Tm N TM Tb
B N Tm Tb N TM TM
= − ⋅ ⋅ + ⋅ ⋅ + ⋅ ⋅
= − ⋅ ⋅ − ⋅ ⋅ ⋅ +
1 2 1 2 2 1
2 1 2 2 1 2 22
2 2
2 2 1
1 1 2 1 1 2
1 2 1 2 2
⋅ ⋅ ⋅
= ⋅ ⋅ ⋅ − ⋅ ⋅ ⋅
= ⋅ − ⋅ −
N TM Tm
C N TM TM N TM Tm
D N TM N Tm N ⋅⋅TM1+N2⋅Tm1
TB=(A+B+C) D,
in which: N1 and N2 are the number of days of
seedling production cycle – ranging from 50% of emergence to the final seedling phase – for the two sowing dates, respectively, with the highest average of air temperature; TM1 and TM2 are the maximum air
temperatures of the two sowing dates; Tm1 and Tm2 are
minimum air temperatures.
In order to estimate the optimum temperature, the methodology proposed by Lisboa et al. (2012) was Table 1. Sowing date and seedling emergence periods(1) of
Corymbia citriodora and Eucalyptus urophylla.
Sowing date Seedling emergence
C. citriodora E. urophylla
E1, 04/04/2014 04/22/2014 04/22/2014 E2, 05/05/2014 05/15/2014 05/15/2014 E3, 06/02/2014 06/26/2014 06/26/2014 E4, 07/02/2014 07/30/2014 07/30/2014 E5, 08/19/2014 09/07/2014 09/07/2014 E6, 09/16/2014 09/30/2014 10/02/2014 E7, 10/15/2014 10/29/2014 10/29/2014 E8, 11/18/2014 12/03/2014 11/30/2014 E9, 12/18/2014 12/28/2014 12/28/2014 E10, 01/21/2015 02/05/2015 -(2)
E11, 02/20/2015 02/27/2015 02/27/2015
(1)The emergence date was considered when 50% of the seedlings were
above the soil level. (2)All experimental units of E. urophylla were lost in
used, which is based on the arithmetic mean of air temperature of the sowing date with the highest leaf development and, consequently, lowest phyllochron. For this, the phyllochron was determined for each species and experimental unit, during the sowing dates, by the inverse of the linear regression coefficient between NL and TT, from the emergence date, using the Tb value estimated by the MSE.
To verify the normality of the data, the Shapiro-Wilk test was used, at 5% probability. Data which did not follow normality were transformed by Ln(x). The phyllochron values were subjected to the analysis of variance, in order to evaluate the effect of the sources of variation (species and sowing dates); and the means were compared by the Scott-Knott’s test, at 5% probability. The tests were carried out with the statistical Sisvar software, version 5.3 (Ferreira, 2011).
Results and Discussion
Plants were subjected to wide temperature oscillations during the evaluated 11 sowing dates (Table 2). Air temperature varied between 3.8ºC – absolute minimum value of temperature, observed in the sowing dates E2, E3, and E4 – and 35.7ºC, absolute maximum
temperature, observed during the sowing dates E3 to E9. These different meteorological conditions affected leaf emission speed and development, which are important in studies of development and plant growth (Rosa et al., 2009), and for the estimation of cardinal temperatures (Lima & Silva, 2008; Souza & Martins, 2014).
The difference in the meteorological conditions during the 11 sowing dates also affected the seedling development, whose duration showed a tendency of reduction during periods with higher temperatures, and a tendency of increase during periods with lower temperatures. The presence of an inverse relationship between air temperature and duration of the seedling phase justifies the choice of the first four seasons (April, May, June, and July) for the Tb estimation. The same tendency was observed by Luz et al. (2012) in canola, and by Souza & Martins (2014) in olive cultivars. However, E7 showed a long duration, even in high air temperature conditions, which would justify the choice of this period for the TB estimation, while E8 was chosen due to the higher mean air temperature value, in relation to the other periods. It is known that environmental factors, such as extreme temperatures, water and nutritional stress, and photoperiod affect the leaf emission rate (Rosa et al., 2009). In this sense,
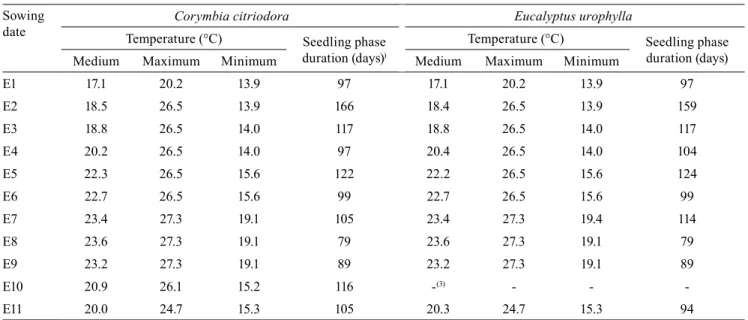
Table 2. Air temperature characterization(1) during the eleven sowing dates of Corymbia citriodora and Eucalyptus
urophylla, and the seedling phase duration(2) for each period.
Sowing date
Corymbia citriodora Eucalyptus urophylla
Temperature (°C) Seedling phase duration (days))
Temperature (°C) Seedling phase duration (days)
Medium Maximum Minimum Medium Maximum Minimum
E1 17.1 20.2 13.9 97 17.1 20.2 13.9 97
E2 18.5 26.5 13.9 166 18.4 26.5 13.9 159
E3 18.8 26.5 14.0 117 18.8 26.5 14.0 117
E4 20.2 26.5 14.0 97 20.4 26.5 14.0 104
E5 22.3 26.5 15.6 122 22.2 26.5 15.6 124
E6 22.7 26.5 15.6 99 22.7 26.5 15.6 99
E7 23.4 27.3 19.1 105 23.4 27.3 19.4 114
E8 23.6 27.3 19.1 79 23.6 27.3 19.1 79
E9 23.2 27.3 19.1 89 23.2 27.3 19.1 89
E10 20.9 26.1 15.2 116 -(3) - -
-E11 20.0 24.7 15.3 105 20.3 24.7 15.3 94
(1)Values obtained by arithmetic averages of maximum, medium and minimum air temperatures. (2)Period extending from the emergence to the end of
seedling phase, which occurred when the accumulated leaves of the main stem achieved an average of 20 leaves. (3)All experimental units of E. urophylla
despite the regular and constant watering, it should be noted that, during the period of conduction of the experiment, the cumulative rainfall was 1,286.8 mm, which is below the climatological average of 1,440 mm. In addition, elevated temperatures occurred, mainly during the E7 and E8 (Table 2). However, this variation of the meteorological conditions, mainly for air temperature, is desirable and a premise for this type of study (Lago et al., 2009; Rosa et al., 2009; Martins et al., 2012).
For Tb estimation, all regressions between the mean NL and the TT showed high values of the adjusted coefficient of determination (R2adj) – above 0.897 for
C. citriodora, and 0.845 for E. urophylla; low MSE values – lower than 1.426 and 1.961, respectively; and significant angular and linear coefficients (p≤0.05). These characteristics are desirable for Tb estimation by the lower MSE values method (Sinclair et al., 2004; Martins et al., 2007).
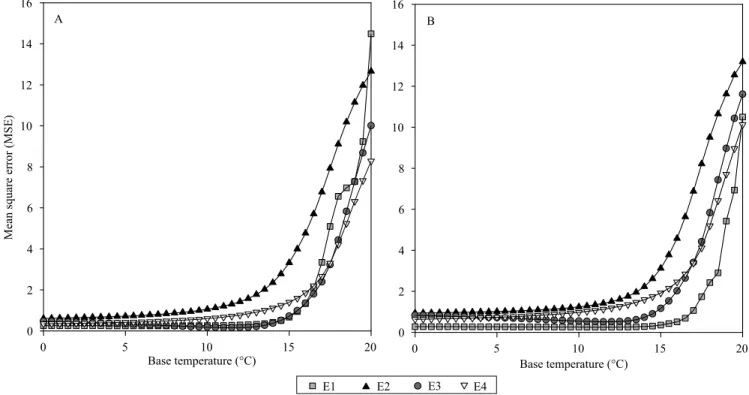
The evaluated species and sowing dates varied for Tb values (Figure 1), which was also observed by Lucas et al. (2012). For C. citriodora, in E1, the lowest value of MSE (0.2487) was for Tb=6°C; in E2, the
lowest value of MSE (0.6073) was for Tb = 0ºC; in E3, the lowest value of MSE (0.1535) was for Tb=11.5°C; and in E4, the lowest value of MSE (0.3482) was for Tb = 0°C. However, from a biological point of view, the value of Tb = 0°C is not considered realistic and, therefore, it was not considered when the average Tb of the species was obtained (Lago et al., 2009; Martins et al., 2012). Thus, the value of Tb obtained for C. citriodora was 8.7°C, using the arithmetic mean of the Tb values of E1 and E3, except for E2 and E4, which showed Tb = 0°C.
The sowing dates E2 and E4 were also not used for the estimation of Tb for E. urophylla (Figure 1), as the lower values of MSE (E2 = 0.9400, and E4 = 0.6327) were obtained for Tb = 0ºC. The sowing dates E1 and E3 showed the lowest values of MSE (0.2541 and 0.5108, respectively) for Tb = 11.5° C, and this value was considered as the Tb of the species. These results indicate advantages in the production of seedlings of C. citriodora in relation to E. urophylla, for winter sowing, when the temperatures are lower.
The Tb varies among species, genotypes of the same species, and usually varies due to the stage of
Figure 1. Mean square error (MSE) of the regression between the number of accumulated leaves in the main stem and the accumulated thermal time, in the four sowing dates with lower values of medium air temperature, with the use of different values of base temperature for: A, Corymbia citriodora; and B, Eucalyptus urophylla.
Base temperature (°C)
0 5 10 15 20
0 2 4 6 8 10 12 14 16 A
Base temperature (°C)
0 5 10 15 20
Mean square error (MSE)
0 2 4 6 8 10 12 14 16
B
development (Yang et al., 1995; Lago et al., 2009) and the studied metabolic process (Soltani & Sinclair, 2012). In the present study, the values of Tb estimated for Corymbia citriodora (8.7ºC) were close to the values reported for leaf development of other perennial crops, such as: E. saligna, 8.0°C (Martins et al., 2007); Acer pensylvanicum, Acerrubrum, and Betula popifolia, 7.5°C (Chiang & Brown, 2007); and the olive cultivar Olea europaea 'Grappolo', 9.6ºC (Souza & Martins, 2014). As to growth (Almeida & Sands, 2016), leaf area index (Battaglia et al., 1996), and photosynthetic process (Sands & Landsberg, 2002) of Eucalyptus globulus, Tb values of 8.5, 7.8, and 7.5ºC were observed, respectively. Regarding the vegetative development of annual crops, close values of Tb were observed, as from 7.0 to 8.0ºC, in ryegrass (Müller et al., 2009), and 8.0 to 10.9ºC in irrigated rice (Lago et al., 2009).
The Tb value of 11.5°C in E. urophylla is close to the one reported for leaf development of E. grandis (10.0°C) (Martins et al., 2007) and other perennial crops, such as: Quercus alba and Populus tremuloides, with 10.0°C (Chiang & Brown, 2007); the olive cultivars Arbequina, with 10.5°C, and MGS ASC315, with 11.0°C (Martins et al., 2012); mango, with 10.6°C (Callejas et al., 2014); and arabica coffee cultivars Rubi MG-1192 and Acaiá Cerrado MG-1474, with 12.9°C (Lima & Silva, 2008). Close Tb values were also reported for some annual crops, such as canola hybrids, with 9.9 and 10.0ºC (Luz et al., 2012), and red rice biotypes, with 9.9 and 10.5ºC (Lago et al., 2009).
The estimated TB values was obtained according to “case 1”, where TB >Tmed> Tb. For C. citriodora, the TB value observed was 41.3°C and, for E. urophylla, 40.5°C. According to the results, C. citriodora shows tolerance to higher temperatures, with a TB slightly higher than that for E. urophylla, during the seedling phase, besides the higher tolerance to lower temperatures (Tb = 8.7ºC, compared to 11.5ºC obtained for E. urophylla). The effect of air temperature above TB can induce significant anomalies on the eucalyptus growth and development, such as floral abortion, reduction of leaf emission, excess of lateral branches, loss of apical dominance and reduction of survival rate (Paton, 1980). The TB values obtained in the present study are realistic, from the biological point of view, and are similar to the values obtained for E. globulus and Pinus ponderosa (40.0ºC) (Sands &
Landsberg, 2002; Landsberg et al., 2003) and higher than those reported for E. grandis (36.0ºC) and E. saligna (35.0ºC) (Martins & Streck, 2007). However, lower TB values are normally observed in perennial or annual crops, such as wheat, rice-red biotypes (35.0ºC) (Rosa et al., 2009; Streck et al., 2011), coffee (32.4ºC) (Lima & Silva, 2008), and cashew (30.7ºC) (Matos et al., 2014). Due to the large variation in TB values for annual crops, as presented in the literature, it is possible to infer that perennial crops are more tolerant, and therefore more adapted to higher air temperatures. Optimum temperatures were obtained by linear regressions, which resulted in high R2 adjusted values
(above 0.864), low MSE (lower than 3.847), significant coefficients (p≤0.05), and linearity between leaf development and air temperature (Figures 2 and 3). In addition, they indicated that air temperature strongly affects leaf emission in the two evaluated species, and that their estimation is possible with the use of the proposed methodology by Lisboa et al. (2012).
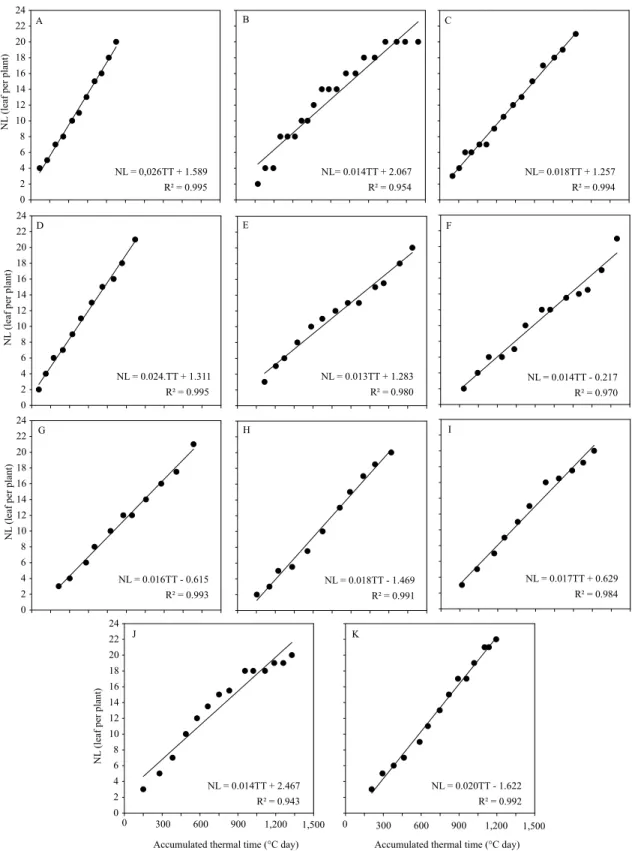
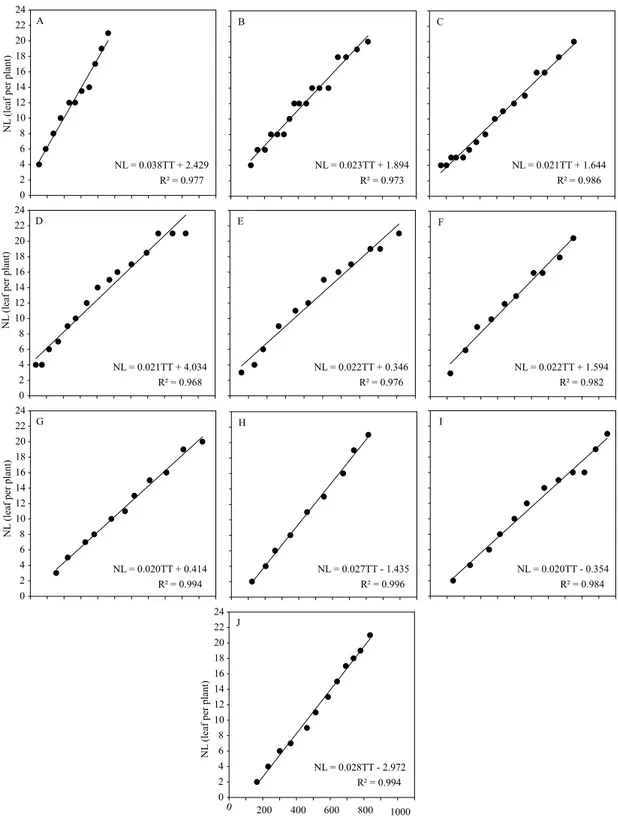
The variance analysis for phyllochron showed a significant effect of both sources of variation (p≤0.05), without a significant interaction (p=0.0940). The phyllochron mean values were 62.95±15.15°C day per leaf, in C. citriodora, and 46.03±10.89°C day per leaf in E. urophylla. Therefore, C. citriodora demands greater energy accumulation for the emission of a leaf in the main stem, in comparison to E. urophylla. This result may have occurred due to the lower Tb value obtained for C. citriodora (8.7ºC), which resulted in a higher thermal accumulation for the species at the same air temperature.
In the field, E. urophylla showed a greater leaf development, higher emergence speed, better seedling uniformity, and faster leaf emission than C. citriodora. Different phyllochron values were reported for other eucalyptus species, such as E. grandis (32.0°C day per leaf) and E. saligna (30.7°C day per leaf) (Martins et al., 2007), for the olive cultivars Arbequina (21.7°C day per leaf) and MGS ASC315 (41.6°C day per leaf) (Martins et al., 2012), as well as for annual crops such as watermelon (23.4°C day per node) (Lucas et al., 2012) and eggplant (24.7°C day per leaf) (Maldaner et al., 2009).
Figure 2. Relationship between the number of accumulated leaves in the main stem (NL) and the accumulated thermal time from the emergence (ATT), used for the phyllochron estimation of Corymbia citriodora seedlings, in the following sowing
Figure 3. Relationship between the number of accumulated leaves in the main stem (NL) and the accumulated thermal time (TT) from the emergence used for the phyllochron estimation of Eucalyptus urophylla seedlings, in the following
under the temperature and meteorological conditions observed during E1. Thus, the optimum temperature was 17.1ºC, determined by the arithmetic mean of the average temperatures for the sowing date with the greatest vegetative development (Lisboa et al., 2012), for both species. These values are biologically realistic and resemble those found for photosynthesis (10.0 to 15.0°C) and growth (16.0ºC) of E. globulus (Battaglia et al., 1996; Almeida & Sands, 2016) and P. ponderosa (20.0ºC) (Landsberg et al., 2003) and, also, for the olive cultivars Arbequina (16.1ºC) and MGS ASC315 (14.7ºC) (Lisboa et al., 2012).
Information on the estimation of cardinal temperatures for the seedling phase of forest species is scarce. Nonetheless, such information is very useful to know the most adapted species to the climatic conditions of cultivation (Martins et al., 2012; Souza & Martins, 2014), as well as to provide planning, management, and crop treatments in field conditions. In addition, these values are constantly used in air temperature functions which make part of development and production models (Soltani & Sinclair, 2012; Martins et al., 2014; Almeida & Sands, 2016).
Conclusions
1. The cardinal temperatures for leaf development of Corymbia citriodora in the seedling phase are 8.7, 17.1, and 41.3°C, for the base, optimum, and maximum temperatures, respectively; and for Eucalyptus urophylla, these temperatures are 11.5, 17.1, and 40.5°C, respectively.
2. The average phyllochron of C. citriodora is 62.95°C day per leaf, and for E. urophylla it is 46.03°C day per leaf.
Acknowledgments
To Coordenação de Aperfeiçoamento de Pessoal de Nível Superior (Capes, process No. 1115820), for the scholarship granted.
References
ABREU, M.C.; MARTINS, F.B.; FREITAS, C.H. de; PEREIRA,
R.A. de A.; MELLONI, E.G.P. Valores limítrofes para transpiração, desenvolvimento e crescimento de Corymbia citriodora (Hook.)
K.D. Hill & L.A.S. Johnson em resposta à deficiência hídrica no
solo. Revista Árvore, v.39, p.841-852, 2015. DOI: 10.1590/0100-67622015000500007.
ALMEIDA, A.C.; SANDS, P.J. Improving the ability of 3-PG
to model the water balance of forest plantations in contrasting environments. Ecohydrology, v.9, p.610-630, 2016. DOI: 10.1002/ eco.1661.
BATTAGLIA, M.; BEADLE, C.; LOUGHHEAD, S.
Photosynthetic temperature responses on Eucalyptus globulus and Eucalyptus nitens. Tree Physiology, v.16, p.81-89, 1996. DOI: 10.1093/treephys/16.1-2.81.
CALLEJAS, I.J.A.; NEVES, G.A.R.; TAVARES, A. da S.;
MOURA, I.B. de; LIMA, E.A. de. Determinação das temperaturas
cardinais da manga cultivar Roxa através de simulação computacional utilizando um modelo não linear. Ambiência, v.10, p.97-110, 2014. DOI: 10.5935/ambiencia.2014.01.08.
CHIANG, J.-M.; BROWN, K.J. Improving the budburst
phenology subroutine in the forest carbon model PnET.
Ecological Modelling, v.205, p.515-526, 2007. DOI: 10.1016/j. ecolmodel.2007.03.013.
ERPEN, L.; STRECK, N.A.; UHLMANN, L.O.; LANGNER, J.A.; WINCK, J.E.M.; GABRIEL, L.F. Estimativa das temperaturas
cardinais e modelagem do desenvolvimento vegetativo em batata-doce.Revista Brasileira de Engenharia Agrícola e Ambiental, v.17, p.1230-1238, 2013. DOI: 10.1590/S1415-43662013001100015.
FERREIRA, D.F. Sisvar: a computer statistical analysis system.
Ciência e Agrotecnologia, v.35, p.1039-1042, 2011. DOI: 10.1590/ S1413-70542011000600001.
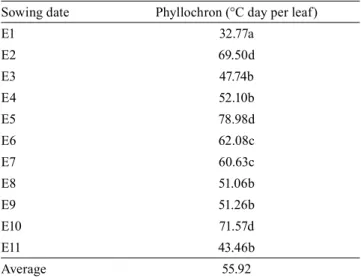
Table 3. Mean values for phyllochron (°C day per leaf) for the eleven sowing dates of Corymbia citriodora and Eucalyptus urophylla(1).
Sowing date Phyllochron (°C day per leaf)
E1 32.77a
E2 69.50d
E3 47.74b
E4 52.10b
E5 78.98d
E6 62.08c
E7 60.63c
E8 51.06b
E9 51.26b
E10 71.57d
E11 43.46b
Average 55.92
(1)Means followed by equal letters do not differ by the Tukey’s test, at 5%
LAGO, I.; STRECK, N.A.; CARVALHO, M.P. de; FAGUNDES, L.K.; DE PAULA, G.M.; LOPES, S.J. Estimativa da temperatura base do subperíodo emergência – diferenciação da panícula em arroz cultivado e arroz vermelho. Revista Ceres, v.56, p.288-295, 2009.
LANDSBERG, J.J.; WARING, R.H.; COOPS, N.C. Performance
of the forest productivity model 3-PG applied to a wide range of forest types. Forest Ecology and Management, v.172, p.199-214, 2003. DOI: 10.1016/S0378-1127(01)00804-0.
LIMA, E.P.; SILVA, E.L. da. Temperatura base, coeficientes de cultura e graus-dia para cafeeiro arábica em fase de implantação.
Revista Brasileira de Engenharia Agrícola e Ambiental, v.12, p.266-273, 2008. DOI: 10.1590/S1415-43662008000300007.
LISBOA, P.M.M.; MARTINS, F.B.; ALVARENGA, M.I.N.; VIEIRA NETO, J.; REIS, D. da F. Desenvolvimento vegetativo de
duas cultivares de oliveira na fase de muda. Ciência Rural, v.42, p.1556-1562, 2012. DOI: 10.1590/S0103-84782012000900007.
LUCAS, D.D.P.; STRECK, N.A.; BORTOLUZZI, M.P.;
TRENTIN, R.; MALDANER, I.C. Temperatura base para emissão de nós e plastocrono de plantas de melancia. Revista Ciência Agronômica, v.42, p.288-292, 2012. DOI: 10.1590/ S1806-66902012000200011.
LUZ, G.L. da; MEDEIROS, S.L.P.; TOMM, G.O.; BIALOZOR,
A.; AMARAL, A.D. do; PIVOTO, D. Temperatura base inferior e ciclo de híbridos de canola. Ciência Rural, v.42, p. 1549-1555, 2012. DOI: 10.1590/S0103-84782012000900006.
MALDANER, I.C.; GUSE, F.I.; STRECK, N.A.; HELDWEIN, A.B.; LUCAS, D.D.P.; LOOSE, L.H. Filocrono, área foliar e produtividade de frutos de berinjela conduzidas com uma e duas hastes por planta em estufa plástica. Ciência Rural, v.39, p.671-677, 2009. DOI: 10.1590/S0103-84782009005000013.
MARTINS, F.B.; PEREIRA, R.A. de A.; PINHEIRO, M.V.M.;
ABREU, M.C. Desenvolvimento foliar em duas cultivares de oliveira estimado por duas categorias de modelos. Revista Brasileira de Meteorologia, v.29, p.505-514, 2014. DOI: 10.1590/0102-778620140020.
MARTINS, F.B.; REIS, D. da F.; PINHEIRO, M.V.M. Temperatura base e filocrono em duas cultivares de oliveira. Ciência Rural, v.43, p.1975-1981, 2012. DOI: 10.1590/S0103-84782012001100011.
MARTINS, F.B.; SILVA, J.C. da; STRECK, N.A. Estimativa da temperatura-base para emissão de folhas e do filocrono em duas
espécies de eucalipto na fase de muda. Revista Árvore, v.31, p.373-381, 2007. DOI: 10.1590/S0100-67622007000300002.
MARTINS, F.B.; STRECK, N.A. Aparecimento de folhas
em mudas de eucalipto estimado por dois modelos. Pesquisa Agropecuária Brasileira, v.42, p.1091-1100, 2007. DOI: 10.1590/ S0100-204X2007000800005.
MATOS, V.A.T. de; PIVETTA, F.; SOBRINHO, S. de P.; TISSIANI, A.S. de O.; PEREIRA, A.P.M.S.; RAMOS, F.T.; CAMPELO JÚNIOR, J.H. Temperaturas basais e exigência
térmica para a maturação de caju. Bioscence Journal, v.30, p.969-977, 2014.
MÜLLER, L.; MANFRON, P.A.; MEDEIROS, S.L.P.; STRECK,
N.A.; MITTELMMAN, A.; DOURADO NETO, D.; BANDEIRA,
A.H.; MORAIS, K.P. Temperatura base inferior e estacionalidade de produção de genótipos diploides e tetraploides de azevém.
Ciência Rural, v.39, p.1343-1348, 2009. DOI: 10.1590/S0103-84782009005000098.
PATON, D.M. Eucalyptus physiology. II. Temperature responses.
Australian Journal of Botany, v.28, p.555-566, 1980. DOI: 10.1071/BT9800555.
RIBEIRO, A.C.; GUIMARÃES, P.T.G.; ALVAREZ V., V.H. (Ed.).
Recomendações para o uso de corretivos e fertilizantes em Minas Gerais: 5ª aproximação. Viçosa: Comissão de Fertilidade
do Solo do Estado de Minas Gerais, 1999. 359p.
ROSA, H.T.; WALTER, L.C.; STRECK, N.A.; ALBERTO, C.M.
Métodos de soma térmica e datas de semeadura na determinação
de filocrono de cultivares de trigo. Pesquisa Agropecuária Brasileira, v.44, p.1374-1382, 2009. DOI: 10.1590/S0100-204X2009001100002.
SANDS, P.J.; LANDSBERG, J.J. Parameterisation of 3-PG for
plantation grown Eucalyptus globulus. Forest Ecology and Management, v.163, p.273-292, 2002. DOI: 10.1016/S0378-1127(01)00586-2.
SANTOS, H.G. dos; JACOMINE, P.K.T.; ANJOS, L.H.C. dos; OLIVEIRA, V.A. de; LUMBRERAS, J.F.; COELHO, M.R.; ALMEIDA, J.A. de; CUNHA, T.J.F.; OLIVEIRA, J.B. de.
Sistema brasileiro de classificação de solos. 3.ed. rev. e ampl. Brasília: Embrapa, 2013. 353p.
SINCLAIR, T.R.; GILBERT, R.A.; PERDOMO, R.E.; SHINE JUNIOR, J.M.; POWELL, G.; MONTES, G. Sugarcane leaf area development under field conditions in Florida, USA. Field Crops Research, v.88, p.171-178, 2004. DOI: 10.1016/j.fcr.2003.12.005. SOLTANI, A.; SINCLAIR, T.R. Modeling physiology of crop development, growth and yield. Oxfordshire: CAB
Internacional, 2012. 322p. DOI: 10.1079/9781845939700.0000.
SOUZA, P.M.B. de; MARTINS, F.B. Estimativa da temperatura
basal inferior para as cultivares de oliveira Grappolo e Maria da fé. Revista Brasileira de Meteorologia, v.29, p.307-313, 2014. DOI: 10.1590/S0102-77862014000200013.
STRECK, N.A.; LAGO, I.; OLIVEIRA, F.B.; HELDWEIN,
A.B.; DE AVILA, L.A.; BOSCO, L.C. Modeling the development of cultivated rice and weedy red rice. American Society of Agricultural and Biological Engineers, v.54, p.371-384, 2011. DOI: 10.13031/2013.36234.
YANG, S.; LOGAN, J.; COFFEY, D.L. Mathematical formulae
for calculating the base temperature for growing degree days.
Agricultural and Forest Meteorology, v.74, p.61-74, 1995. DOI: 10.1016/0168-1923(94)02185-M.