Transpiration, leaf diffusive conductance, and atmospheric
water demand relationship in an irrigated acid lime orchard
Luiz Roberto Angelocci1, Fábio Ricardo Marin2, Ricardo Ferraz de Oliveira3 and Evandro Zanini Righi4
1Departamento de Ciências Exatas, E.S.A. “Luiz de Queiroz”, Universidade de São Paulo, CEP 13418-900, Piracicaba, SP, Brasil; 2Empresa
Brasileira de Pesquisa Agropecuária, EMBRAPA/CNPM, Campinas, SP, Brasil; 3Departamento de Ciências Biológicas, E.S.A. “Luiz de
Queiroz”, Universidade de São Paulo, Piracicaba, SP, Brasil. 4Curso de Pós-graduação em Física do Ambiente Agrícola, E.S.A. ”Luiz de
Queiroz”, Universidade de São Paulo.*Corresponding author: [email protected]
Received: 02/05/2003, Accepted: 09/02/2004
Leaf vapor diffusive conductance (gl) and transpiration (T) measurements in an irrigated orchard of the acid lime “Tahiti” were carried out in a subtropical climatic condition in the State of São Paulo, Brazil. Measurements were made using steady-state null-balance porometers and were taken throughout the day, on several occasions from February to November, 1998. During September and October, measurements were performed on exposed and shaded young and fully expanded leaves, as well as on old leaves inside the tree canopy. The old leaves showed lower values of gl and T when compared to the other groups. In the other months, measurements were taken only with exposed and shaded fully expanded leaves. The highest values of gl and T were obtained from February to April. For exposed leaves gl was higher from early morning to midday, decreasing thereafter with some oscillation in the afternoon. Shaded leaves produced a pattern of increasing gl and T from 8:00-9:00 a.m. to midday, followed by a decrease when values matched those of the exposed leaves in the afternoon. In April, the first measurement in midmorning showed low gl and T values, increasing sharply in the exposed leaves until midday and then decreasing until the end of the afternoon. Between May and November, gl and T decreased sharply compared to the previous months. Boundary line and regression analysis were used to find the mathematical relationships between mean values of gl for the tree and photosynthetic photons flux density, temperature, and vapor pressure deficit of the air measured in the orchard. Based on this analysis, the reasons for the gl and T diurnal and annual variation patterns are discussed, with emphasis on the effects of atmospheric variables upon stomatal regulation.
Keywords: air temperature,photosynthetic photon flux density, porometry, stomata, vapor pressure deficit.
Relações da transpiração e da condutância foliar à difusão de vapor com demanda hídrica da atmosfera em lima ácida irrigada: Realizaram-se determinações de condutância foliar à difusão de vapor (gl) e de transpiração (T) em plantas de lima ácida ‘Tahiti’ com o uso de porômetros de equilíbrio dinâmico e balanço nulo, em pomar irrigado em Piracicaba, SP. O clima da região é do tipo subtropical. Efetuaram-se as medidas ao longo do período diurno, em vários dias entre fevereiro e novembro de 1998, e, em setembro e outubro, em folhas em expansão e naquelas totalmente expandidas, tanto ao sol quanto à sombra, bem como em folhas de lançamentos antigos, no interior da copa. As folhas mais antigas apresentaram valores menores de gl e de T em relação aos outros grupos. Nos outros meses, as medidas foram feitas somente em folhas plenamente expandidas ao sol e à sombra. Os maiores valores de gl e T foram observados de fevereiro a abril. Para folhas ao sol, os valores de gl foram altos desde 8-9h até o meio-dia, decrescendo gradualmente à tarde, com oscilações. Para as folhas à sombra, a variação de gl ao longo do dia apresentou crescente aumento desde a primeira medida até o meio-dia, chegando a valores próximos daqueles obtidos nas folhas ao sol e diminuindo à tarde. Em abril, a primeira medida realizada às 9 h mostrou baixos valores de gl e de T para as folhas ao sol e à sombra, sendo crescentes para aquelas ao sol até o meio-dia, com decréscimo à tarde. De maio a novembro, houve uma diminuição acentuada de gl e de T em relação aos meses anteriores. Realizaram-se análises de regressão para estabelecer relações matemáticas entre os valores médios de gl e de densidade de fluxo de fótons fotossinteticamente ativos, temperatura e déficit de pressão de vapor do ar. Com base nessas análises, discutem-se as causas de ocorrência dos padrões de variação de gl e de T observados ao longo do dia e do período experimental, discutindo-se o efeito de cada variável ambiental sobre a resposta estomática.
INTRODUCTION
Citrus species are extensively cultivated in tropical and subtropical regions around the world. They are adapted to several environmental conditions, including the semi-arid regions, with the use of irrigation. When compared to other crops, citrus species tend to have smaller transpiration rates per unit of leaf area, showing a significantly higher canopy resistance to vapor diffusion, mainly due to the high stomatal and cuticular resistances (Hall et al., 1975).
Several environmental factors such as solar irradiance,
air temperature and humidity, partial pressure of CO2 in the
air, wind speed, and plant factors, such as CO2 assimilation
rate, growth regulators and plant water status, are associated with the regulatory role of stomata. The stomatal responses to environmental variables are extremely complex (Lloyd, 1991) and quantification of the effects of every factor affecting them is difficult to estimate under field experimental conditions (Jones, 1994; Syvertsen and Lloyd, 1994).
Under controlled conditions, conductance to vapor diffusion of citrus decreases when the leaf-to-air water vapor pressure gradient (VPG) increases (Hall et al., 1975; Khairi
and Hall, 1976). Continued daily exposure of Citrus sinensis
seedlings to a range of humidity differences between leaf and air leads to a tendency for acclimation of leaves, by which the total leaf diffusion becomes less sensitive, but still responsive, to VPG (Hall et al., 1975). At high soil water potential in a mature citrus orchard Cohen and Cohen (1983) observed a decrease of the hourly midday conductance with the increase of VPG.
Under field conditions of high air temperature (Tair) and
vapor pressure deficit (VPD), a sharp decrease in CO2
exchange was observed at midday in mature trees of citrus species, whereas the transpiration rates remained stable with the increased VPD (Sinclair and Allen, 1982). Relatively constant transpiration rates under several values of leaf–air
vapor gradients were observed in sweet orange–seedlings
(Hall et al., 1975) and in C. lemon (Levy, 1980), due to
stomatal control. Under high soil water content, grapefruit is able to maintain transpiration at a relatively high level even when the conductance values drop to the range of 0.5 to 2.0
mm.s-1, due to the effect of the atmospheric evaporative
demand on transpiration, but under low soil water content, the latter process is reduced due to the drop of the gl values to below that range of values or even to zero.
According to Syvertsen and Lloyd (1994) the stomata closure occurring during the increase of the leaf-air vapor pressure deficit represents an evolutionary adaptation of citrus species to conserve water. This occurs because they originated
in the humid tropical regions, whereas now they are adapted to diverse climates, including the semi-arid.
Since leaf diffusive conductance is strongly dependent on the VPG, which depends on the air and leaf temperatures, as well as on the VPD, the direct effect of temperature on gl is less evident. Kriedmann and Barrs (1981) stated that leaf temperature
ranging from 20oC to 41oC has little or no effect on citrus stomatal
conductance. According to Syvertsen and Lloyd (1994), it is improbable that the relative lack of citrus stomatal response to
temperature extends beyond the range from 20oC to 35o C, in
view of the results of Vu and Yelenosky (1987) and Lloyd and
Howie (1989) with C.sinensis when working in temperatures
lower than 20oC.It is not known whether this gl decrease is
directly related to the stomata response to temperature or if it is a consequence of the decreased root water conductivity followed by the drop in soil temperature.
Values of glin citrus increase with the photosynthetic
photon flux density (PPFD), tending to attain saturation at a determined value. For grapefruit plants cultivated in the glasshouse and in field conditions, the value of PPFD which
approaches saturation was around 500 µmol.m-2.s-1 (Syvertsen
and Lloyd, 1994).
Kriedemann and Barrs (1981) stated that little attention has been given to the influence of seasonal changes in citrus water relations. In Australia, Lloyd and Howie (1989) analyzed daily patterns of gl changes in citrus and their seasonal relations with salinity of the irrigation water, leaf temperature, PPFD and water vapor deficit pressure between air and leaf. These authors observed similar daily patterns for gl changes in the late spring, summer and fall, but different from those found in the winter.
Aiming to contribute towards a better understanding of the citrus response to environmental variables, in this paper we analyze the diurnal variation of the leaf vapor diffusive
conductance and transpirationmeasured in an irrigated
orchard of acid lime trees on several occasions throughout the year, showing the relationships between leaf vapor diffusive condutance and the following variables: air temperature (Tair), air vapor pressure deficit (VPD) and photosynthetic photon flux density (PPFD).
MATERIAL AND METHODS
The field experiment was carried out from February to November, 1998, using two six-year-old plants of the acid lime ‘Tahiti’ grafted onto lemon ‘Cravo’ in an orchard at the Experimental Farm of the Campus “Luiz de Queiroz” of the University of São Paulo, in Piracicaba, State of São Paulo,
The study was part of a project on maximum transpiration modeling based on micrometeorological and plant growth variables. To minimize the water deficit effects on the gas exchange, the orchard was irrigated by micro-sprinklers, even during periods when irrigation is not normally used in commercial orchards.
Leaf conductance to water vapor and transpiration rate were determined using two steady-state null balance porometers (Model Li-1600, Li-Cor, Lincoln, NE, USA). The humidity sensors of the porometers were calibrated in February and August, 1998, following the manufacturer’s instructions.
Until August, the measurements were carried out on one
tree with a leaf area of 39.6 m2 (measured in February). From
September to November, due to the fact that this first tree had been pruned, measurements were performed on a second
tree with 52.6 m2 leaf area. Each T and gl measurement series
took about 15-20 min. For this purpose, the tree canopy was divided in three layers (superior, medium and inferior) and 10 leaves per layer were sampled, totalizing 30 leaves.
Measurements from February to August were carried out
with both fully expanded sunlit (PPFD > 150 µmol.m-2.s-1)
and shaded leaves (PPFD ≤ 150 µmol.m-2.s-1). The number
of leaves sampled in each class (exposed and shaded) was taken approximately in proportion to the distribution of the two classes found in each tree. The distribution of the leaves in each class was determined by a visual and subjective inspection for each measurement. From September to November, the sampling was performed by taking 12 fully expanded and 12 not yet fully expanded leaves, half of them exposed and half shaded, as well as 6 leaves inside the tree canopy, totalizing 30 leaves per sample.
The soil water matric potential was determined twice a week close to the tree, used in the first semester, using tensiometers installed at 10 cm-intervals, from 10 cm to 80 cm from the soil surface, and at distances of 40, 80, 120, and 160 cm from the trunk. At the distance of 200 cm from the trunk, four tensiometers were installed (at depths of 10, 20, 30, and 40 cm) and at 240, 280, and 320 cm away from trunk two tensiometers were installed at depths of 10 and 20 cm. Water potential readings of the tensiometers were carried out by a digital tensiometer.
From late August to November water status of the second plant was also measured considering the leaf water potential obtained with a pressure chamber throughout daytime, twice a week. In each measurement, six leaves from each tree were sampled, one an exposed leaf and one shaded, taken from each of the three canopy layers. To minimize errors caused by water loss during measurements, each leaf was placed inside a small plastic bag just before cutting, where it remained until the end of the measurement.
The orchard micro-meteorological variables were measured with an automatic weather station connected to a CR10X datalogger (Campbell Scientific, Logan, Utah). Data were measured every second and averaged over 15 min intervals. These data were compared to porometric data obtained for the same interval. The environmental variables used were the PPFD, measured at 4.5 m above the ground, together with air temperature and air vapor pressure deficit measured at 2 m above the ground (VPD).
Boundary line and regression analyses were used in order to obtain the relationships between the leaf diffusive conductance and the environmental variables.
RESULTS AND DISCUSSION
Orchard environmental conditions during the experiment:
Since the orchard was irrigated, water deficit indicators showed that the plants were well supplied with water on the
days of measurement. However, on September 18th a relatively
low soil water matric potential (-0.0859 MPa) was observed at a soil depth of 85 cm in the crown projection on the ground, whereas in the upper layers of soil (surface down to 40 cm-depth) the water potential was slightly higher, with a minimum
of -0.0682 MPa. On November 15th, the soil matric potential
at 50 cm depth and 80 cm from the trunk was -0.0849 MPa, but the minimum leaf water potential on this day was -1.12 MPa. The lowest leaf water potential observed in the measurement series was -1.30 MPa (data not shown).
Lloyd (1994) concluded that under good conditions of soil water availability to the roots, leaf water potential does not modulate citrus stomata behavior.
With regard to air temperature, this was very high on
February 23th, reaching 33oC in the afternoon, and decreased
until June, when the maximum temperature reached 23oC. In
August, temperatures started to increase again, reaching
values higher than 30oC (on August 17 th) and remaining high
until November (figure 1).
Daily air VPD patterns showed the occurrence of increasing values in the morning, generally remaining low
until 10a.m., and reaching the maximum around 2 p.m.
Excluding May 6th and June 12th, when the VPD was relatively
low (below 10 hPa) throughout the daytime, and March 27th,
when it attained 15 hPa, on other days the maximum values
were high. On August 17th, September 18th and November
15th the afternoon values were very high, specially on August
17th, when it exceeded 30 hPa.
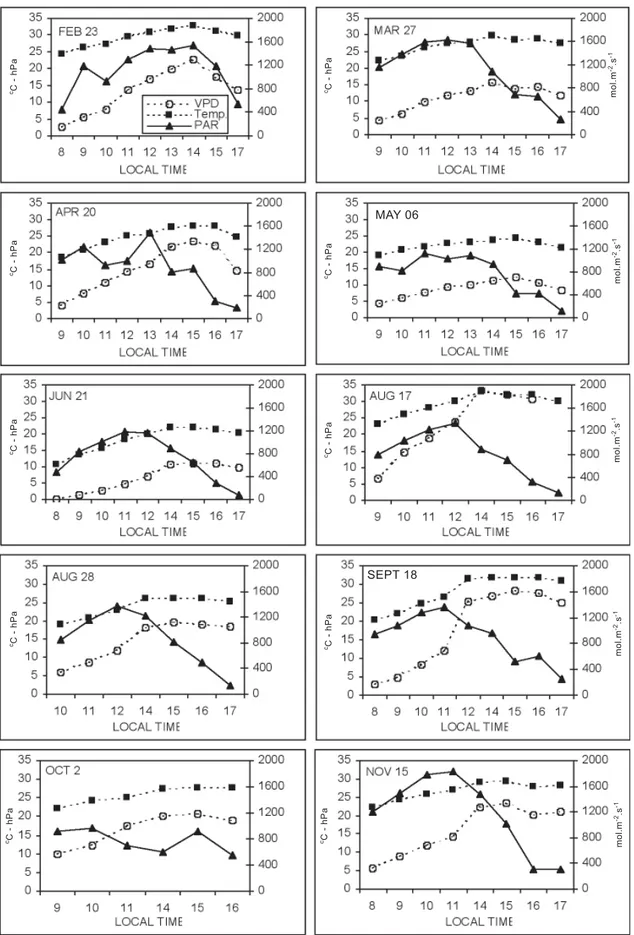
Figure 1 shows the large daily and seasonal PPFD variability. Maximum daily values ranged from 800 to1800 µmol.m-2.s-1. These values are expected, because they were
observed from February to November, at a location situated near the tropic of Capricorn, where maxima values of PPFD
of about 2200-2300 µmol.m-2.s-1 occur in December-January,
on days with clear skies.
Transpiration and leaf diffusive conductance variability:
Considering the non-uniform procedures of sampling for the porometric measurements along the year, it is interesting to discuss the values of gl and T observed in September and October, when very detailed sampling was performed. The irradiance at the old leaves inside the canopy proved to be
very low (below 30 µmol.m-2.s-1), whereas at the exposed
leaves PPFD values attained more than 500 µmol.m-2.s-1 and
at the shaded leaves located more externally in the canopy
the values were lower than 150 µmol.m-2.s-1.
Figure 2 shows mean values of gl and T throughout the daytime period for those two months. In order to simplify this figure, the standard deviation of the means was omitted, but it was generally high, with a predominance of coefficients of variation around 40-50% and sometimes reaching more than 100%, independent of the leaf condition.
On average, gl and T of the old leaves inside the tree canopy were smaller than those of more recent flushes, even those under low PPFD values (shaded leaves). Except for the
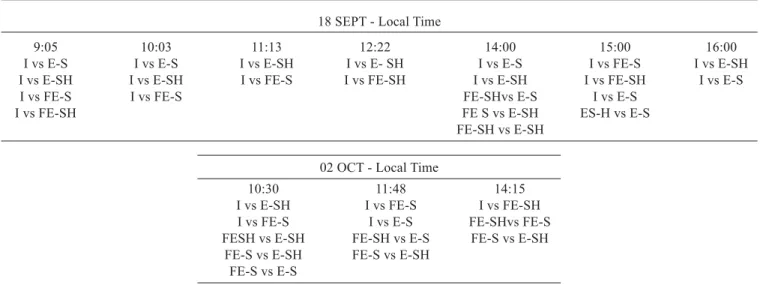
last measurement on September 18th, significant statistical
differences by the t-test at the 5% probability level were detected among older leaves (inside leaves) and the other two
classes (table 1). On October 2nd, statistical differences of gl
among older leaves inside the canopy and the other groups of leaves were observed between 10 a.m. and 3 p.m.. On
November 15th, under higher water atmospheric demand and
PPFD in relation to September 18th and February 23th, the
difference between the inside and the shaded leaves occurred
around noon. For ‘Valencia’ orange trees grafted on Citrus
jambhiri, growing in Florida, Syvertsen (1982) found smaller gl values for leaves of old flushes in the winter compared to those of the spring-summer flushes. He ascribed the differences to the senescence of the leaves.
For September 18th and October 2nd
, it is difficult to
distinguish differential patterns of gl and T variation between leaves (fully expanded or not) from more recent flushes, in both conditions of exposure (sunlit or shaded), because of the low
values of gl and T (maximum of about 3 mm.s-1 and 5 µg.cm-2.s-1,
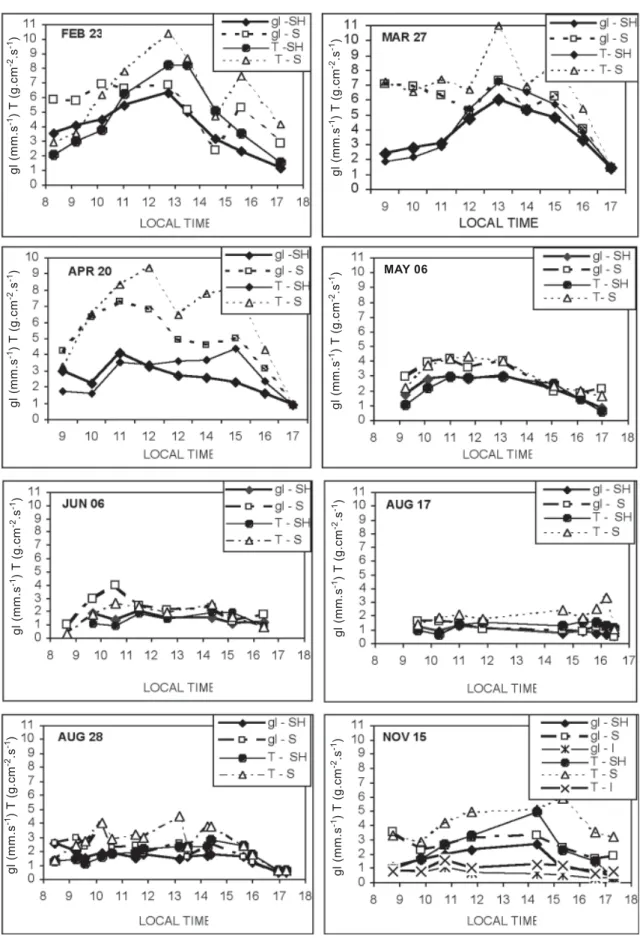
respectively) were conditioned primarily by high VPD. Figure 3 shows patterns of hourly variation of gl and T observed throughout the experimental period. In February and March (late summer-early fall) a pattern of increasing values of both variables for the shaded leaves is observed from the
morning, attaining a maximum (7-8 mm.s-1) at midday,
followed by a pattern of decreasing values in the afternoon. For the sunlit leaves, gl showed a pattern of steady values from the morning to midday, followed by a slight oscillation pattern up to 3:00–3:30 p.m. and a decrease afterwards, whereas the transpiration curve shows a pattern of increasing
values from morning to midday on February 23th and a steady
pattern in the morning to a sharp increase at midday. On both days, T shows an oscillation pattern of values from midday to 3:00-4:00 p.m. and a sharp decrease afterwards. On April
20th the patterns of gl and T for sunlit leaves were not very
different from the previous two days, except for the lower value of gl in the early morning. On this day, shaded leaves showed a decline of gl around noon and a tendency of increasing values in the mid-afternoon.
From May to November the maximum daily values of gl and T experienced a sharp decrease, not attaining more than
4.0 mm.s-1 and 5.0 µg.cm-2.s-1, respectively. The differences
between values of sunlit and shaded leaves became more subtle, mainly in August.
Figure 1. Diurnal variation of photosynthetic photon flux density, air temperature and air vapor pressure deficit in the orchard, during one day of each month of the experiment, measured by an automatic micro-meteorological station.
cC
-
h
Pa
cC
-
h
Pa
cC
-
h
Pa
cC
-
h
Pa
cC
-
h
Pa
mo
l.
m
-2.s
-1
cC
-
h
Pa
cC
-
h
Pa
cC
-
h
Pa
cC
-
h
Pa
cC
-
h
Pa
mo
l.
m
-2.s
-1
mo
l.
m
-2.s
-1
mo
l.
m
-2.s
-1
mo
l.
m
-2.s
-1
MAY 06
Table 1. Significant contrasts, by the t-test (p<0.05), of the mean values of gl for leaves under different sunlight exposition and maturation degree conditions, at several times of day. E-S: sunlit, not yet fully expanded leaves; E-SH: shaded, not yet fully expanded leaves; FE-S: sunlit, fully expanded leaves; FE-SH: shaded, fully expanded leaves; I: inside leaves in the canopy.
Figure 2. Variation of the diurnal leaf vapor diffusive conductance (gl) and transpiration (T) of fully expanded (FE), not fully expanded (E), sunligt (S) and shaded (SH) leaves, and leaves inside the canopy from older flushes (I), during September and October, 1998.
18 SEPT - Local Time
9:05 10:03 11:13 12:22 14:00 15:00 16:00
I vs E-S I vs E-S I vs E-SH I vs E- SH I vs E-S I vs FE-S I vs E-SH I vs E-SH I vs E-SH I vs FE-S I vs FE-SH I vs E-SH I vs FE-SH I vs E-S
I vs FE-S I vs FE-S FE-SHvs E-S I vs E-S
I vs FE-SH FE S vs E-SH ES-H vs E-S
FE-SH vs E-SH
02 OCT - Local Time
10:30 11:48 14:15
I vs E-SH I vs FE-S I vs FE-SH I vs FE-S I vs E-S FE-SHvs FE-S FESH vs E-SH FE-SH vs E-S FE-S vs E-SH
FE-S vs E-SH FE-S vs E-SH FE-S vs E-S
g
l
(mm.
s
-1)
T
(g
.cm
-2.s -1)
g
l
(mm.
s
-1)
T
(g
.cm
Figure 3. Variation of the diurnal leaf vapor diffusive conductance (gl) and transpiration rate (T), for different leaves classes during several days of the experimental period.
g
l
(mm.
s
-1)
T
(g
.cm
-2.s -1)
g
l
(mm.
s
-1)
T
(g
.cm
-2.s -1)
g
l
(mm.
s
-1)
T
(g
.cm
-2.s -1)
g
l
(mm.
s
-1)
T
(g
.cm
-2.s -1)
g
l
(mm.
s
-1)
T
(g
.cm
-2.s -1)
g
l
(mm.
s
-1)
T
(g
.cm
-2.s -1)
g
l
(mm.
s
-1)
T
(g
.cm
-2.s -1)
g
l
(mm.
s
-1)
T
(g
.cm
-2.s -1)
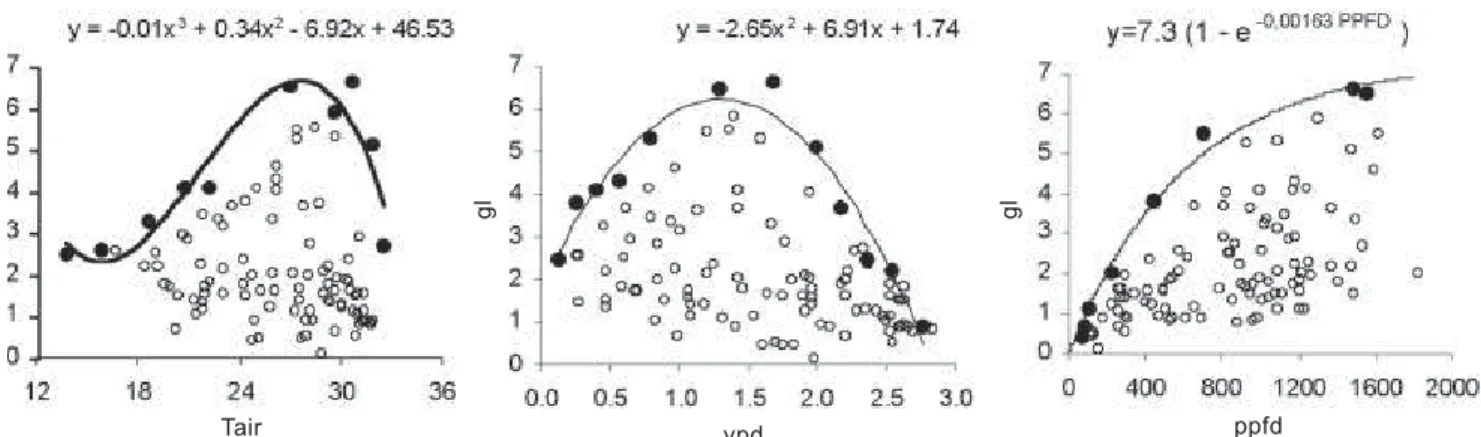
represent the upper limit of the scattering in the diagrams and to indicate the hypothetical response of each independent variable when the other independent ones are not limiting (Jarvis, 1976; Jones, 1994). The boundary lines were determined by regression analysis using the maximum gl values in the dispersion plots with VPD, Tair and PPFD.
The best fit for the Tair boundary line was a third degree polynomial equation rather than a theoretically expected second degree equation. The data points with temperatures
less than 18oC explains the selected equation. An optimum
air temperature of 27.6oC leading to the maximum gl for acid
lime under the experimental conditions is derived from the fitted equation. The best fit of gl in relation to PPFD was the exponential equation presented in figure 4. The selected equation follows Jones (1994), who cited it as being the most useful function to describe stomatal response to PPFD. Functions for VPD and Tair suggested by the same author could not be fitted to data set used here.
However, to obtain a consistent functional relationship between gl and a particular environmental variable, one must go beyond the boundary lines analysis, making studies under constant values of the other independent variables. Although studies are more easily carried out in controlled environments rather than in the field, as exemplified and discussed by Syvertsen and Lloyd (1994) for citrus species. In the present study the measurements were carried out under field conditions. With the aim of explaining stomatal and plant transpiration responses throughout the year, mathematical functions were fitted to the data, to find consistent relations between gl and each variable.
The imense range of the data set imposes some degree of variability in the analysis. Besides the common leaf-to-leaf variability of gl found in the field, one should consider that
variables such as CO2 partial pressures in the ambient air and
stomatal cavity have an important role in the stomatal aperture (Syvertsen and Lloyd, 1994), but this effect was not considered in the present analysis. Additionally, the most appropriate variables in this analysis should be leaf irradiance, leaf to air vapor pressure gradient and leaf temperature, but they were replaced by the PPFD measured in a horizontal plane above the crop, the air temperature and air VPD, variables that are easier to determine. Furthermore, the relationships were established with mean gl values and one should consider that these mean values are affected by the procedure of leaves sampling.
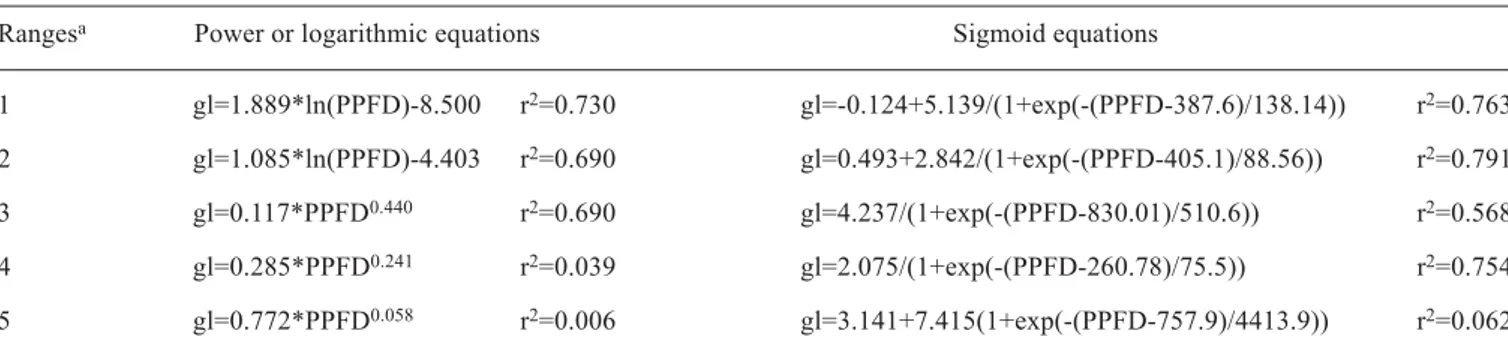
Despite these problems and the small number of points used to adjust most of curves, consistent relationships were obtained. Mathematical functions between gl and PPFD (figure 5) were determined for five ranges of Tair and VPD, namely: range
1 (25.1oC to 28.3oC; 11.8 to 16.7 hPa), range 2 (22oC to 25oC;
10.9 to 17.6 hPa), range 3 (19oC to 21.9oC; 6 to 11 hPa), range 4
(28oC to 30oC; 19.1 to 22 hPa) and range 5 (30.4oC to 32.6oC;
24.9 to 27.8 hPa). Table 2 shows the equations and the
determination coefficients (r2) for the different ranges.
The high dispersion and few available data points for all ranges of VPD and Tair make it difficult to decide on the best
mathematical function to fit the data, since r2 values are very
similar. The three functions which fitted the data well and can explain the response of the stomata to PPFD were the sigmoid, the logarithmic and the power functions (figure 5). The well-documented response of the stomatal opening to the increase of PPFD is evident, reaching saturation at a determined value. It is difficult to visualize saturation values of PPFD for the studied ranges from the logarithmic and power curves. However, the sigmoid curves for the ranges 1, 2, and 3 show a well-defined saturation zone, with values
ranging from around 400 to 800 µmol.m-2.s-1. For range 3
the sigmoid curve shows a deviation from the well-defined
Figure 4. Scatter diagrams of the measurements of leaf diffusive conductance plotted against air temperature, air vapor pressure deficit and photosynthetic photon flux density, with the hypothetical boundary line fitted for each environmental variable.
g
l
Tair vpd ppfd
g
l
g
Figure 5. Relationships between leaf conductance and photosynthetic photon flux density for five ranges of air temperature and vapor pressure deficit (the range values are in the text). Left: logarithmic and power functions; right: sigmoid equations. saturation zone indicated by the previous three ranges, mainly
for values from 200 to 700 µmol.m-2.s-1, but one should take
into account the few available points of PPFD in this range. Jones (1994) reported that the maximum stomatal aperture is
achieved with PPFD values higher than 400 µmol.m-2.s-1, but
this depends on the species and the natural radiation environment. For grapefruit, saturation is attained when PPFD
reaches around 500 µmol.m-2.s-1 (Syvertsen and Lloyd, 1994).
Figure 5 shows that this value depends on the condition of Tair and VPD.
The definition of the best relationship between gl and air temperature is complicated by the strong interaction between the latter and the air vapor pressure deficit. In order to deal with this problem, the relations were established using only gl
g
l
(mm.
s
-1 )
g
l
(mm.
s
-1)
PPFD (µmol.m-2.s-1)
PPFD (µmol.m-2.s-1)
Table 2. Regression equations for the relation between leaf diffusive conductance gl (mm.s-1) and photosynthetic photon
density flux PPDF (µmol.m-2.s-1), for different ranges of air temperature and vapor pressure deficit.
a Ranges: 1) 25.1oC to 28.3 oC and 11.8 to 16.7 hPa; 2) 22oC to 25oC and 10.9 to 17.6 hPa; 3) 19oC to 21.9oC and 6 to 11 hPa; 4) 28oC to 30oC and 19.1 to 22 hPa; 5) 30.4oC to 32.6oC and 24.9 to 27.8 hPa.
Rangesa Power or logarithmic equations Sigmoid equations
1 gl=1.889*ln(PPFD)-8.500 r2=0.730 gl=-0.124+5.139/(1+exp(-(PPFD-387.6)/138.14)) r2=0.763
2 gl=1.085*ln(PPFD)-4.403 r2=0.690 gl=0.493+2.842/(1+exp(-(PPFD-405.1)/88.56)) r2=0.791
3 gl=0.117*PPFD0.440 r2=0.690 gl=4.237/(1+exp(-(PPFD-830.01)/510.6)) r2=0.568
4 gl=0.285*PPFD0.241 r2=0.039 gl=2.075/(1+exp(-(PPFD-260.78)/75.5)) r2=0.754
5 gl=0.772*PPFD0.058 r2=0.006 gl=3.141+7.415(1+exp(-(PPFD-757.9)/4413.9)) r2=0.062
values obtained when PPFD in the orchard was higher than
800µmol.m-2.s-1. Figure 6 and table 3 show the results for six
leaf-to-air vapor pressure difference of 5mmol.m-1 and a
PPFD from 100 to 1,500 µmol.m-2.s-1. In the present work,
the variable used was air temperature rather than leaf temperature, within a less extended range to that of 10 to
40oC used by those authors. Consequently, it was not possible
to define the optimum temperature. Table 4 and figure 7 show the relationship between gl and VPD. In order to obtain consistent relations, the ranges of Tair and PPFD were reduced to a minimum permitted by the data series, but keeping the
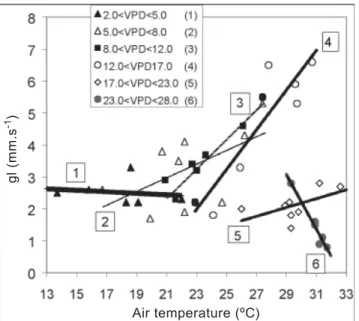
PPFD higher than 800 µmol.m-2.s-1. Except for the Tair range
from 19 to 22oC, in which almost constant values of gl were
observed, all other ranges showed a drop of gl with the increase of VPD. This response of stomata to the decrease of air temperature is well documented in citrus, mainly in terms of leaf-air vapor pressure (or concentration) difference (Hall
et al., 1975; Kahiri and Hall, 1976; Syvertsen and Lloyd, 1994). The shape of the curves normally is non-linear, as observed in the ranges 3 and 4.
The relationships observed in figures 5, 6 and 7 could be used to obtain a multiplicative model of leaf conductance, as proposed by Jarvis (1976). However, despite the large amount of data, they are not sufficient to establish consistent forms of the functions for every independent variable. Thus, despite of its high degree of empiricism, and the poor predictive value for environmental conditions others than those observed in the present study, the multiple regression approach was applied to data. Considering the complex interrelations among the three variables and the strong relation existing between Tair and VPD, the regression equations were determined by adopting narrow
ranges of air temperature (Table 3), viz.: 13 to 21oC (a); 21.1
to 23oC (b); 23.1 to 25oC (c) ; 25.1 to 27oC (d); 27.1 to 29oC
(e) ; 29.1 to 31oC (f); 31.1 to 33 oC (g).
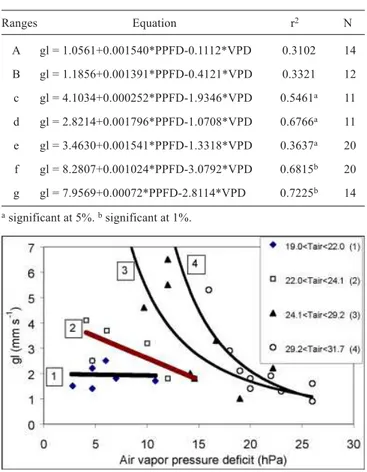
The statistical significance of the resulting equations for the ranges c, d, e, f and g denotes a causal relation of VPD and PPFD with gl, contrasting the results verified in ranges a
and b. The correlation determination coefficient (r2) rises
gradually with the increase of the air temperature, denoting a more effective control of PPFD and VPD on gl. This consideration is valid especially for VPD, which tended to
increase its influence on the stomatal regulation above 22oC
(figure 7). The reduction of the negative values of coefficients for VPD in the equations in table 3 when Tair increases is evidence of the importance of VPD in stomatal regulation under these conditions. On the other hand, PPFD showed an inverse trend, with reduction of the respective coefficients, indicating a lesser importance under conditions of high air temperatures and low absolute air humidity.
On the observed diurnal and seasonal variation of gl and T:
The relationships of gl with the studied environmental variables provide subsistence to explain diurnal and seasonal variations of gl and T observed in this study.
The gl decrease during the afternoons of February 23th
Figure 6. Relationship between leaf diffusive conductance (gl) and air temperature for six ranges of air vapor pressure deficit VPD (hPa) and photosynthetic photon flux density
above 800 µmol.m-2.s-1.
g
l
(mm.
s
-1)
Air temperature (ºC)
Table 3. Regression equations between leaf diffusive
conductance (gl, in mm.s-1) and air temperature (T, in oC)
for six ranges of air vapor pressure deficit (VPD, in hPa).
PPFD higher than 800 µmol.m-2.s-1.
Ranges Equation r2
1 (2.0<VPD<5.0) gl = 2.9331 – 0.0232 * T r2 = 0.0255 2 (5.0<VPD<8.0) gl = -1,5522 + 0.2144 * T r2 = 0.3288 3 (8.0<VPD<12.0) gl = -7.4034 + 0.4624 * T r2 = 0.8131 4 (12.0<VPD<17.0) gl = -12.3260 + 0.6222 * T r2 = 0.8142 5 (17.0<VPD<23.0) gl = -1.9715 + 0.1383 * T r2 = 0.3256 6 (23.0<VPD<28.0) gl = 27.811 – 0.8531 * T r2 = 0.9560
Table 4. Regression equations between leaf diffusive
conductance (gl, in mm.s-1) and air vapor pressure deficit
(VPD, in hPa) for four ranges of air temperature (oC).
PPFD higher than 800 µmol.m-2.s-1.
Ranges Equation r2
transpiration rate can increase as a consequence of the increased leaf to air vapor concentration. Transpiration peaks observed in the afternoon can be associated with a partial recovery (increase) of the gl values. The values of gl and T of the sunlit leaves for the period between 8:00 and 9:00 a.m. in the days of April, May and June were lower than those
observed in the same period of the day on February 23th and
March 27th. It is probable that this fact derives from the low
temperature observed over this time of day for these three
months. Tair was lower than 20oC, concurrent with the
decrease in gl. For example, it is known that soil temperature directly affects the hydraulic conductance of citrus roots, which is probably related to the increase of water viscosity and to the overall effects on root system activity, as discussed by Kriedmann and Barrs (1981), Sinclair and Allen (1982), and Syvertsen and Lloyd (1994). These processes lead to a decrease in water supply to the leaves, with regulation of stomata opening and decrease of gl and T.
In May and June T decreased sharply, with maximum values equivalent to half those of the previous months. As for PPFD, VPD and air temperature values also decreased compared to the previous months, the reduction of the atmospheric water demand explain the small T values. However, leaf conductance also decreased proportionally, so stomatal closure may also be considered a factor contributing to the transpiration drop. Considering PPFD values above the saturation level from 10:00-11:00 a.m. to 4:00 p.m. and values of VPD not exceeding 10 hPa, the decrease of gl can be explained by the low values of air temperature (mainly in June), by its effect on the roots hydraulic conductivity, or even by the overall effect of temperature on physiological
processes, such as CO2 assimilation. The water conductance
of C. jambhiri was greatly reduced when the root temperature was lower than 15°C (Ramos and Kaufmann, 1979). According to Syvertsen and Lloyd (1994), it is not clear if gl reduction is a consequence of a direct effect of temperature on the stomata response or an indirect effect of the decrease of the root hydraulic conductance, affecting the water supply to the leaves.
The measurements carried out during August and
November resulted in low values of gland T, showing small
differences between sunlit leaves and shaded ones, with a slight variation throughout the day.
In August, the reduction of gl and T was probably a consequence of the VPD effect on the stomatal response. On
August 17th, for example, PPFD values were equal or higher
than the saturation level, but high VPD (above 30 hPa) seems to be the cause of the sharp decrease of gl and T, such that there was no statistical difference between sunlit and shaded
Table 5. Multiple linear regression equations , coefficients
of determination (r2) and number of data points (N) used
in each class of air temperature.
a significant at 5%. b significant at 1%.
Ranges Equation r2 N
A gl = 1.0561+0.001540*PPFD-0.1112*VPD 0.3102 14 B gl = 1.1856+0.001391*PPFD-0.4121*VPD 0.3321 12 c gl = 4.1034+0.000252*PPFD-1.9346*VPD 0.5461a 11 d gl = 2.8214+0.001796*PPFD-1.0708*VPD 0.6766a 11 e gl = 3.4630+0.001541*PPFD-1.3318*VPD 0.3637a 20 f gl = 8.2807+0.001024*PPFD-3.0792*VPD 0.6815b 20 g gl = 7.9569+0.00072*PPFD-2.8114*VPD 0.7225b 14
Figure 7. Relationships between leaf conductance and vapor
pressure deficit for four ranges of air temperature (oC) and
photosynthetic photon flux density higher than 800 µmol.m-2.s-1.
and March 27th can be ascribed to the effect of the high VPD
(figure 1) on stomatal aperture, because the sunlit leaves, with irradiation above the saturation level, also showed a decrease. The results on both days are typical examples of the effects of VPD and air temperature overcoming the light effect on the stomatal response, because the gl values of sunlit and shaded leaves in the period of high PPFD and temperature did not show statistical differences.
leaves during most of the period. Otherwise, on August 28th
the variability of PPFD was similar to that observed on August
17th, but VPD and air temperature were lower, leading to the
increase of gl and T, sometimes with a great difference in the
glvalues between sunlit and shaded leaves. Even so, the
maximum values on August 28th remained low due to high
VPD (above 20 hPa) and low temperature in the morning.
Air temperature and VPD conditions on September 18th
can also explain the small magnitude and variation of gl and T during this day, since VPD was very high (around 30 hPa). Low Tair (below 10°C) in the early morning and high values of VPD in the afternoon may also have contributed for
maintenance of low values of gl. On October 2nd, high VPD
and low PPFD might have been limiting factors in the afternoon period, contributing to the decrease of gl and T.
In the afternoon of November 15th, VPD was sufficiently
high (around 20 hPa) to cause reduction in stomatal conductance. However, during the morning of this day, PPFD and air temperature were of the same magnitude as the data
observed during this period on March 27th, whereas gl values
on March 27th were twice as large in sunlit and shaded leaves.
Considering the values of PPFD, air temperature and VPD in the period (figure 1) and the relations of gl with the three variables (figures 5, 6 and 7), it is not possible to evaluate the causes of the low values of gl. As previously explained, this day was one with a soil matric water potential below –0.08 MPa. So, contrary to that assumed previously one cannot discard some effect of soil water deficit on stomatal response during this day.
As the soil water conditions in the orchard were maintained at an adequate level for most of the days and considering that the overall decrease in gl and T from May to October was a consequence of the effects of the air temperature and air VPD, it may be concluded that even under favorable soil water conditions during this period, gas exchange between atmosphere and plants was limited by stomata regulation, in consequence of low air humidity. Medina et al. (1999) also concluded that in the State of São Paulo, even when there is high solar irradiance and good soil water availability in the summer, low humidity conditions on some days could contribute to stomatal closure, which in turn, could cause a decrease in photosynthesis, affecting production.
Acknowledgements: The authors wish to thank Dr. Paulo César Sentelhas for the critical review of the manuscript and for the helpful suggestions. The first author thanks the Conselho Nacional de Desenvolvimento Científico e Tecnológico (CNPq), Brazil, for a fellowship.
REFERENCES
Camacho-B SE, Kauffman MR; Hall AE (1974) Leaf water potential response to transpiration by citrus. Physiol. Plant. 31:101-105.
Cohen Y (1991)Determination of orchard water requirement by a combined trunk sap flow and meteorological approach. Irrig. Sci. 12:93-98.
Cohen S, Cohen Y (1983) Field studies of leaf conductance to environmental variables in citrus. J. Appl. Ecol. 20:561-570. Cohen S, Fuchs M, Moreshet S. (1993) Estimating citrus orchard canopy resistance from measurement of actual and potential transpiration. In: Borghetti M, Grace J, Raschi A (eds.), Water Transport in Plant under Climatic Stress, pp.229-237. Cambridge University Press, Cambridge. Hall AE, Camacho-B SE, Kauffman MR (1975) Regulation
of water loss by citrus leaves. Physiol. Plant. 33:62-65. Jarvis PG (1976) The interpretation of variations in the leaf
water potential and stomatal condutance found in canopies in the field. Philosoph. Trans. Royal Soc., London B, 273:563
Jones HG (1994) Plants and microclimate: a quantitative
approach to environmental plant physiology. 2nd edn.
Cambridge University Press, Cambridge.
Kahiri, MAM, Hall AM (1976) Temperature and humidity effects on net photosynthesis and transpiration of citrus. Physiol. Plant. 36:29-34.
Kriedemann PE, Barrs HD (1981) Citrus orchards. In: Kozlowski TT (ed). Water deficits and plant growth: VI: woody plant communities, pp.325-418. Academic Press, New York.
Levi Y (1980) Effect of evaporation demand on water relations of citrus lemon. Ann. Bot. 46:695-700.
Lloyd J, Howie H (1989) Salinity, stomatal responses and whole-tree hydraulic conductivity of orchard ‘Washington
Navel’ orange,’Citrus sinensis (L.) Osbeck. Aust. J. Plant
Physiol. 16:169-179.
Medina CL, Machado EC, Gomes MMA (1999) Condutância estomática, transpiração e fotossíntese em laranjeira ‘Valência’ sob deficiência hídrica. Rev. Bras. Fisiol. Veg. 11:29-34.
Ramos C, Kaufmann MR (1979) Hydraulic resistance of rough lemon roots. Physiol. Plant. 45:311-314.
Sinclair TR, Allen LH (1982) Carbon dioxide and water vapour exchange of leaves on field-grown citrus trees. J. Exp. Bot. 33:1166-1675.
Syvertsen JP (1982) Minimum leaf water potential and stomatal closure in citrus leaves of different ages. Ann. Bot. 49:827-834.
Syvertsen JP, Lloyd JJ (1994) Citrus. In: Schaeffer B, Andersen PC (eds), Handbook of Environmental Physiology of Fruits Crops: Sub-tropical and Tropical Crops, CRC Press, Boca Raton, Florida.