Rev. Caatinga
BENCHMARKS
FOR MILK PRODUCTION SYSTEMS IN THE PERNAMBUCO
AGRESTE REGION, NORTHEASTERN BRAZIL¹
MARLA CONCEIÇÃO OLIVEIRA2*, JOSÉ MAURÍCIO DE SOUZA CAMPOS2, ANDRÉ SOARES DE OLIVEIRA3, MARCELO DE ANDRADE FERREIRA4, AIRON APARECIDO SILVA DE MELO2
ABSTRACT - The objective of this work was to identify and assess the technological, zootechnical and socioeconomic profiles and identify and quantify benchmarks for dairy cattle production systems, in a non -experimental approach, aiming to contribute to the sustainability and competitiveness of dairy farming in the Pernambuco Agreste region, northeastern Brazil. Thirty-six milk production systems of family and corporate farming were evaluated during twelve months, in order to identify and quantify the benchmarks. The systems were characterized regarding their size and technological, zootechnical and economic profiles. The correlation coefficients of the return rate on invested capital were assessed and regression equations were developed for each indicator, according to four scenarios of annual return rates (4, 6, 8 and 10%). The indicators evaluated were milk production per dairy cows, milk production per area, average price of milk, effective operational cost, total operating cost, total cost per price of milk and profitability. The dairy farming in the Pernambuco Agreste region pays the production costs, but tends to a not adequate remuneration of family labor and a need of external capital input for replacement of the assets. The productivity of production factors area and animals showed higher correlation with cost-effectiveness, denoting the need for increase the production through increases in land area and milk productivity per dairy cow. The identification and quantification of benchmarks may help to identify the weak points of dairy farming in the Agreste region, making it sustainable and competitive.
Keywords: Milk production costs. Milk production Economy. Economic indicators. Size indicators. Zootechnical indicators.
INDICADORES REFERÊNCIA (BENCHMARKS) DE SISTEMAS DE PRODUÇÃO DE LEITE DE VACAS NO AGRESTE PERNAMBUCANO
RESUMO - Objetivou-se levantar e avaliar os perfis tecnológicos, zootécnicos e socioeconômicos, identificar e quantificar indicadores referência, para sistemas de produção de bovinos de leite, de caráter não experimental, de forma a contribuir para a sustentabilidade e competitividade da pecuária de leite na mesorregião do Agreste pernambucano. Para identificar e quantificar os indicadores referência foram avaliados durante doze meses, trinta e seis sistemas de produção de leite da agricultura familiar e empresarial. Os sistemas foram caracterizados em relação ao perfil tecnológico e aos indicadores de tamanho, zootécnicos e econômicos. Foram determinados os coeficientes de correlação com a taxa de remuneração do capital investido e geradas equações de regressão, para cada indicador, em função de quatro cenários da taxa de remuneração do capital (4, 6, 8 e 10% ao ano). Os indicadores correlacionados foram: produção de leite/vacas em lactação; produção de leite/área; preço médio do leite; custo operacional efetivo, custo operacional total e custo total / preço do leite e lucratividade. A pecuária leiteira no Agreste pernambucano, paga os custos mensais, mas a tendência é a não remuneração adequada da mão-de-obra familiar e a injeção de capital externo para a reposição dos bens. A produtividade dos fatores de produção terra e animal apresentaram maior correlação com rentabilidade, indicando a necessidade do aumento da produção, por meio do aumento da produtividade da terra e da produção de leite/vacas em lactação. A identificação e quantificação de indicadores referência podem contribuir para a identificação dos pontos frágeis da pecuária leiteira no Agreste tornando-a sustentável e competitiva.
Palavras-chave: Custo de produção do leite. Economia da produção leiteira. Indicadores econômicos. Indicadores de tamanho. Indicadores zootécnicos.
___________________ *Corresponding author
1Received for publication in 08/04/2014; accepted in 04/11/2016.
Paper extracted from the master thesis of the first author, funded by CNPq and FACEPE.
2Department of Animal Science, Universidade Federal Rural de Pernambuco, Garanhuns, PE, Brazil; marla.zootecnista@gmail.com, jmcampos@ufv.br, aironuag@hotmail.com.
INTRODUTION
Dairy cattle in Brazil undergone changes from 1991, with a high increase in production and reduction in prices, leading to a need for improvement of the efficiency of milk production systems, from the technical and economic point of view (FERREIRA JUNIOR; TEIXEIRA, 2005).
Another change was the expansion of dairy farming to non-traditional regions, such as the Northeast. Pernambuco is the second largest producer state in the region, which had an increase in its milk production of 165%, which was higher than the Northeast (81%) from 2001 to 2011. This increase was supported by the Agreste region, which is the main dairy region of the State (IBGE, 2013).
However, the continued growth of dairy farming in emerging regions such as the Northeast is uncertain, mainly due to socioeconomic and technological factors, milk quality, environmental restrictions and management practices, which are important limitations to its sustainability and expansion (MARTINS et al., 2009).
A production system need to be evaluated and compared with another system or preferably with other systems, searching better results, to improve their efficiency. Benchmarks are important tools, since the figures for comparison are obtained directly from production units present in the same economic environment (GOMES, 2005; MAGALHÃES; CAMPOS, 2006).
Studies have been conducted to identify the main zootechnical and economic indicators which influence the cost-effectiveness of milk production systems worldwide. Gomes (2000) conducted one of the first studies, which was a reference for comparison the efficiency of milk production systems for many years in Brazil. Afterwards, Oliveira et al. (2007) and Camilo Neto et al. (2012) indicated the need for regionalized studies due to the different environments in which these systems are implemented. It is assumed that the technical and economic benchmarks are different between the production system groups adopted and influence economic outcomes differently, depending on the production system, market and management capacity.
Studies conducted in the Northeast region, searching to establish technical and economic benchmarks, used evaluations of single locations and technical and economic information of the last 12 months, questionnaires, simulations and panel techniques, aiming to identify and characterize reference systems or modes of milk production, which do not always represent the dynamic conditions of milk production systems throughout the year (MAGALHÃES; CAMPOS, 2006; YAMAGUCHI, et al., 2009; MOURA, et al., 2013). Therefore, the development of advanced and systematic studies in dairy farming in the region is
necessary, in order to identify the main constraints and factors that determine a sustainable exploitation.
The objective of this work was to identify and assess the technological, zootechnical and socioeconomic profiles and identify and quantify benchmarks for dairy cattle production systems, in a non-experimental approach, aiming to contribute to the sustainability and competitiveness of dairy farming in the Pernambuco Agreste region, northeastern Brazil.
MATERIAL AND METHODS
Thirty-six milk production systems of family and corporate farming were evaluated in farms of the Pernambuco Agreste region, which are located in São Bento do Una (41.67%), members of the São Bento do Una Milk Producers Association (PROLEITE); in the Central Agreste, members of the Cooperative of Ipanema Valley Family Farmers (COOPANEMA); in the county of Águas Belas (47.22%); and in the county of Garanhuns (11.11%) in Southern Agreste.
The producers were registered and production systems characterized regarding the socioeconomic and technological aspects: type of milking, feeding system, palm planting, fertilization for fodder production, artificial insemination, milk cooling system, male and female raising and breeding, management practices and main genetic group.
Evaluations were conducted to assess the available resources in the farms regarding the land area, animals, land structures and machinery, and quantify the physical resources and capital invested in the farm activity, disregarding the devaluations. Income and expenses were monthly and individually followed, using the nominal values of the period. Cost calculations and size, technical and economic indicators of milk production systems were evaluated according to Oliveira et al. (2007).
The economic indicators considered were the Effective Operating Cost (EOC), which is the total direct expenses throughout the year for milk production, including hired labor, general supplies, taxes, machinery maintenance and land structures; Total Operating Cost (TOC), which is the EOC plus the family labor costs and devaluations of the assets used in the farm activity throughout the year; and Total Cost (TC), which is the TOC plus the return rate on the average invested capital in animals, land structures, machinery, not annual forages and land area. The return rate on invested capital was calculated considering an interest rate of 6% per year.
Rev. Caatinga
invested in animals, land structures, machinery, non -annual forages and land area; Capital Return Rate, including land area (CRR), which was used as the main indicator of economic sustainability; Profit, which is the gross income (GI) minus the total costs; Profitability, which is the net income multiplied by 100 and divided by the GI; and Cost-Effectiveness, which is the net income multiplied by 100 and divided by the invested capital.
Correlation coefficients were determined between the size, technical and economic indicators and the CRR, in order to identify indicators that affect economic performance, using the Pearson's correlation procedure according to Oliveira et al. (2007).
Regression equations were developed for each indicator that showed a significant correlation (p<0.10) as a function of the CRR, to quantify benchmarks (Oliveira et al., 2007). In the regression equations, the main components were selected as independent variables and the CRR as a dependent variable. The values of each indicator were estimated, considering four real rate scenarios of annual return rate on invested capital (4, 6, 8 and
10%). All statistical procedures were performed using the SAS-9.2 (Statistical Analysis System), and a critical level of probability of 0.10 for type I error.
RESULTS AND DISCUSSION
The production systems were characterized mostly as family agriculture (83.33%), since according to Zoccal, Gomes and Leite (2016) family farming consist of family labor, cultural traditions and production and family farming systems are those in which the producer is owner and also work in the farm. The systems evaluated had family labor in the farm activity, main family income from the farm activities and the owner living in the farm or focused in its daily management. The other systems were considered as commercial agriculture, since their owners had higher incomes from other activities than milk production, and the labor used in the system were exclusively hired, except the managers.
Diversification of farm activity is common in family farming, however, the farms sampled had few producers developing other activities with higher incomes than milk (Table 1).
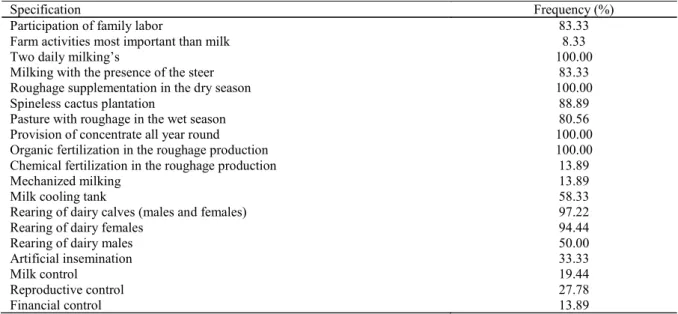
Table 1. Technological profile of dairy farms in the Agreste of Pernambuco.
Specification Frequency (%)
Participation of family labor 83.33
Farm activities most important than milk 8.33
Two daily milking’s 100.00
Milking with the presence of the steer 83.33 Roughage supplementation in the dry season 100.00
Spineless cactus plantation 88.89
Pasture with roughage in the wet season 80.56 Provision of concentrate all year round 100.00 Organic fertilization in the roughage production 100.00 Chemical fertilization in the roughage production 13.89
Mechanized milking 13.89
Milk cooling tank 58.33
Rearing of dairy calves (males and females) 97.22
Rearing of dairy females 94.44
Rearing of dairy males 50.00
Artificial insemination 33.33
Milk control 19.44
Reproductive control 27.78
Financial control 13.89
1
The practice of milking twice a day wereperformed in all systems and most were performed in the presence of the caw's calf. This practices may be cultural or possibly due to the low adoption of mechanical milking.
The herds consisted of crossbred animals, with predominance of Dutch and Gir breeds, with genetic composition between 1/4 to 7/8 Dutch x Zebu (DZ), and predominance of the 3/4 DZ.
All production systems used fodder supplementation during the dry period, mostly corn silage and to a lesser degree sorghum. Corn crops in region have high risk, and losses may occur throughout its cycle, thus, palm (Opuntia and Nopalea) crops was used in almost all systems, since
it is greatly adapted to the soil and climate conditions of the region. Palm can be used as forage source when associated with a fiber source (WANDERLEY et al., 2012; RAMOS et al., 2013) or as concentrated energy source (ARAUJO et al., 2004; VERONALDO, et al, 2007) when its nutritional deficiencies are corrected (FERREIRA et al., 2009).
technological information.
Concentrate feed was supplied throughout the year, which contributed to raising the production cost, decreasing the competitiveness of the milk produced.
Despite the low adoption of mechanical milking, most production systems had expansion tanks for cooling the milk, however, this percentage was low, since the current legislation requires that 100% of the marketed milk be cooled.
Almost all farmers raised male and female cattle, and most of them reared females for future replacement, however, half of the systems were rearing male, which is considered a high percentage.
Few farmers used artificial insemination, denoting a room for genetic improvement of the livestock. Oliveira et al. (2001) reported that the genetic improvement through artificial insemination contributed to raising the herd productivity rates and consequently the economic indicators.
The adoption of management practices such as controlling the milk production, animal reproduction and finances was low. The adequate control of all resources allows the producer to make quick and objective decisions, which are critical to
the success of the activity. In other dairy regions that are competitive the percentage of farmers that control these resources reaches 100% (OLIVEIRA et al., 2007; CAMILO NETO et al., 2012).
The average daily milk production of the sampled farms ranged from 50 to 200 liters per day. According to Zoccal et al. (2011), farms with this range are responsible for the largest amount of milk produced in Brazil, corresponding to 39.10% of the national production (Table 2).
The average daily milk production and the average size of the area for this activity, especially concerning the minimum values, indicate the fragility of the production systems evaluated, presenting inconsistent or variable production capacity. This situation is aggravated by the lack of technology, technical assistance and credit, and the semi-arid environmental conditions, indicating a need to increase the scale of production, in order to optimize the land area factor. Oliveira et al. (2001), Lopes et al. (2006) and Lopes et al. (2008), showed that production and area indices are related to the cost-effectiveness of the activity and the scale of production are key to reach attractive economic indices in milk cattle.
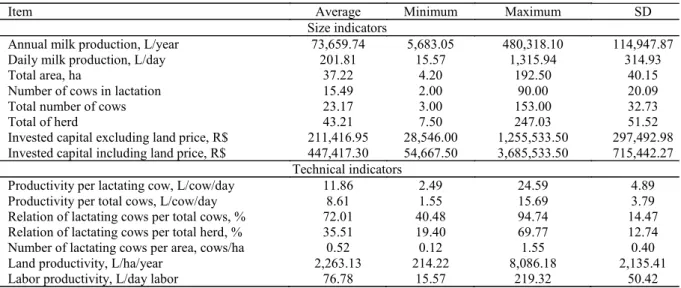
Table 2. Descriptive statistics of herd indicators of dairy farms in the Agreste of Pernambuco.
Item Average Minimum Maximum SD
Size indicators
Annual milk production, L/year 73,659.74 5,683.05 480,318.10 114,947.87 Daily milk production, L/day 201.81 15.57 1,315.94 314.93
Total area, ha 37.22 4.20 192.50 40.15
Number of cows in lactation 15.49 2.00 90.00 20.09
Total number of cows 23.17 3.00 153.00 32.73
Total of herd 43.21 7.50 247.03 51.52
Invested capital excluding land price, R$ 211,416.95 28,546.00 1,255,533.50 297,492.98 Invested capital including land price, R$ 447,417.30 54,667.50 3,685,533.50 715,442.27
Technical indicators
Productivity per lactating cow, L/cow/day 11.86 2.49 24.59 4.89 Productivity per total cows, L/cow/day 8.61 1.55 15.69 3.79 Relation of lactating cows per total cows, % 72.01 40.48 94.74 14.47 Relation of lactating cows per total herd, % 35.51 19.40 69.77 12.74 Number of lactating cows per area, cows/ha 0.52 0.12 1.55 0.40 Land productivity, L/ha/year 2,263.13 214.22 8,086.18 2,135.41 Labor productivity, L/day labor 76.78 15.57 219.32 50.42
1
SD - Standard deviation.The size indicators average amount of lactating dairy cows, total amount of cows and cattle showed that the herd structure in the farms was formed by a small number of lactating animals, compromising the milk production and income. Therefore, practices must be developed to improve the calving interval, age at first calving and disposal criteria, which are factors that affect the structure of the herd.
The capital invested in the land area represented, on average, 52.79% of the fixed assets, which denotes the need for improvements in actions to increase the productivity of the land area factor, which depends on other intermediate indicators. Thus,
An increase in the productivity of the lactating cows per hectare is necessary, increasing the milk production per hectare, hence the importance of a structured herd and the attention to fodder production, including pasture.
Rev. Caatinga environment was provided to them.
The average value for the ratio lactating cows by total cows was low compared to the overall rate of 83%. This index is an indicator that is influenced by the lactation period and calving intervals, which may be affected by genetic and environmental factors, and especially by the feeding and reproductive managements.
Despite below the reference value, this indicator showed that the herds of the Pernambuco Agreste region had a better reproductive efficiency compared to samples evaluated in the state of Minas Gerais (54.73%) (FASSIO et al., 2006) and Southern Bahia State (57.47%) (OLIVEIRA et al., 2007).
On average, the percentage of lactating cows in relation to the total amount of cattle was considered low. This is an indicator affected by calving interval, lactation, age at first calving and disposal. Thus, the higher the ratio, the greater the percentage of animals generating incomes. According to Gomes (2000), the percentage of an efficient production systems for this indicator are around 60%, with at least 40%. However, the rearing of males was performed in 50% of the farms (Table 1) as a form of economic reserves, contributing to reduce the percentage of dairy cows in the total herd. The average amount of lactating cows per hectare and land area productivity was low (0.52), showing a small concern for the production per area. There is no reference value for these indicators, however, once adjusted to the costs, the higher, the better the economic results.
Gomes (2000) found at least one lactating cow per hectare in efficient milk production systems
in Minas Gerais.
The average value of 0.52 of lactating cows per hectare was considered reasonable, taking into account the soil and climatic conditions of the region and the difficulty for fodder production due to the low precipitations during the study period, which were 202.50 mm (São Bento do Una), 312.60 mm (Águas Belas) and 431.10 mm (Garanhuns), figures below the averages of the Pernambuco Agreste region, due to a drought period in the region (APAC, 2013).
The productivity of labor (Table 2) was one of the lowest in Brazil (LOPES et al., 2006; OLIVEIRA et al., 2007; CAMILO NETO et al., 2012). According to Gomes (2005), as the labor becomes scarce, this indicator increase in importance. Gomes (2000) found a labor productivity in efficient farms of a central cooperative in Minas Gerais of at least 150 (manual milking) and 250 (mechanical milking) liters of milk per day per person. Thus, this indicator must be increased in the production systems of the Agreste region.
The share of the milk gross income in relation to the gross income of the activity was used to separate the cost of the milk and the cost of the activity (Table 3). Camilo Neto et al. (2012), considering the SEBRAE Educampo Project, reported that the income from the milk was 70.1 to 80% of the income of the activity in balanced production systems, producing 8.1 to 12 liters per lactating cow per day (range in which the evaluated samples of the present study are found), results that are within the recommended rates.
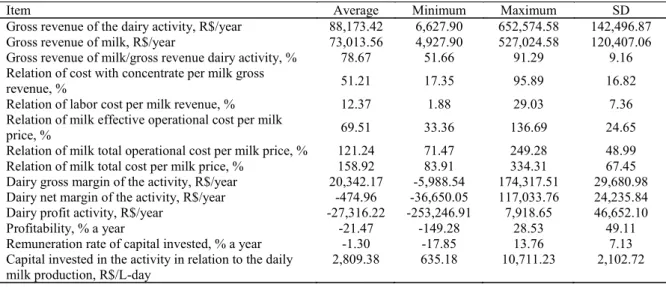
Table 3. Descriptive statistics of the production costs and gross revenue of dairy farms in the Agreste of Pernambuco.
Item Average Minimum Maximum SD
Gross revenue of the dairy activity, R$/year 88,173.42 6,627.90 652,574.58 142,496.87 Gross revenue of milk, R$/year 73,013.56 4,927.90 527,024.58 120,407.06 Gross revenue of milk/gross revenue dairy activity, % 78.67 51.66 91.29 9.16 Relation of cost with concentrate per milk gross
revenue, % 51.21 17.35 95.89 16.82
Relation of labor cost per milk revenue, % 12.37 1.88 29.03 7.36 Relation of milk effective operational cost per milk
price, % 69.51 33.36 136.69 24.65
Relation of milk total operational cost per milk price, % 121.24 71.47 249.28 48.99 Relation of milk total cost per milk price, % 158.92 83.91 334.31 67.45 Dairy gross margin of the activity, R$/year 20,342.17 -5,988.54 174,317.51 29,680.98 Dairy net margin of the activity, R$/year -474.96 -36,650.05 117,033.76 24,235.84 Dairy profit activity, R$/year -27,316.22 -253,246.91 7,918.65 46,652.10 Profitability, % a year -21.47 -149.28 28.53 49.11 Remuneration rate of capital invested, % a year -1.30 -17.85 13.76 7.13 Capital invested in the activity in relation to the daily
milk production, R$/L-day
2,809.38 635.18 10,711.23 2,102.72
1
SD-Standard deviation.The expenses with concentrate feed in relation to the milk gross income is an important indicator of economic efficiency. The economic balance of the production systems showed that the percentage of this indicator was high compared to
is compromised, denoting the need for assessments on the use of concentrate in production systems of the Pernambuco Agreste region.
The average expenses with hired labor in relation to the milk gross income was low, however it is not an indicator of efficiency, since the family labor is not included in the calculation of the effective operational cost of milk due to methodology issues.
On average, the participation of the effective operational cost (EOC), total operating cost (TOC) and total cost (TC) in the milk prices were high, for which the SEBRAE Educampo Project recommends 65, 75 and 85%, respectively (CAMILO NETO et al., 2012). The expense of the milk income was higher than it is recommended to pay the TOC and TC, thus, with no adequately remunerating the family labor and return rate on invested capital in the activity.
On average, the gross margin was positive and the net margin negative, indicating a tendency to devaluation of the assets, inadequate remuneration of family labor, and input of external capital for replacement of the assets. The amount of CRR (-1.30) was zero, indicating that the return rate is below the opportunity interest. The systems can manage pay the monthly costs in short and medium term, however, this situation is unsustained in the long term, and some producers may leave the activity.
The average capital invested in the activity in relation to the daily milk production was high (R$ 2,809.38). Camilo Neto et al. (2012), considering the
SEBRAE Educampo Project, indicated that this value should not exceed R$ 500.00 in the Southeast of Brazil. The capital invested in land area constituted most of the fixed assets of the evaluated systems, optimizing the indicators that are related to the land area factor, thus, the efficiency of use of the capital invested in the activity tends to increase.
Milk production systems located in Pernambuco Agreste region, on average, were not profitable or cost-effective. Low profitability and especially cost-effectiveness indicate that the activity in the period studied was not economically attractive and, in the long term, the farmers may migrate to other more attractive activities. Considering this information, the macroeconomic policies for sustainable regional development and the production systems should be reformulated from the zootechnical, economic and managerial point of view in order to make this activity attractive. However, profitable and cost-effective production systems were found in family and business farming, which can serve as a reference for the region.
The size indicators area for livestock, lactating cows, total cows and capital invested with land area; and the zootechnical indicators lactating cows by total cows, total cattle and area, had no correlation with the return rate on invested capital in the production systems (Table 4). This result indicates that the attractiveness of the activity is not dependent on the size of the system or the herd in the Pernambuco Agreste region, once the other production factors are balanced
Table 4. Correlation coefficients (%) and descriptive levels of probability (P value) of indicators evaluated with the
remuneration rate of invested capital (% per year) of dairy farms in the Agreste of Pernambuco.
Index Correlation coefficient P value
Daily milk production, L/day 0.554 0.0005
Area utilized for the dairy activity, ha 0.066 0.7036
Number of lactating cows per month 0.227 0.1826
Total number of cows per month 0.177 0.3019
Relation of lactating cows per total cows, % 0.181 0.2893 Relation of lactating cows per total herd, % 0.265 0.1181
Number of lactating cows per area 0.251 0.1405
Milk production per lactating cow, L/cow/day 0.603 0.0001
Milk production per labor, L/dh 0.596 0.0001
Milk production per area, L/ha 0.542 0.0006
Average milk price, R$/L 0.346 0.0385
Relation of milk effective operational cost per milk price, % -0.525 0.0010 Relation of milk total operational cost per milk price, % -0.964 <0.0001 Relation of milk total cost per milk price, % -0.879 <0.0001 Relation cost labor per milk gross revenue, % -0.423 0.0713 Relation of concentrate cost per milk gross revenue, % -0.294 0.0813 Stock of capital invested in the activity including land, R$ 0.180 0.2923
Profitability, % a year 0.963 <0.0001
Relation of capital invested in the activity per milk produced daily,
R$/L -0.554 0.0005
Concentrate expense, R$ 0.442 0.0069
Rev. Caatinga
The daily milk production was positively correlated (p=0.0005) with the cost-effectiveness, indicating the importance of the scale of production to determine the attractiveness of the activity in the region, as it has in most dairy production regions in Brazil (GOMES, 2005; LOPES et al., 2006; LOPES et al., 2008). The producers are probably operating in the economies of scale phase, in which the increase in production leads to a lower proportional increase in the total cost and, consequently, a higher proportional increase in the activity profit.
The positive correlation of CRR with milk production per area and with milk production per lactating cow (p<0.10) indicate that the increase in land area productivity is a way to increase the scale of production, increasing the milk production per lactating cow, since the indicator lactating cow per area was not correlated.
The technical indicator labor productivity, evaluated by the milk production per day per person, was correlated (p=0.0001) with CRR, thus, it is an important balance of cost-effectiveness, since labor productivity in the region is one of the lowest in Brazil.
In the costs composition, the hired or family labor expenses had a pronounced effect on the cost -effectiveness of the production systems. Thus, a greater attention to their training is recommended, and management practices that encourage increased productivity must be applied.
The economic indicators milk price, profitability and expenses with concentrate feed were positively correlated, while the EOC, TOC, TC per milk price, expenses with labor and concentrated feed per milk gross income and capital invested per liter of milk were negatively correlated (p<0.10) with the CRR.
In the formation of the milk price to be paid to the producer, the additions related to the volume has a great weighing to the industries, which in many cases is greater than the quality weighing, indicating a need to increase the scale of production in the evaluated systems. The destination of the informal milk production in the Pernambuco Agreste region is most the cheese production, occurring in the same system, thus, the amount of cheese sold in local markets, which is determined by the supply and demand is a balance point of the scale of production. The supply and demand can affect the price of the product in the formal market, however, it is not a limitation to the increase in the scale of production.
Profitability can be an important indicator of efficiency for decision making if used with caution,
since it is easier to assess compared to the cost -effectiveness. Gomes (2000) found that the profitability could be higher than 25% in a sample of efficient producers in Minas Gerais, if the fixed assets were balanced.
The positive correlation of concentrate feed expenses with the CRR is possibly due to a more rational use in efficient systems, since all systems commonly use it to compensate the low availability of forage.
Negative correlations of the EOC, TOC and TC with CRR, although obvious, when quantified, became an important tool for the management of the production systems, setting limits to these costs in relation to the price of the milk to achieve cost -effectiveness, as well as the indicators labor and concentrate feed expenses in relation to the milk gross income, which are more important indicators than the absolute expenses.
The expenses on concentrate feed and permanent labor have the largest proportion in the composition of the EOC of milk in corporate farming, thus, the correlation with the cost -effectiveness allows to limit this expenses or searching for a cheaper feed source.
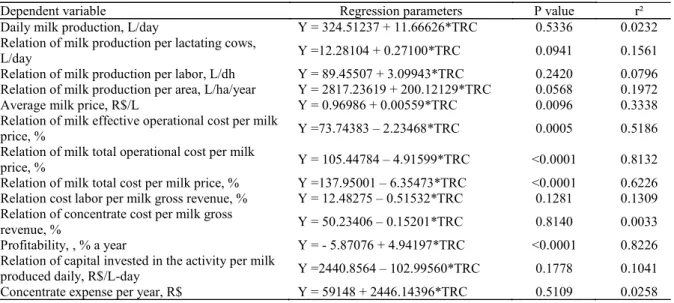
The daily milk production in the Pernambuco Agreste region is fragmented, similarly to the main dairy regions of the country. The areas sampled for evaluation were the ones most representative of the regional structure, thus, the dispersion of the data did not allow the quantification of all indicators (average milk production; labor productivity; expenses with labor and concentrated feed in relation to milk gross income; capital invested per liter of milk and expenses with concentrate feed) correlated with the CRR, since some equations developed were not significant (Table 5 and 6).
Table 6. Benchmarks of dairy farms in the Agreste of Pernambuco, in four scenarios of remuneration rate of invested capital (4, 6, 8 and 10% a year).
Benchmarks RRC
1
(% a year)
4 6 8 10
Milk production per lactating cow, L/day 13.37 13.91 14.45 15.00 Milk production per area, L/ha/year 3617.72 4018.0 4418.2 4818.45
Average milk price, R$/L 0.99 1.00 1.02 1.03
Relation of milk effective operational cost per milk price,
% 64.81 60.34 55.87 51.39
Relation of milk total operational cost per milk price, % 85.78 75.95 66.12 56.29 Relation of milk total cost per milk price, % 112.53 99.82 87.11 74.40 Profitability, % a year 13.90 23.78 33.67 43.55
1
1RRC - Remuneration rate of invested capital including land price.The milk production per lactating cow would need to increase by 17% for a return rate of 6% per year, compared to the average production found in the production systems (Table 2). Thus, improving the genetic quality of livestock (OLIVEIRA et al., 2001), and in short term, improvements in management and feeding practices is required, especially for the planning of fodder feeding.
Camilo Neto et al. (2012) found that 12, 13, 14 and 15 liters per lactating cow are needed for a return rate on invested capital of 6, 8, 10 and 12% per year, respectively, which is similar to the values found for this indicator in the present work.
The production per area should increase by 77% compared to the current average productivity (Table 2) for a return rate of 6% per year (Table 6), denoting the importance of this indicator for a more attractive dairy farming in the Pernambuco Agreste region.
Although the study has indicated a more important contribution of productivity per lactating cow for improving land area productivity, the increase number of dairy cows per hectare must be considered (Table 2). Double the average number of dairy cows per hectare, from the current 0.5 to 1.0, is reaching the land area productivity for a return rate
on invested capital of 6%.
The assessment on the indicator average price of milk showed that it is impossible to develop an attractive dairy business with prices lower than R$ 1.00 per liter, which is a major challenge for the economic sustainability of the activity in the region. In this case, the challenge is not to produce milk, but do it competitively with the other regions of Brazil.
The values of the EOC, TOC and TC indicate that the cost of the system should not exceed 60% of the monthly milk income for a rate of return rate of 6% per year, and that a family labor remuneration plus the devaluations can add to the cost no more than 15% of the monthly income of milk for a profitability of 25%, turning the activity more attractive. These values are similar to those found by Gomes (2000), for a sample of producers in Minas Gerais, higher than those observed by Oliveira et al. (2007) and lower than those observed by Camilo Neto et al. (2012), using the same return rate.
The profitability was similar to that found by Gomes (2000) for a return rate of 6% per year, for a sample of efficient producers in Minas Gerais. Camilo Neto et al. (2012) found a profitability of 15% for the same return rate, due to the difference in cost structures of the production systems of the
Table 5. Regression parameters, probability descriptive levels(P value) and determination coefficients(r2) of indicators
evaluated with the remuneration rate of invested capital (% per year) of dairy farms in the Agreste of Pernambuco. Dependent variable Regression parameters P value r² Daily milk production, L/day Y = 324.51237 + 11.66626*TRC 0.5336 0.0232 Relation of milk production per lactating cows,
L/day Y =12.28104 + 0.27100*TRC 0.0941 0.1561
Relation of milk production per labor, L/dh Y = 89.45507 + 3.09943*TRC 0.2420 0.0796 Relation of milk production per area, L/ha/year Y = 2817.23619 + 200.12129*TRC 0.0568 0.1972 Average milk price, R$/L Y = 0.96986 + 0.00559*TRC 0.0096 0.3338 Relation of milk effective operational cost per milk
price, % Y =73.74383 – 2.23468*TRC 0.0005 0.5186 Relation of milk total operational cost per milk
price, % Y = 105.44784 – 4.91599*TRC <0.0001 0.8132 Relation of milk total cost per milk price, % Y =137.95001 – 6.35473*TRC <0.0001 0.6226 Relation cost labor per milk gross revenue, % Y = 12.48275 – 0.51532*TRC 0.1281 0.1309 Relation of concentrate cost per milk gross
revenue, % Y = 50.23406 – 0.15201*TRC 0.8140 0.0033 Profitability, , % a year Y = - 5.87076 + 4.94197*TRC <0.0001 0.8226 Relation of capital invested in the activity per milk
produced daily, R$/L-day Y =2440.8564 – 102.99560*TRC 0.1778 0.1041 Concentrate expense per year, R$ Y = 59148 + 2446.14396*TRC 0.5109 0.0258
Rev. Caatinga
samples evaluated. These differences denote the need for constant identification and quantification of the indicators by region, confirming the findings of Oliveira et al. (2007) and Camilo Neto et al. (2012).
This work was conducted during the time of one of the worst droughts ever recorded in the Northeastern Brazil, which certainly affected the results and shows the importance of this type of study, which should be replicated not only in time but also in space.
CONCLUSIONS
The productivity of production factors land area and animals had correlation with cost -effectiveness higher than the factors related to the capital and labor in cow milk production systems in the middle of the Pernambuco Agreste region, denoting the need for increase the scale of production through increases in land area productivity and milk production per lactating cow, since the indicator lactating cow per area was not correlated, objectives that can be achieved if the management and feeding practices were improved, with emphasis on the planning of fodder feed.
The fodder feeding was compromised by the prolonged drought, thus, this type of study should be repeated in another period using the same space.
The identification and quantification of benchmarks more correlated with the cost -effectiveness can assist in the identification of weak points of the dairy farming in the Agreste, turning it into a sustainable and competitive activity.
ACKNOWLEDGEMENTS
The authors thank the CAPES and CNPq for partial funding this research; the undergraduate (Animal Science) student and CNPq scholar Deivid Vinicius de Araujo for collaborating to the data collection, correction and tabulation; the professor Stefanie Alvarenga dos Santos for collaborating to the data analysis; and the professor Daniela Moreira de Carvalho for the suggestions in the writing of the master's thesis.
REFERENCES
ARAUJO, P. R. B. et al. Substituição do milho por palma forrageira em dietas completas para vacas em lactação. Revista Brasileira de Zootecnia, Viçosa, v. 33, n. 6, p. 1850-1857, 2004.
BRASIL. Agência Pernambucana de Águas e Clima – APAC. Monitoramento pluviométrico. Disponível em: <http://www.apac.pe.gov.br/
meteorologia/monitoramento-pluvio.php>. Acesso em: 05 jul. 2013.
BRASIL. Instituto Brasileiro de Geografia e Estatística – IBGE. [2013]. Banco de dados agregados. Disponível em: < http:// www.sidra.ibge.gov.br/bda/tabela/listabl.asp? z=t&c=74>. Acesso em: 25 mai. 2013.
CAMILO NETO, M. et al. Identification and quantification of benchmarks of Milk productions systems in Minas Gerais. Revista Brasileira de Zootecnia, Viçosa,v. 41, n. 10, p. 2279-2288, 2012.
FASSI0, L. H; REIS, R. R; GERALDO, L. G. Desempenho técnico e econômico da atividade leiteira em Minas Gerais. Ciência e Agrotecnologia, Lavras,v. 30, n. 6, p. 1154-1161, 2006.
FERREIRA JÚNIOR, S.; TEIXEIRA, E. C. Relações de produção na pecuária leiteira: um estudo de caso das respostas da produção aos preços mensais. Revista de Economia e Agronegócio, Viçosa,v. 3, n. 2, p. 193-212, 2005.
FERREIRA, M. A. et al. Estratégias na suplementação de vacas leiteiras no semi-árido do Brasil. Revista Brasileira de Zootecnia, Viçosa, v. 38, Sup., p. 322-329, 2009.
GLÓRIA, J. R. et al. Efeito da composição genética e de fatores de meio sobre a produção de leite, a duração da lactação e a produção de leite por dia de intervalo de partos de vacas mestiças Holandês-Gir. Arquivo Brasileiro de Medicina Veterinária e Zootecnia, Belo Horizonte, v. 58, n. 6, p. 1139 -1148, 2006.
GOMES, S. T. Economia da produção de leite. Belo Horizonte, MG: Itambé, 2000. 132 p.
GOMES, S.T. Benchmark da produção de leite em MG. [2005]. Disponível em: <http://www.ufv.br/ der/docentes/stg/stg_artigos/Art_182%20-%20 >. Acesso em: 20 abr. 2013.
LOPES, M. A. et al. Efeito da escala de produção nos resultados econômicos de sistemas de produção de leite na região de Lavras (MG): um estudo multicasos. Boletim da Indústria Animal, Nova Odessa,v. 63, n. 3, p. 177-188, 2006.
LOPES, M. A. et al. Efeito da escala de produção nos resultados econômicos de sistemas de produção de leite na região de Lavras (MG, Brasil), em 2004 e 2005, Asociación Latinoamericana de Producción Animal, Lavras, v. 16, n. 3, p. 121-129, 2008.
leite no estado do Ceará. Revista de Economia e Sociologia Rural, Brasília, v. 44, n. 4, p. 695-711, 2006.
MARTINS, P. C. et al. Recomendações. In: CARVALHO, G. R. et al.(Eds.) Competividade da Cadeia Produtiva do Leite em Pernambuco. Juiz de Fora: Embrapa Gado de Leite, 2009, v. 1, cap. 21, p. 371-375.
MOURA, J. F. P. et al. Avaliação tecnológica dos sistemas de produção de leite bovino no Cariri da Paraíba. Revista Brasileira de Saúde e Produção Animal, Salvador,v. 14, n. 1, p. 121-131 2013. OLIVEIRA, A. S. et al. Identificação e quantificação de indicadores-referência de sistemas de produção de leite. Revista Brasileira de Zootecnia, Viçosa, v. 36, n. 2, p. 507-516, 2007.
OLIVEIRA, T.B.A. et al. Índices técnicos e rentabilidade da pecuária leiteira. Scientia Agrícola, Piracicaba, v. 58, n. 4, p. 687-692, 2001.
OLIVEIRA, V.S. et al. Substituição total do milho e parcial do feno do capim-tifton por palma forrageira em dietas para vacas em lactação. Produção, composição do leite e custos com alimentação. Revista Brasileira de Zootecnia, Viçosa, v. 36, n. 4, p. 928-935, 2007.
RAMOS, A. O. et al. Diferentes fontes de fibra em dietas a base de palma forrageira na alimentação de ovinos. Revista Brasileira de Saúde e Produção Animal, Salvador, v. 14, n. 4, p. 648-659, 2013. STATISTICAL Analyses System – SAS. SAS user’s guide, Cary: v. 8, 295 p. 1999.
WANDERLEY, W. L. et al. Silagens e fenos em associação a palma forrageira para vacas em lactação. Consumo, Digestibilidade e Desempenho. Revista Brasileira de saúde e Produção Animal, Salvador,v. 13, n. 3, p. 745-775, 2012.
YAMAGUCHI, L. C. T. et al. Caracterização dos sistemas referências na produção de leite da região do Agreste. In: CARVALHO, G. R. et al.(Eds.) Competividade da Cadeia Produtiva do Leite em Pernambuco. Juiz de Fora: Embrapa Gado de Leite, 2009, v. 1, cap. 3, p. 43-74.
ZOCCAL, R. et al. [2016]. Produção de Leite na Agricultura Familiar. Disponível em: <http:// www.sober.org.br/palestra/12/09O433.pdf>. Acesso em: 21/03/2016.
ZOCCAL, R.; ALVES, E. R.; GASQUES, J. G. Estudo preliminar. Contribuição para o Plano Pecuário 2012. Diagnóstico da Pecuária de Leite
nacional. 2011. Disponível em: < http:// www.cnpgl.embrapa.br/nova/