beside possibility to express their opinions. In such a city, children can participate in the urban plans. This study seeks to compare and contrast different areas of Quchan including Yaghoub Abad, the Farhangian and Davoodi. These areas are going to be analyzed based on the desirable indicators of a child-friendly city comprising: public spaces urban furniture, transportation and traffic, social-cultural parameters. The present descriptive-analytical study is based on library research, surveys and interviews, using SPSS software. A decision model (TOPSIS), was also used for evaluating and ranking studied regions. On the aspect of urban furniture, the results showed that between the studied areas, Yaghoub Abad district had a more favorable condition with a degree of 2.98 in comparison with the Farhangian which received a degree of 2.92 and Davoodi that had a 2.85 degree. . On the aspect of urban traffic, the Farhangiyan area with a 3.15 degree had better situation than Davoodi with a degree of 2.88, which showed the lowest level of the three studied areas. Yaghoub Abad also had a degree of 2.99 which occupied a moderate position among these three areas. . By using TOPSIS model, it was determined that the current situation of child-friendly city in Davoodi had unfavorable conditions with priority coefficient (0£ 0.271£ 1), and Yacobabad with a coefficient of (0£ 0.375£ 1) is somewhat favorable and the Farhangiyan had relatively more favorable conditions with coefficient priority of (0£ 0.668£ 1).
Keywords: Child-Friendly City, Participation of Children,
Urban Planning, Quchan City.
Resumo: Ambientes urbanos consistentes com a natureza
das crianças teriam uma grande participação em sua maturidade social e pessoal. A Cidade Amiga da Criança (CFC) é uma cidade na qual as crianças têm água potável e instalações sanitárias, além de poder expressar suas opiniões. Em tal cidade, as crianças podem participar nos planos urbanos. Este estudo procura comparar e contrastar diferentes áreas de Quchan, incluindo Yaghoub Abad, o Farhangian e Davoodi. Essas áreas serão analisadas com base nos indicadores desejáveis de uma cidade amiga da criança compreendendo: espaços públicos móveis urbanos, transporte e trânsito, parâmetros socioculturais. O presente estudo descritivo-analítico é baseado em pesquisas bibliográficas, pesquisas e entrevistas, utilizando o software SPSS. Um modelo de decisão (TOPSIS), também foi utilizado para avaliar e classificar as regiões estudadas. No aspecto do mobiliário urbano, os resultados mostraram que entre as áreas estudadas, o distrito de Yaghoub Abad tinha uma condição mais favorável, com um grau de 2,98 em comparação com o Farhangian, que recebeu um grau de 2,92 e Davoodi, que teve um 2,85 graus. . No aspecto do tráfego urbano, a área de Farhangiyan com 3,15 graus teve uma situação melhor do que a de Davoodi com um grau de 2,88, que apresentou o nível mais baixo das três áreas estudadas. Yaghoub Abad também teve um grau de 2,99 que ocupou uma posição moderada entre essas três áreas. . Usando o modelo TOPSIS, determinou-se que a situação atual da cidade amiga da criança em Davoodi tinha condições desfavoráveis com coeficiente de prioridade (0£0,271£1), e Yacobabad com um coeficiente de (0£ 0,375£1) é de certa forma favorável e o Farhangiyan teve condições relativamente mais favoráveis com prioridade de coeficiente de (0£ 0.668£ 1).
Palavras-chave: Cidade Amiga da Criança, Participação das
Crianças, Planejamento Urbano, Cidade Quchan.
Ph.D Candidate of Geography and Urban Planning, Mashhad Branch, Islamic Azad University, Mashhad, Iran. E-mail: aliesmaeilzade9@
mshdiau.ac.ir Department of Geography Mashhad Branch, Islamic Azad University, Mashhad, Iran. E-mail: [email protected]
Ali Esmaeilzadeh Kavaki Katayoon Alizadeh
ANÁLISE DE INDICADORES DA CIDADE
AMIGA DA CRIANÇA
(ESTUDO DE CASO: CIDADE DE
QUCHAN, IRÃ)
ANALYSIS OF INDICATORS OF
CHILD-FRIENDLY CITY
(CASE STUDY: QUCHAN CITY, IRAN)
1
2
1
Introduction
The basis of development in every country is its human resources who are capable, inventive and creative. The most valuable investment in this way would be children who have the ability of learning from the moment of their birth. Ignoring children could be ascribed as the ignorance of the most important national assets. Child-friendly cities try to grant citizenship to the children, develop their awareness, and increase public participation, decrease violence against children and pay attention to environmental issues.
The importance of urban spaces suitability for different groups who used these spaces isn’t hidden to anyone and in this regard, the main factors in forming cities i.e. urban land use, traffic and furniture are considered as important factors in assessing the suitability and utility of spaces (Mousa Kazemi, 2001). Urbanization, and the growth of population in cities, and consequently development of small towns and big cities is considered as the characteristics of the modern era. (Riggio, 2002). Several decades ago, the United Nations International Children’s Emergency Fund (UNICEF) focused on programs for rural children, as it was done in 1970s that an insightful program was done in major metropolitan areas in which another reality emerged. Immediately there were fast-growing, densely packed slums and shanty towns around (Racelis and Aguirre, 2002). McAllister (2008) have discussed that planning urban environments should consider children in two ways: planning for children, and planning with children. Playing spaces are important because they allow children in the community to interact with each other. Adequate playing spaces with sufficient playing equipments attract children to play in that spaces and therefore encourage maximum usage of that space (Latfi and Karim, 2012). Lack of an extended discussion about children in planning practices results from oversight and a strong cultural belief, in that adults know what is best for children (Knowles-Yánez, 2005). Authors mention some studies here: Mitchell et al (2007) have examined primary school children’s experiences for travelling between home and school from different areas. They investigated how children travel to school, how they would like to travel, and how their perspectives on area space vary by age, socio-economic status and school location. Their findings revealed that over half of the participants did not like the way they commuted to school. It is mostly desirable to travel independently within public space, but the participants were limited in their ability to do so, giving the information’s about fears and obstacles that prevail them within the areas. Kytta (2004) examined interrelationship between degree of independent mobility and actualization of affordances in children in the context of the child-friendly environment. Francis and Lorenzo investigated the children’s participation in city planning and designing (2002). Walking and using bicycles has decreased in recent years, as a result of increasing private vehicles, so McMillan searched to improve ways for children’s health issues (2007).
Technique for order performance by similarity to ideal solution (TOPSIS) [7] has been used in this study, one of known classical MCDM method, was first developed by Hwang and Yoon [4] for solving a MCDM problem. The basic concept of TOPSIS is that the chosen alternative should have the shortest distance from the positive-ideal solution and the farthest distance from the negative-ideal solution. For more information about TOPSIS see the followings: (Jahanshahloo et al, 2006), (Fazelniya et al, 2011), (Awasthi et al, 2011), (Maleki et al, 2012), (Chen and Tsao, 2008).
Research objectives
The major objectives of the projects in child-friendly cities can be listed as below: Creating interest in children to pursue their rights, overcoming poverty and inequality, involving children, family support, training cooperation between children and adults, encouraging adults to preserve and protect the rights of children, and increasing recreational spaces (UNICEF, 2005: 6). Accordingly, the aim of this research is to assess and evaluate public spaces in Quchan, based on needs and indicators of child-friendly.
Methodology
The research method is descriptive – analytical, based on library research, field investigation and interviews, and the data analysis was performed using SPSS software and decision making model (TOPSIS) for the evaluation and ranking of used regions , and also. For investigating opinions
from all families in the studied spaces about features of child-friendly cities, sampling was done randomly from people at the studied area. The sample comprised of 210 persons. Data gathering tool in this study was questionnaire containing various questions about indicators of child friendly city.
Introducing Variables
Variables in the field of indicators of child-friendly cities are:
a) Public spaces, including appropriating urban space that used by children: 1- Standardization of urban furniture, special furniture for children (sports, entertainment and gaming, education and health) suitable staining and etc. 2- appropriating equipment according to the age conditions of children.
b) Transportation and traffic: 1- Implementation of the project for safe routes to school (installation intelligent traffic light and warning signs). 2- Securing urban sidewalks for children. 3- Requiring the use of seat which it is special for children on public transportation.
c) Cultural and social factors: 1- Establishing baby home. 2- Establishing special centers for feeding and cleaning babies in parks, recreation centers and bus terminals. 3- Developing houses filled with toys in downtowns. 4 - Establishing baby farm “educational garden for children within the city.”
Study area
Our study site is the city of Quchan (36◦35’ – 37◦40’N, 57◦56’ – 58◦57’E) which is located in
North of Khorasan Razavi Province, 130 km from Mashhad, in north east of Iran. In 2006, Quchan’s county population was 186022 people (Statistical Center of Iran, 2006), of which 104020 people lived in urban areas and 82002 people in rural areas, Including 92,761 males and 93,261 females. Three districts; Yacobabad , the third district and Farhangiyan were selected for assessing and evaluating the suitability of urban spaces according to child-friendly city indicators. Target areas have been selected by cluster - location sampling and based on the number of people in each area. In this way, Yacobabad was selected from the first district because it had the largest population among the other areas in Quchan, and the Farhangiyan was selected from fifth district of Quchan which had the smallest population, and the third district was selected from the other three areas which had approximately equal populations to make a kind of balance according to demographics.
Results
Evaluation of urban furniture based on child-friendly city indicators
The major urban facilities which were investigated in this study include:
• Special equipment for children (sports, entertainment and gaming, education and health).
• Making courtyards, halls and health services, and other suitable equipment based on the conditions of the age of children.
• Safety in areas.
• Cleanliness of the areas, etc.
Analysis of current situation in urban furniture of Yacobabad district
According to the acquired results from the questionnaires and the extracted data from Fig (1), suitability of the urban equipment with an average (3.30), had highest value in children’s point of view. Also suitability of the location of parks and their access for children had an average 3:14; the level of cleanliness and purity in the area had an average of 3.10; which had a high moderate level. In Yacobabad district, indicator of suitability of playground for children had an intermediate level. Whereas in children’s point of view, indicator of security at night in this district was lower than average and it shows that this indicator is undesirable for Yacobabad district. The average in this district is equal to 2.98 which in total have a moderate range.
Figure 1: Situation of urban Furniture Yacobabad from children’s point of view.
Analysis of the current situation of urban furniture in Davoodi
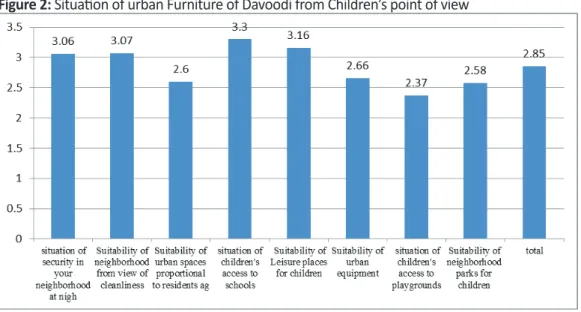
As the diagram (2) shows; children’s access to schools, in their point of view, had the best condition with averages 3.30. Lack of suitable playgrounds for children in the area had an average of 2.37, and also inappropriate access to parks and green space, had an average of 2.37, which both had the lowest amount and are lower than average, showing undesirability of this indicator in the area. The average of the area was 2.85.
Figure 2: Situation of urban Furniture of Davoodi from Children’s point of view
Analysis of the current situation of urban furniture in the area of
Farhangiyan
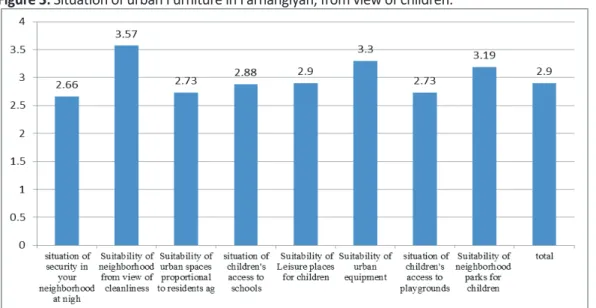
The status of suitability for children’s access to parks, in this area is of 3.47, representing this indicator is desirable. Also the access to playground for children had an amount of 3.14 which had a better status. Among the studied indicators in this area, the status of security at night had an amount of 2.33, locating this area at the lowest level. The average in this area was 2.9, which represents a moderate situation.
Figure 3: Situation of urban Furniture in Farhangiyan, from view of children.
Assessment of urban traffic and transport
In this part of the study, the public transportation for children is going to be evaluated with participation of children in Quchan.
In this research, the most important cases that are going to be investigated in connection with traffic include:
• Status of pavements • Status of security in streets • pedestrian crossing for children • public transportation system.
Assessment of urban transportion in Yacobabad district
According to Figure 4, the average amount of transportation index is 2.98. According to children’s point of view, this index is average in Yacobabad district. The highest amount among the options is 3.25 and 3.30, it is relating to children’s access to vehicles and security of sidewalks. The indicator of suitability of sidewalks based on the pavements had an amount of 2.58, which was lower than the other indicators.
The following diagram shows the status of urban transportation of Yacobabad district in parts.
Figure 4: status of traffic and transportation in Yacobabad
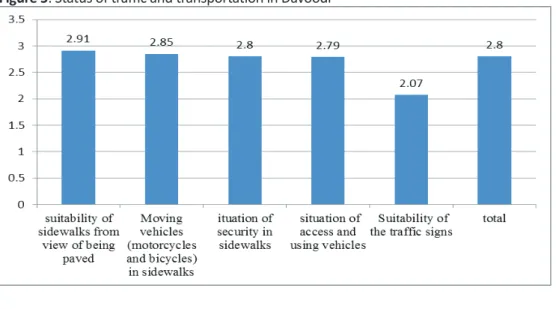
Assessment of urban transportation in Davoodi
The average of traffic and public transportation is 2.88 in Davoodi each indicator comprising existence the traffic signs, access to public transportation, security of sidewalks for children, movement of vehicles through sidewalks and paved sidewalks, were valued respectively as 3.07,
2.79, 2.80, 2.85 and 2.91.
In Figure (5), the amount of traffic in Davoodi is expressed as average.
Figure 5: Status of traffic and transportation in Davoodi
Assessment of urban transportation in the area of Farhangiyan
Research findings indicate that the suitability of surfaces in the sidewalks was of 3.52, which had the best condition and the average of traffic is equal to 3.15, in the Farhangiyan district. Figure (6), shows the traffic situation from children’s point of view in the Farhangiyan district.
Figure 6: Status of traffic and transportation in Farhangiyan
Evaluation of indicators of child-friendly city with the use of TOPSIS:
In this model, the assumption is based on the notion that desirability of each indicator is steadily increasing or decreasing. Problem solving methodology requires six steps which are explained in the following.
Converting qualitative indicators into quantitative
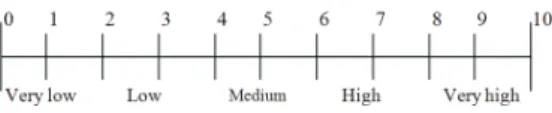
With various methods we can convert qualitative indicators into quantitative ones; but the best method is the method which uses ordinal and interval scales or bipolar scales. A general method for measuring a qualitative indicator with interval scale is using interval bipolar scale as follows:
This measure is based on an eleven-point scale in which, zero has the lowest value and ten has the maximum value. It is worth mentioning that 2, 4, 6 and 8 values are intermediate values between two other values; and values of zero and ten are rarely used. This measurement is based on these three assumptions:
• The distance between very low and low is equal to the distance between high and very high, as an example.
• It is assumed that 9 is three times more than 3 .
• Combinations of values for the various parameters are allowed; because difference between two special values for each assumed indicator is equal.
These three assumptions convert the ordinal scale into interval scale.
Table 1: Quantitative and Normalized decision matrix.
Studied areas Intervals to compare Farhangiyan Davoodi Jacobabad 1 3 5 c1= Standardization of urban furniture for children
3 5
3 c2= Suitability and access to recreational and leisure
spaces
5 5
3 c3= Situation of designing and access to training centers
based on related criteria
5 1
3 c4= Suitability of urban facilities proportional to physical
condition of children
1 1
1 c5= Social and cultural criteria
3 3
5 c6= Suitability and Access to public transportation for
children
5 1
5 c7= Suitability of streets safe for children and mothers
7 3
1 c8= The suitability of sidewalks from view of paving
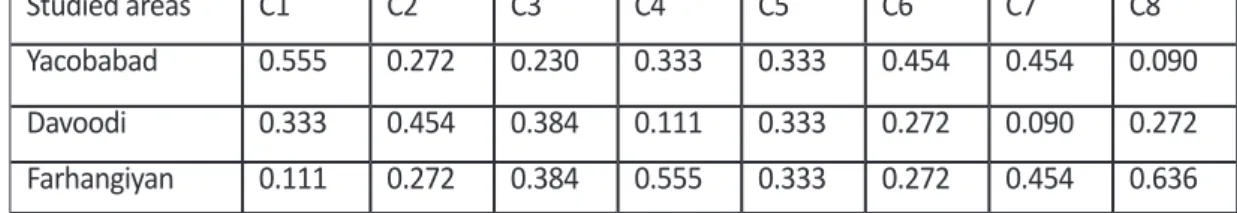
In this regard, 8 indicators of child-friendly city were evaluated initially in the study area which was a combination of the investigated parameters in this study, based on the given scores to these variables. Accordingly, the scale of 1 shows lowest rate and 9 shows the highest rate, and the qualitative scores converted to quantitative scores (table 1).
Normalization
After making quantitative indicators, in order to compare the different scales of measuring, normalization is needed in which values of various indicators are dimensionless and could be gathered. In this section, normalization is used by norm.
Equation (1):
∑
= = m i ij aij aij n 1 20
/
845
)
1
3
5
(
5
2 2 2+
+
=
=
j in
Table 2: Normalization by using norm
C8 C7 C6 C5 C4 C3 C2 C1 0.130 0.700 0.762 0.577 0.507 0.390 0.475 0.845 Yacobabad 0.390 0.140 0.457 0.577 0.169 0.650 0.762 0.507 Davoodi
0.911 0.700 0.457 0.577 0.845 0.650 0.475 0.169 Farhangiyan
Evaluation weighting of criteria (giving weight to the factors)
There are different methods for evaluating weights of criteria. In this case Shannon entropy method is chosen. In this method, the more the rate of scattering in amounts of a criteria, the more important is that criteria. For calculating entropy, first each row of decision matrix is divided to its sum.
∑
==
m i ij ij ija
a
p
1555
/
0
9
5
1
→
=
=
n
p
ijTable 3: Normalization by using norm
C8 C7 C6 C5 C4 C3 C2 C1 Studied areas 0.090 0.454 0.454 0.333 0.333 0.230 0.272 0.555 Yacobabad 0.272 0.090 0.272 0.333 0.111 0.384 0.454 0.333 Davoodi 0.636 0.454 0.272 0.333 0.555 0.384 0.272 0.111 Farhangiyan
In this formula, k is calculated as a fixed amount:
)
ln(
1
m
k =
0
.
910
)
3
ln(
1
=
=
k
In this formula, m is the number of sample areas or studied options:
)
ln
(
1 ij m i ij JK
P
P
E
∑
=−
=
We use this formula, for obtaining dj:
d
j=
1
−
0
.
852
=
0
/
148
Then amount of weight Wj is obtained as in the following:
197
.
0
751
.
0
148
.
0
=
=
=
∑
i i jd
d
W
Table 4: Normalization by using norm C8 C7 C6 C5 C4 C3 C2 C1 0.781 0.849 0.970 0.999 0.852 0.976 0.970 0.852 E J 0.219 0.151 0.03 0.001 0.148 0.024 0.03 0.148 dij 0.291 0.201 0.039 0.001 0.197 0.031 0.039 0.197 Wi
Now weighted normalization matrix could be achieved: Equation (7):
Table 5: Normalization by using norm
C8 C7 C6 C5 C4 C3 C2 C1 0.130 0.700 0.762 0.577 0.507 0.390 0.475 0.845 Yacobabad 0.390 0.140 0.457 0.577 0.169 0.650 0.762 0.507 Davoodi 0.0911 0.700 0.457 0.577 0.845 0.650 0.475 0.169 Farhangiyan
Table 6: Normalization by using norm
C8 C7 C6 C5 C4 C3 C2 C1 0.037 0.140 0.029 0.0005 0.099 0.012 0.018 0.166 Yacobabad 0.113 0.028 0.017 0.0005 0.033 0.020 0.029 0.099 Davoodi 0.265 0.140 0.017 0.0005 0.166 0.020 0.018 0.033 Farhangiyan
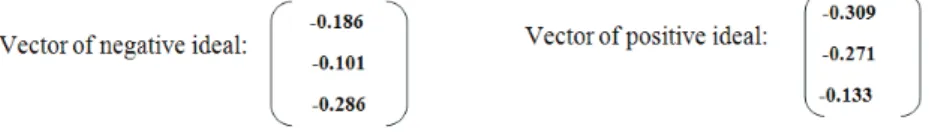
Definition of positive and negative ideal solutions
Positive ideal solution and negative ideal solution are defined as follow:
[Vector of the best values for each indicator in matrix of V] = positive ideal solution (VJ+ ) [Vector of the worst values for each indicator in matrix of V] = positive ideal solution (VJ- )
The best values for positive indicators are the largest values and the smallest values are for negative indicators. , The worst values for positive indicators are the smallest values and the largest values are for negative indicators. .
The distance between each option to the positive and negative ideal
For obtaining the distance of each option from the positive and negative ideal, the following formula was used:
Distance from the positive ideal: ij j i m j i
v
v
d
=
−
+∀
= +∑
(
)
2,
1Distance from the positive ideal: i i m j ij i
v
v
d
=
−
−∀
= −∑
(
)
2,
1The values of above matrix are computed as follows:
In TOPSIS Model,
d
j+ is positive ideal vector andd
j− is negative ideal vector. In this model, R is the distance between two positive and negative ideal vectors. The amount of R is calculated by the formula − + −+
=
dj
dj
dj
CL
1 and the resulting values are between zero and one (0 ≤ R ≤ 1).If amount of R move to Zero, it represents that the status tends to undesirable and if amount of R move to One, it represents that the status tends to desirable. By calculating values in the model, positive and negative ideals of a child-friendly city (Quchan, in the present study) are as follow:
Indicators of child-friendly cities in the study area were obtained by following formula: This showed that that the assessed indicators had undesirable situation. This is somewhat suitable in Yacobabad but Farhangiyan, had desirable conditions and it was better than the other two areas; it means that the current criteria of child-friendly city in the Farhangiyan tend towards one. According to the formula (0 ≤ R ≤ 1), the results are illustrated in the following:
Table 7: results are illustrated
Value coefficient priority region Rank
Desirable 0.668 Farhangiyan 1 somewhat desirable 0.375 Yacobabad 2 undesirable 0.271 Davoodi 3
Discussion and Conclusions
The city is desirable for children and young people, having all aspects of health development for children and young people such as education, entertainment and having relationship with the urban environment.
The final results of this study indicated that the studied areas of this research, each of them were a separate part of the city, had a suitable condition in terms of infrastructure and
necessary implementing mechanisms for making a desierable city for children. Also in terms of having appropriate criteria for children among these areas the Farhangiyan had better conditions in compare to the other two areas. In order to improve the current and increasing comfort and safety, this area and the other areas require precise and integrated planning.
Accordingly, in order to improve or at least lessen the burden of problems found in the study area, guidelines and recommendations of the study are presented below:
• Building parks and playgrounds in Davoodi.
• Building parks in the Farhangiyan area with game and entertainment facilities appropriate for children.
• Implementing approved rules and regulations in master plans for child-friendly cities. • Using children preferences in designing recreation spaces and playgrounds.
• Establishing training traffic centers in schools and public places.
• Establishing especial recreation and entertainment centers for children inside commercial centers.
The benefit of child-friendly community is the long-term sustainability of natural spaces (McAllister, 2008).
Children are spending more time indoors watching TV (Basrur, 2004) and less time interacting with the natural environment or exploring the community (McAllister, 2008).
Reference
Awasthi, Anjali. Chauhan, S.S., Goyal, S.K. (2011). A multi-criteria decision making approach for location planning for urban distribution centers under uncertainty. Mathematical and Computer Modelling. Vol 53, 98–109.
Basrur, S. (2004). Chief Medical Officer of Health Report: Healthy Weights, Healthy Lives. Ontario Ministry of Health and Long-term Care. Toronto, Ontario.
C.L. Hwang, K. Yoon. (1981). Multiple Attribute Decision Making Methods and Applications, Springer, Berlin Heidelberg.
Chen, Ting-Yu., Tsao, Chueh-Yung. (2008). The interval-valued fuzzy TOPSIS method and experimental analysis. Journal of Fuzzy Sets and Systems. Vol 159, 1410 – 1428.
Fazelniya GH., Kiani, A., Mahmodian, H. (2011). Locate and Prioritize Urban Parks Using GIS and TOPSIS Model (The Case Study: Alashtar City). Journal of Human Geography Research Quarterly, No, 78.
-Francis, Mark and Lorenzo, Ray. (2002). SEVEN REALMS OF CHILDREN’S PARTICIPATION. Journal of Environmental Psychology. Vol 22, 157-169.
Jahanshahloo, G.R., Hosseinzadeh Lotfi, F., Izadikhah, M. (2006). Extension of the TOPSIS method for decision-making problems with fuzzy data. Journal of Applied Mathematics and Computation. Vol 181, 1544–1551.
Knowles-Yánez, L. Kimberley. (2005). Children’s Participation in Planning Processes. Journal of Planning Literature. 20, 3.
Kytta, Marketta. (2004). The extent of children’s independent mobility and the number of actualized affordances as criteria for child-friendly environments. Journal of Environmental Psychology. 24, 179–198.
Latfi, Muhammad Faez Mohd and Karim, Hafazah Abdul. (2012). Suitability of Planning Guidelines for Children Playing Spaces. Procedia - Social and Behavioral Sciences 38, 304- 314.
Maleki, Saeed., Hatami, Davod., Jadidoleslam, Mahdi. (2012). An analysis on prioritizing tourism capacities of rural regions of Izeh city using TOPSIS model, Iran. International Journal of Modern Engineering Research (IJMER). Vol 2, Issue 5, 3538-3543.
McAllister, Catherine. (2008). Child Friendly Cities and Land Use Planning: Implications for children’s health. Journal of Environments. 35(3), 22-29.
McMillan, Tracy E. (2007). The relative influence of urban form on a child’s travel mode to school. Transportation Research Part A 41, 69–79.
Mitchell, Hannah., Kearns, Robin A., and Collins, Damian C.A. (2007). Nuances of neighbourhood: Children’s perceptions of the space between home and school in Auckland, New Zealand. Journal of Geoforum. Vol 38, 614–627.
Racelis, Mary and Aguirre, A. D. M. (2002). Child rights for urban poor children in child friendly Philippine cities: views from the community. Journal of Environment and Urbanization. Vol 14, 97-113.
Riggio, Eliana, (2002). Child friendly cities: good governance in the best interests of the child. Journal of Environment and Urbanization. Vol 14, 45-58.
Y.J. Lai, T.Y. Liu, C.L. (1994). Hwang, TOPSIS for MODM, European Journal of Operational Research. 76 (3), 486–500.
Recebido em 22 de novembro de 2018. Aceito em 18 de dezembro de 2018.