UNIVERSIDADE DE LISBOA FACULDADE DE CIÊNCIAS
DEPARTAMENTO DE BIOLOGIA ANIMAL
Developmental characterization of neuronal subpopulations involved in
zebrafish visual processing
Bernardo Miguel Nunes de Madeira Esteves
Mestrado em Biologia Evolutiva e do Desenvolvimento
Versão definitiva
Dissertação supervisionada por: Doutora Ruth Diez del Corral Professora Solveig Thorsteinsdottir
I
A
CKNOWLEDGEMENTS
I want to express my gratitude to D. Ruth Diez del Corral for the opportunity, supervision and guidance through the whole year, especially for the patience and time spent with me during both the best and worst times of my progression. Without the confidence that was put on me, I would not be capable of performing the task in the way I did. Thank you for letting me work with you. Also I am really grateful to Professor Solveig Thorsteinsdottir for all the advices and help with the rules and corrections.
All the Orger laboratory was also a major part in everything that happened on the making of this project. I want to thank D. Mike Orger for receiving me in the Lab and giving me the opportunity to experience the environment, discussions and processes involved in the ongoing neurosciences projects in this amazing team! An especial thanks to Alexandre Laborde and A. Lucas Martins and Miguel Paço, for the friendship and teaching me a lot about everything and helping me with both practical and motivational situations; Rita Esteves and Rita Félix for the kindness and interest in all the explanations and advices; and to Sabine Renninger, Raquel Tomás and Simone Lackner for all the teaching, sharing and help given.
I want to thank Joana Maia, Ana Catarina Mendes, Silvia Schwartz, Isaak, Antonia Groneberg, Constança Roquette and to everyone at the Champalimaud Foundation that received me with open arms and made me feel like home. Last but not least I want to express my gratitude to my partners and friends of the everyday that supported me during the last year; an especial thanks to Andreia Maia, Catarina Rato, Carolina Alves, Sara Correia and Nasser Karmali. Finally, the acknowledgements and the rest of the thesis would not be even written without the support of my family, especially my buddy Joana Oliveira. Without my close friends and family definitely it would not be the same or anything at all.
II
R
ESUMO
O sistema nervoso é composto por diversos tipos de células neuronais e gliais organizadas de forma específica de modo a executarem corretamente funções imprescindíveis para o controlo de comportamentos básicos à sobrevivência e respostas comportamentais a estímulos internos e externos. Para tal, é necessária a aquisição de identidades celulares específicas que determinarão diversas características dos circuitos neuronais como: padrões de conectividade e produção de neurotransmissores e recetores, etc. Múltiplos processos imprescindíveis para um desenvolvimento morfológico e funcional adequado estão altamente cronometrados no espaço e no tempo: indução neural, regionalização, neurogénese, migração e diferenciação neural, axonogénese, sinaptogénese e remodelação sináptica.
Os processos moleculares e celulares envolvidos no desenvolvimento encontram-se altamente conservados dentro dos vertebrados, desde os anfíbios e peixes até às aves e aos mamíferos. Em particular, o peixe zebra tem desde os anos 80 revelado ser um modelo ideal para estudos de desenvolvimento embrionário e pós-natal, particularmente no desenvolvimento visual. O seu rápido desenvolvimento, transparência e morfologia canónica dos vertebrados que apresenta desde cedo no desenvolvimento são, aliados às novas ferramentas genéticas disponíveis, grandes vantagens deste modelo animal.
No início do desenvolvimento embrionário, durante a gastrulação (5-10 horas pós-fertilização, hpf), três folhetos embrionários são gerados: endoderme, mesoderme e ectoderme. Na ectoderme, o tecido neural é induzido pela influência de um grupo de células conhecido com o organizador. As células da futura placa neural convergem para a linha média e expandem-se ao longo do eixo rostro-caudal, através de movimentos de extensão convergente. Seguidamente, ocorre a neurulação onde a placa neural sofre rearranjos e cavita para formar o tubo neural.
Desde cedo no desenvolvimento que a regionalização é importante no controlo da diferenciação e aquisição de identidades neuronais, num processo gradual. Esta regionalização é guiada por gradientes de factores parácrinos que ativam vias de sinalização que influenciam a expressão de factores de transcrições específicos. Rapidamente depois da formação do tubo neural formam-se diversas constrições dividindo a sua parte anterior (futuro encéfalo) em diferentes segmentos: prosencéfalo (o mais rostral), mesencéfalo e rombencéfalo (o mais caudal). Esta regionalização serve de base para a produção do primeiro scaffold neural num processo intitulado de neurogénese primária. Os primeiros
clusters neuronais são neurónios recém-formados derivados a partir dos clusters de progenitores neurais,
que estendem os seus axónios longitudinal e transversalmente ligando-se entre si. No 1º dia após fertilização (dpf) destacam-se: os clusters dorso-rostral e rostral (prosencéfalo), o cluster ventro-caudal (mesencéfalo) e os mais dorsais cluster epífiseal e núcleo da comissura posterior. Numa região mais caudal, neurónios reticulo espinais estendem axónios para a espinal medula, cujos corpos celulares se localizam no mesencéfalo basal ou no centro de cada rombómero (rombencéfalo).
Antes do 2º dpf, a neurogénese secundária ocorre através do crescimento do número de neurónios tendo como suporte o scaffold primário anteriormente formado, reforçando as regiões anatómicas anteriormente visíveis. Neste estádio, o sistema nervoso central anterior apresenta uma organização anatómica canónica dos vertebrados, estando dividido em: prosencéfalo, (telencéfalo e diencéfalo), mesencéfalo (tecto óptico e tegmento) e rombencéfalo (cerebelo e medula oblongata).
Nos primeiros dias de desenvolvimento do peixe zebra, a visão é crucial para a sua sobrevivência, tendo um papel fulcral na alimentação, locomoção e reconhecimento do meio e também na modelação
III e rearranjos nos circuitos neuronais. Na primeira semana, a larva é capaz de executar variados comportamentos como nadar em três dimensões, diversas manobras de fuga, predação e captura de presas, dormir e até aprender. Estes comportamentos estereotipados são baseados em estímulos visuais que são processados pela retina e enviados através de 10 retinal arborization fields para o resto do sistema nervoso central onde a informação será processada e integrada originando um output para uma resposta motora apropriada. Destes comportamentos que se iniciam no 3º dpf, quando as células ganglionares da retina alcançam e enervam os seus alvos, distinguem-se a resposta optomotora (OMR) e optocinética (OKR).
Face à movimentação de todo o ambiente, ou campo visual, o peixe responde movimentando-se no sentido contrário de modo a estabilizar a sua posição na água corrente, o qual é chamado de OMR. Por outro lado, face a um estímulo rotacional contínuo o peixe ajusta a direcção dos olhos, alternando entre movimentos oculares lentos e saccades mais rápidas, o qual é chamado de OKR. Nos últimos cinco anos foram propostos modelos para o funcionamento dos circuitos adjacentes, tendo sido identificados a área pretectal e o núcleo do fascículo medio-longitudinal (nMlf) como zonas envolvidas no processamento e integração de sinais nervosos.
Através de manipulação genética e com o avanço nas técnicas de imagiologia é agora possível ter uma perspectiva mais geral da formação de circuitos neurais. Contudo, apesar da sua vasta utilização como modelo para o estudo do desenvolvimento do sistema visual ainda existe uma grande necessidade de informação básica relativamente ao desenvolvimento dos circuitos neuronais durante os primeiros estádios do desenvolvimento. A identificação de populações neuronais e o seu papel em circuitos específicos, como no processamento visual, mantém-se crucial para aumentar o conhecimento acerca do desenvolvimento anatómico e funcional do sistema nervoso central no peixe zebra.
Uma metodologia para a identificação de populações neuronais é o uso de linhas transgénicas repórteres originadas para expressar GFP (green fluorescente protein) em populações e subpopulações específicas. Estas linhas podem conter um gene repórter (p. ex. GFP) diretamente controlado por sequências regulatórias de genes de interesse ou ter variantes de Gal4 (GFF) inseridas que em combinação com uma linha repórter UAS conduzirão à expressão de GFP nos locais apropriados.
Diversos projetos de larga escala têm permitido a geração de centenas de linhas transgénicas, já caracterizadas a nível celular, possibilitando o acesso a 70% do encéfalo larval do peixe zebra e a identificação de subpopulações dentro das diferentes subdivisões anatómicas. O mapeamento de subpopulações é tradicionalmente feito com a deteção múltipla de tipos celulares específicos utilizados como referência espacial anatómica (por ex. TH que marca o sistema catecholaminérgico), o que tem diversas limitações. A destacar, o atlas “Atlas of Early Zebrafish Brain Development” é a obra de referência do desenvolvimento neuronal embrionário e larval do peixe zebra, que intercala dados de expressão génica com encéfalos de referência anatómica, no 2º, 3º e 5º dpf.
Grandes esforços têm sido feitos para a compreensão anatómica do sistema nervoso central deste modelo animal através de whole-brain imaging de diversas linhas transgénicas e registo das imagens 3D numa mesma referência. Dois atlas 3D para o 6º dpf, Z-brain e ZBB, encontram-se disponíveis e abertos para consulta e também registo de informação 3D, contendo um canal comum com o sinal da expressão de uma proteína pan-neuronal (tERK). Apesar de representarem uma fonte aberta e poderosa de informação para o conhecimento neuroanatómico do peixe zebra, informação relativamente a estádios de desenvolvimento precoce ainda é escassa.
Diversas linhas GFP transgénicas têm sido usadas no laboratório de Mike Orger para o estudo do processamento e resposta de certas subpopulações neuronais a estímulos visuais de alteração da intensidade de luz e direcção de movimento. Com o objectivo de analisar a ontogenia de algumas destas
IV subpopulações durante o desenvolvimento, este estudo caracteriza a expressão de GFP de quatro linhas transgénicas, escolhidas pela sua expressão em estruturas anatómicas envolvidas no processamento visual, utilizando embriões e larvas de peixe zebra desde o 1º até ao 6º dpf.
Esta caracterização foi feita recorrendo a imuno-histoquímica das amostras fixadas em paraformaldeído das linhas transgénicas pitx2c:GFP, ChAT GFF, Gad1b GFF e Slc18a3b GFF. O anticorpo anti-GFP foi utilizado para detetar a expressão de GFP das linhas transgénicas em conjunto com um marcador pan-neuronal (anti-tERK) ou mais específico (anti-TH), para referência espacial.
Stacks foram adquiridos com microscopia confocal gerando diversos exemplares de encéfalos 3D para
cada estádio e linha.
A análise da expressão de GFP foi feita comparando as amostras com dados 3D relativos ao 6º dpf, Z-brain e ZBB, juntamente com imagens e representações anatómicas de encéfalos disponíveis no Atlas
of Early Zebrafish Brain Development e outra bibliografia. Para todos os estádios, de cada linha, foram
selecionadas amostras representativas, apresentadas como projecções em z dos stacks originais. A nomenclatura anatómica utilizada foi baseada na obra Atlas of Early Zebrafish Brain Development.
De um modo geral, expressão de GFP foi observada nos 6 dias de desenvolvimento em todas as linhas transgénicas utilizadas. Espacialmente, esta expressão revelou-se bem distribuída em todas as subdivisões anatómicas prosencéfalo, mesencéfalo e rombencéfalo, aumentando com o avançar do desenvolvimento. Expressão de GFP foi observada em regiões comuns às diferentes linhas, como: na área pretectal, tálamo e tubérculo posterior (diencéfalo), tecto óptico e tegmento (mesencéfalo) e medula oblongata (rombencéfalo). Como esperado, expressão de GFP foi observada em pelo menos uma estrutura anatómica envolvida nos circuitos adjacentes a OMR e OKR em cada uma das linhas transgénicas (por ex. área pretectal e nMlf).
Em suma, a caracterização da expressão de GFP de linhas transgénicas no desenvolvimento, é uma abordagem viável para a identificação anatómica de regiões de interesse envolvidas no processamento de estímulos visuais. Acreditamos que este estudo contribuiu para o conhecimento dos processos de aquisição de destinos neurais e desenvolvimento inicial dos circuitos neuronais, bem como para o delineamento e interpretação de futuras experiências de manipulação genética em estádios específicos do desenvolvimento.
Palavras-chave: Desenvolvimento; neurociências; processamento visual; peixe zebra; linhas transgénicas
V
A
BSTRACT
The nervous system is composed of a number and variety of neuronal and glial cells appropriately connected to reliably perform its functions to control basic survival behaviours (i.e.: breathing) and responses to internal and external stimuli. This requires acquisition of specific cell identities that determine properties such as correct connectivity patterns and production of neurotransmitters and receptors. For an appropriate functional and morphological development multiple processes need to occur: neural induction, regionalization, neurogenesis, migration and neuronal differentiation, axogenesis, synaptogenesis and synaptic remodelling.
Since the 80s, the zebrafish has been used as a model to analyse the formation of neuronal circuits during embryonic and postnatal development. With the advances in the field of genetics and imaging it is now possible to address the remaining doubts and lack of knowledge regarding the establishment of neuronal circuits. Due to the array of genetic tools available, its rapid development, transparency and canonical vertebrate morphology, zebrafish is the ideal model to study the development of the central nervous system. Although it has been widely used to study the development of the visual apparatus, information about neuronal circuits involved in visual processing in early stages is still lacking in the bibliography.
With the aim of studying specific subpopulations of neurons involved in visual processing, in this project we characterized selected and established GFP-expressing reporter lines through development. The characterization was done on the zebrafish developing brain of embryos and larvae from the first day post fertilization (dpf) until the sixth dpf, using immunohistochemistry and image analysis of data acquired by confocal microscopy. Our analysis identified major anatomical structures and tracts expressing GFP through the prosencephalon, mesencephalon and rhombencephalon, by comparing our data with previous bibliography and 3D atlases on anatomical characterization of gene and protein expression. The characterization and analysis of the selected lines allowed us to examine the ontogenesis of the circuits. Furthermore, it provides a reference for the delineation of further studies involving manipulation of defined circuits at the appropriate time during development.
VI
I
NDEX
Acknowledgements ... I Resumo ... II Abstract ... V Index ... VI Lists of figures and tables ... VIII Abbreviations list ... IX1 Introduction ... 1
1.1 Development of the zebrafish nervous system ... 1
1.2 Development of the visual system in zebrafish ... 3
1.3 Visually guided behaviours and underlying circuits in zebrafish ... 4
1.4 Characterization of specific neuronal subpopulations in zebrafish brain development: the use of transgenic lines ... 6
1.5 Aims of this thesis ... 7
2 Materials and methods ... 8
2.1 Animals and transgenic lines ... 8
2.2 Sample preparation and immunohistochemistry ... 9
2.3 Confocal microscopy and image analysis ... 10
3 Results ... 11 3.1 Pitx2c: GFP ... 12 3.1.1 1dpf ... 12 3.1.2 2dpf ... 12 3.1.3 3dpf ... 13 3.1.4 4dpf ... 14 3.1.5 5dpf ... 15 3.1.6 6dpf ... 16
3.1.7 Pitx2c:GFP: GFP expression summary ... 18
3.1.8 Pitx2c: GFP overview ... 18 3.2 ChAT GFF: UAS GFP ... 19 3.2.1 1dpf ... 19 3.2.2 2dpf ... 19 3.2.3 3dpf ... 20 3.2.4 4dpf ... 21 3.2.5 5dpf ... 21
VII
3.2.6 6dpf ... 22
3.2.7 ChAt GFF; UAS GFP: GFP expression summary ... 24
3.2.8 ChAt GFF; UAS GFP: GFP expression overview ... 24
3.3 Gad1b GFF: UAS GFP ... 25 3.3.1 1dpf ... 25 3.3.2 2dpf ... 25 3.3.3 3dpf ... 26 3.3.4 4dpf ... 27 3.3.5 5dpf ... 28 3.3.6 6dpf ... 29
3.3.7 Gad1b GFF; UAS GFP: GFP expression summary ... 31
3.3.8 Gad1b GFF; UAS GFP: GFP expression overview ... 31
3.4 Slc18a3b GFF: UAS GFP ... 32 3.4.1 1dpf ... 32 3.4.2 2dpf ... 32 3.4.3 3dpf ... 33 3.4.4 4dpf ... 34 3.4.5 5dpf ... 34 3.4.6 6dpf ... 35
3.4.7 Slc18a3b GFF; UAS GFP: GFP expression summary ... 37
3.4.8 Slc18a3b GFF; UAS GFP: GFP expression overview ... 37
4 Discussion ... 38
4.1 Problems and limitations to the interpretation ... 38
4.2 GFP expression in transgenic lines and “host” gene expression patterns ... 40
4.2.1 Pitx2c: GFP ... 40 4.2.2 ChAt GFF; UAS GFP ... 40 4.2.3 Gad1b GFF; UAS GFP ... 41 4.2.4 Slc18a3b GFF; UAS GFP ... 42 4.3 Future perspectives ... 42 4.4 Conclusion ... 43 5 Bibliography ... 44
VIII
L
ISTS OF FIGURES AND TABLES
Figures
pages
FIG. 1-1 ANATOMIC REFERENCE BRAINS FOR 1, 2, 3 AND 5 DPF. 3 FIG. 1-2 – THE RETINA’S NEURAL STRATIFICATION. 4 FIG. 1-3 SCHEMATIC MODEL FOR THE OKR AND OMR CIRCUITS. 5 FIG. 3-1- GFP EXPRESSION IN 1 DPF PITX2C: GFP ZEBRAFISH BRAIN. 12 FIG. 3-2- GFP EXPRESSION IN 2 DPF PITX2C: GFP ZEBRAFISH BRAIN. 13 FIG. 3-3- GFP EXPRESSION IN 3 DPF PITX2C: GFP ZEBRAFISH BRAIN. 14 FIG. 3-4- GFP EXPRESSION IN 4 DPF PITX2C: GFP ZEBRAFISH BRAIN. 15 FIG. 3-5- GFP EXPRESSION IN 5 DPF PITX2C: GFP ZEBRAFISH BRAIN. 16 FIG. 3-6- GFP EXPRESSION IN 6 DPF PITX2C: GFP ZEBRAFISH BRAIN. 17 FIG. 3-7- GFP EXPRESSION IN 1 DPF CHAT GFF; UAS GFP ZEBRAFISH BRAIN. 19 FIG. 3-8- GFP EXPRESSION IN 2 DPF CHAT GFF; UAS GFP ZEBRAFISH BRAIN. 20 FIG. 3-9- GFP EXPRESSION IN 3 DPF CHAT GFF; UAS GFP ZEBRAFISH BRAIN. 20 FIG. 3-10- GFP EXPRESSION IN 4 DPF CHAT GFF; UAS GFP ZEBRAFISH BRAIN. 21 FIG. 3-11- GFP EXPRESSION IN 5 DPF CHAT GFF; UAS GFP ZEBRAFISH BRAIN. 22 FIG. 3-12- GFP EXPRESSION IN 6 DPF CHAT GFF; UAS GFP ZEBRAFISH BRAIN. 23 FIG. 3-13- GFP EXPRESSION IN 1 DPF GAD1B GFF; UAS GFP ZEBRAFISH BRAIN. 25 FIG. 3-14- GFP EXPRESSION IN 2 DPF GAD1B GFF; UAS GFP ZEBRAFISH BRAIN. 26 FIG. 3-15- GFP EXPRESSION IN 3 DPF GAD1B GFF; UAS GFP ZEBRAFISH BRAIN. 27 FIG. 3-16 - GFP EXPRESSION IN 4 DPF GAD1B GFF; UAS GFP ZEBRAFISH BRAIN. 28 FIG. 3-17- GFP EXPRESSION IN 5 DPF GAD1B GFF; UAS GFP ZEBRAFISH BRAIN. 29 FIG. 3-18- GFP EXPRESSION IN 6 DPF GAD1B GFF; UAS GFP ZEBRAFISH BRAIN. 30 FIG. 3-19- GFP EXPRESSION IN 1 DPF SLC18A3B GFF; UAS GFP ZEBRAFISH BRAIN. 32 FIG. 3-20- GFP EXPRESSION IN 2DPF SLC18A3B GFF; UAS GFP ZEBRAFISH BRAIN. 33 FIG. 3-21- GFP EXPRESSION IN 3DPF SLC18A3B GFF; UAS GFP ZEBRAFISH BRAIN. 33 FIG. 3-22- GFP EXPRESSION IN 4 DPF SLC18A3B GFF; UAS GFP ZEBRAFISH BRAIN. 34 FIG. 3-23- GFP EXPRESSION IN 5DPF SLC18A3B GFF; UAS GFP ZEBRAFISH BRAIN. 35 FIG. 3-24- GFP EXPRESSION IN 6DPF SLC18A3B GFF; UAS GFP ZEBRAFISH BRAIN. 36
Tables
pages
TABLE 2-1- PRIMARY AND SECONDARY ANTIBODIES USED. 9 TABLE 3-1- BRAIN REGIONS SHOWING EXPRESSION: SUMMARY OF THE GFP EXPRESSION IN THE PITX2C: GFPLINE. 18
TABLE 3-2- BRAIN REGIONS SHOWING GFP EXPRESSION DURING DEVELOPMENT: SUMMARY OF THE GFP
EXPRESSION IN THE CHAT GFF UAS GFP LINE. 24
TABLE 3-3- BRAIN REGIONS SHOWING GFP EXPRESSION DURING DEVELOPMENT : SUMMARY OF THE GFP
EXPRESSION IN THE GAD1B GFF UAS GFP LINE. 31
TABLE 3-4- BRAIN REGIONS SHOWING GFP EXPRESSION DURING DEVELOPMENT: SUMMARY OF THE GFP EXPRESSION IN THE SLC18A3B GFF UAS GFP LINE.. 37
IX
A
BBREVIATIONS LIST
AB – arborization fields ABN - abducens nucleus AC – amacrine cells ac – anterior commissure cCer – corpus cerebelli Cer – cerebellum Di – diencephalon
dnHy – hypothalamus difuse nucleus dPTub – dorsal Posterior Tuberculum drc – dorsorostral cluster
dTha – dorsal thalamus ec - epiphyseal cluster
fomn - facial octavolateralis motor neurons Ha - habenula
Hy – hypothalamus LC – locus coeruleus LR - lateral rectus muscle Met – metencephalon
mlct – mediolongitudinal catecholaminergic tract mlf - mediolongitudinal fasciculus MO – medulla oblongata Mye - myelenchepalon nMlf – nucleus of the mlf OB – olfactory bulb oc – optic chiasm OE - olfactory epithelium
OmNn – oculomotor nerve nucleus P – pallium
pc - posterior comissure Pi – pineal (epiphysis)
X Po – preopctic region
poc – post-optic commissure Pr – pretectum
Pro - prosencephalon PTub – posterior tuberculum RGC - retinal ganglion cells Rho – rhombencephalon SRa – superior raphe SubP – sub-pallium Teg – tegmentum Tel – telencephalon TeO – optic tectum
TeOmb – medial tectal band TeOn – TeO neuropil
TeOsp – TeO stratum periventriculare TG - trigeminal ganglion
TH - tyrosine hydroxylase Tha - thalamus
Tpoc – tract of the postopctic comissure tronuc – trochlear nucleus
Ts – torus semicircularis (Teg) VagR – vagal region
VagusMN – vagus motor neurons vcc - ventrocaudal cluster (nucMLF) vCer – valvula cerebelli
vpni - velocity to position neural integrator vPTub – ventral Posterior Tuberculum vrc - ventrorostral cluster
vsm - velocity storage mechanism vTha – ventral thalamus
1
1
I
NTRODUCTION
1.1 D
EVELOPMENT OF THE ZEBRAFISH NERVOUS SYSTEMOne of the milestones of the development of the nervous system is the specification of a remarkable variety and number of neuronal and glial cells that, when appropriately connected, constitute the neuronal circuits responsible for all innate and non/innate behaviours. This cell type variety affects the expression of specific neurotransmitters and their receptors, synaptic modulators or presynaptic and post/synaptic connectivity patterns. From the specification of the neural progenitors to the formation of neuronal circuits, a large number of processes are highly coordinated in time and space, such as neural induction, regionalization, neurogenesis, migration, differentiation and the establishment of synaptic connections.
The basic steps and the molecular and cellular processes involved in the development of the nervous system are broadly conserved among vertebrates from amphibians and fish to birds and mammals and thus different vertebrate models have been selected for their study. The zebrafish has been used as a model system for developmental studies since the 80s because of the large clutches of over 100 embryos per mating pair, their very rapid and external development and the transparency of the embryos/larva. In addition, all the genetic and molecular tools and the wide variety of stable and reproducible transgenic lines available today makes it a great vertebrate model for developmental research purposes 1.
In zebrafish development, gastrulation starts at 5 hpf (hours post fertilization) and extends to 10 hpf, followed by the segmentation period (until 24 hpf), in which the paraxial mesoderm segments into somites (12 hpf) 2.During gastrulation, the three germ layers (endoderm, mesoderm and ectoderm) are specified along the vegetal-to-animal axis. Within the ectoderm, neural tissue is induced under the influence of a cell population known as the organizer (designated the Spemann organizer in the frog, Hensen’s node in the chick or the node in mammals) 3.
Cells of the future neural plate converge to the midline and expand along the rostro-caudal axis (RC) by convergence and extension movements. Then neurulation occurs, the neural plate gives rise to a neural rod primordium that is rearranged and cavitates to originate the neural tube, contrasting with most vertebrates where the central lumen is formed by the folding of the epithelial sheet 2,3. Shortly before the central cavity of the neural tube appears, several constrictions subdivide the neural structures into different segments along the RC axis. At 16 hpf, the first 3 swellings become prominent, giving rise to the two subdivisions of the prosencephalon (forebrain), telencephalon and diencephalon, and to the mesencephalon (midbrain). Later, at 18 hpf, 7 rhombomeres from the rhombencephalon (hindbrain) are already clearly visible and the primordium of the cerebellum starts to appear dorsally prominent in the region of the rhombomere 1, adjacent to hindbrain-midbrain boundary. Towards the end of segmentation, the diencephalon starts to expand, forming the primordial hypothalamus ventrally and the primordial epiphysis dorsally. At this stage the primordium of the central nervous system is already well delineated 2,3.
From the early stages of neural development, regionalization occurs along the rostro-caudal (from the prosencephalon to the spinal cord) and dorso-ventral (from the roof plate to floor plate) axes. This is important for both the spatio-temporal control of cell cycle exit and differentiation (which is regulated by Delta/Notch signalling) and for the acquisition of specific cells fates that allows the differentiation of many neuronal subtypes and glial cells. Regionalization is a progressive process in which the control of gene expression at the mRNA or posttranscriptional levels leads to the activation
2 of specific genetic programs, which differ depending on the location of the cells within the embryo. The organizer is involved in the early rostro-caudal regionalization of the neural tube, but the subsequent regionalization of the neural tube requires several secondary organizing centres acting through paracrine factor gradients, both along the rostro-caudal and the dorsal-ventral axis. The developing neural progenitors receive their identities by being exposed to these gradients: varying concentrations of different types of factors cause the transcription and activation of distinct transcription factors in the cells nuclei, depending on their position in the neural tube 3,4. Subsequently, neurons are subject to additional extracellular and cell-cell communication signalling at different points in their differentiation program that will further refine their identities.
The patterned neural plate serves as a basis for the organization of the primary neuronal scaffold, the first circuits formed, required for the initial embryonic and larval behaviours. This primary neuronal scaffold (Figure 1.1A) is composed of large new-born neurons derived from the earliest clusters of neuronal progenitors, the proneural clusters, in a process known as primary neurogenesis. Axonogenesis from this early neurons starts between 14 and 24 hpf, giving rise to long extended axons. The main and most clear tract is the medial longitudinal fasciculus (mlf) located ventrally in the medial line from the midbrain, across the hindbrain to the spinal cord. It contains ipsilateral and contralateral axons of midbrain and hindbrain neurons projecting into the spinal cord 3.
At the 1 day post fertilization (dpf) stage, the embryonic brain is composed of several nuclei arranged in a number of clusters. From rostral to caudal, in the prosencephalon the dorso-rostral (drc), ventro-rostral (vrc) clusters and the more dorsal epiphyseal cluster (ec) and nucleus of the posterior commissure (npc) are already observed. Longitudinal and transverse axons extend between them, connecting the clusters with each other, with the spinal cord and with the peripheral nervous system (PNS). Caudally, there are the reticulospinal neurons extending to the spinal cord that are long projecting interneurons whose cells bodies are localized in the basal midbrain (mesencephalon), where the nucleus of the mlf (nMlf) is located (originated from the ventro-caudal cluster, vcc), or in the center of each rhombomere within the hindbrain (rhombencephalon). 3 (Figure 1.1.A)
Once neurons are post mitotic, they continue their process of acquisition of specific neuronal phenotypes through the action of multiple cues and concurrent signalling pathways. Electrical activity and environmental cues seem to have a remarkable role on developmental plasticity. These environmental cues include variations in temperature, availability of nutrients, water or illumination or even some behaviours and social experience. During brain and spinal cord development spontaneous electrical activity arises in embryonic neurons, prior or during synaptogenesis. Many studies have shown the versatile and important role of this early electrical activity not only on the refinement of prepatterned circuits but also on whole nervous system development, from neurogenesis and neuronal proliferation to axonal guidance and synaptogenesis 5.
Secondary neurogenesis occurs during the embryonic and larval stages, partly overlapping, in time and space, with primary neurogenesis, building up on the primary scaffold by increasing the number of neurons in each neuronal category. Although some secondary neurogenesis starts before 2 dpf (pharyngula period: 1-2 dpf), we can state that massive overall secondary neurogenesis starts at 2 dpf. This process gives rise to the precursors of main anatomic structures within the initial primordial regions such as thalamic and hypothalamic regions from the diencephalon, developing tectum and the more ventral tegmentum from the mesencephalon, the cerebellum corpus and valvula cerebelli from the metencephalon and medulla oblongata from myelencephalon.3,6 (Fig1.1B)
In the 2 dpf zebrafish brain, the three phases of neuronal development are represented and organized in layers: ventricular (proliferative), medial (recently determined neuronal cells) and peripheral (differentiated). From 3 dpf on, differentiation increases and there is a decreasing in proliferation although it is still observed at 5 dpf. This difference of the 2 dpf brain compared to later
3 stages may be due to the rates of both proliferation and cellular migration dynamics being much higher at this time period 6.
During the hatching period (48-72 hpf) larvae continue to grow in size at the same rate as earlier but morphogenesis of the organ rudiments slows down 2. Since the hatching day, zebrafish shows a canonical vertebrate morphology, and within the first week its compact nervous system is already capable of performing a variety of visually guided actions and innate behaviours, which appear at 3 dpf when retinal ganglion cell axons reach their central targets. These largely innate and reflexive stereotyped behaviors include swimming in three dimensions, various escape manoeuvres, visually guided hunting, sleeping and even learning. 1,7
1.2 D
EVELOPMENT OF THE VISUAL SYSTEM IN ZEBRAFISHIn zebrafish, visual stimuli are initially processed by the retina, which contains a diversity of cell types and relays neuronal signals to the brain via 10 retinal ganglion cell arborization fields (AB), including the optic tectum, the largest of the AB 8. Further, signal processing and integration of the information from these arborization fields involves other parts of the brain such as the pretectal area before an output is conveyed to the parts executing the visually guided behaviours.
The development of the zebrafish retina starts with the specification of the eye field, a region between the telencephalon and the diencephalon at 10 hpf that later forms the optic cup. At 11.5 hpf the optic lobes become increasingly evident as prominent thickenings of the anterior neural keel. At 13 hpf, the posterior part of the optic lobes starts to separate from the brain and as its morphogenesis advances, there is a turnaround in their AP axis, after which the ventral surface is facing the brain and the dorsal part is facing the exterior. Cells forming the outside surface will differentiate into the neural retina and the medial layer becomes thinner and subsequently differentiates as the retinal pigmented epithelium. In the next hours, both the invagination and the thickening become increasingly more prominent, transforming the optic lobe into the optic cup. 9,10
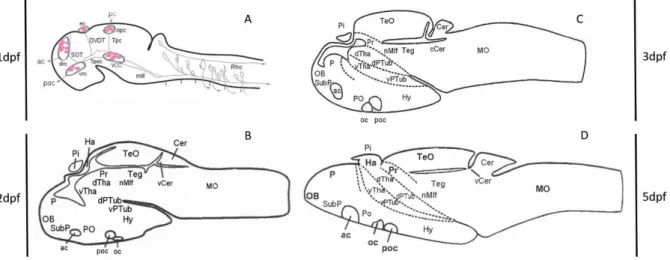
Retinal ganglion cell (RGC) precursors are the first to become post-mitotic in a small patch of ventrally located cells, nasal to the optic nerve, between 27-28 hpf. At 34-36 hpf, the first retinal axons leave the eye through the optic stalk, invading the tectum at 46-48hpf and beginning to arborize in the tectum approximately at 60hpf. At 60 hpf, neurogenesis in the central retina is almost completed and 6 Fig. 1-1 Anatomic reference 1, 2, 3 and 5 dpf brains. Schematic representation of the major anatomical regions during development in four reference brains at stages 1 (A), 2 (B), 3 (C) and 5 dpf (D), adapted from Rubenstein and Rakic, 2013 (A) and Mueller and Wullimann, 2015 (B, C and D).
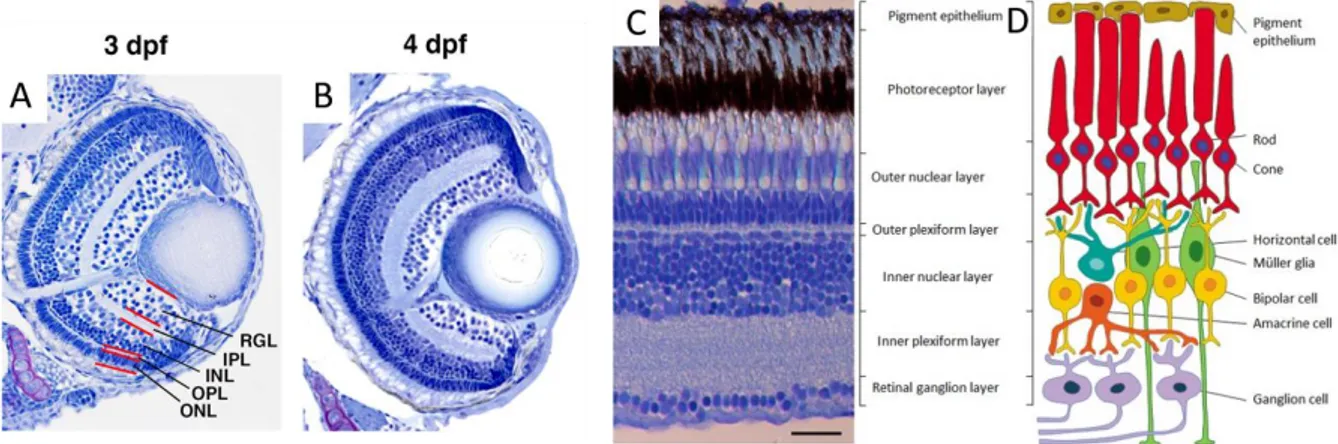
4 classes of neurons, stratified in layers, are identified: ganglion, amacrine, bipolar, horizontal, interplexiform, and photoreceptor cells (Fig1.2). At 72 hpf, retinal ganglion cell axons reach, cover and innervate the tectal neuropil. 10
Within the tectum, RGC will connect to tectal neurons. Tectal neuron-dendrite growth and synaptogenesis begin around 72hpf continuing through approximately 7dpf. Although most of the tectal dendrites have a minimal number of synapses, at 7hpf half of the neurons already display responses similar to those of the circuits of the developed tectum. From 78 hpf to 7dpf topographic map and visual field sizes undergo very little refinement.9 The connections between the topographic map of the visual field, present in the retina, and the tectum are assembled through retinal axon pathfinding, tectal cell dendrite extensions, and appropriate synapse formation. An initial arrangement of the map is thought to be due to chemical gradients that specify axonal arborization. The refinement of this initial map is characterized by the dynamics of the axon and dendrite arborization, with constant extension and retraction or elimination of nascent synapses, due to patterned synaptic activity and/or plasticity.
Note that, although there is a lot of information regarding retinal development there is still a lot do discover about the anatomical and functional development of the different structures and populations involved in visual processing within the zebrafish brain, as well as about the circuits themselves.
1.3 V
ISUALLY GUIDED BEHAVIOURS AND UNDERLYING CIRCUITS IN ZEBRAFISHIn the larval zebrafish, the first response properties (selectivity for motion/stationary and direction of stimuli) appear early in tectal development, at 72hpf, when axons of retinal ganglion cell have just covered and innervated the tectal neuropil. At this stage, zebrafish can already produce startle response and track eye movements, while visually guided hunting is only performed at 5 9. In earlier stages, vision is crucial for survival: feeding, recognition, avoiding predators and moving around their surroundings. Larvae show phototaxis by adjusting their swimming behaviour depending on temporal and spatial cues of light variation. Within these actions, we can specify two of the most studied responses: the optomotor response (OMR) and the optokinetic response (OKR). Fish respond to whole field motion pattern, which indicates the fish is moving relatively to fixed landmarks, by following the movement and stabilizing their position in the moving water (OMR). On the other hand, for continuous rotating stimuli fish adjust the direction of their eyes, alternating between slow eye movements to rapid saccades, which is called OKR. 1
Fig. 1-2 – The retina’s neural stratification. A,B: histological sections of the 3 and 4 dpf zebrafish retina, adapted from Okinawa Institute of Science and Technology Graduate University original photos. C: Microphotograph of a cross-section through the retina of an adult zebrafish, showing the different retinal layers; D: Diagram of the neural circuit of the retina, showing the six neuronal cell types and the two supporting cell types (Müller glia and retinal pigmented epithelium); C and D adapted from Gramage 2014S. Scale bar = 25μm. RGL: retinal ganglion layer; IPL: inner plexiform layer; INL: inner nuclear layer; OPL: outer plexiform layer; ONL: outer nuclear layer.
5 In recent years, efforts have been made to understand how the processing of sensorial inputs occurs in zebrafish. Based on the advances of imaging and the use of Genetically Encoded Calcium Indicators (GECI), it is now possible to have a global whole brain view of nervous system activity and function 1. These activity maps are more informative when they intersect with precise anatomical information to identify an underlying circuit. Schematic models for the circuitry underlying optomotor response and the sensorimotor processing have been proposed 8,11.
Both OMR and OKR require detection of motion and directionality. This is partly achieved within the retina involving direction selective retinal ganglion cells but also in their projections to the contralateral arborization fields (ABs), where they contact neurons from the pretectal area.
On the matter of the OKR, the input from the pretectum is conveyed to extraocular motor neurons, directly or indirectly, via circuits including a velocity storage mechanism (vsm) and velocity to position neural integrator (vpni). The response takes place when the abducens nucleus (ABN) coordinates ipsiversive eye movements via the lateral rectus muscle (LR) and sends signals (via internuclear neurons) to the contralateral oculomotor nucleus (OMN) to drive contraversive movements of the stimulated eye via the medial rectus muscle (MR).11 (Fig. 1.3)
Regarding sensorimotor processing (OMR), information from the pretectal area may be relayed to the nucleus of the medio-longitudinal fasciculus (nMlf). Both visual and olfactory information are integrated on the nMlf that sends direct motor response to the spinal cord through descending glutamatergic inputs. Significant catecholaminergic and serotonergic projections are known to surround the nMlf that can provide a source of neuromodulation.8 (Fig. 1.3)
It is worth mentioning that despite the knowledge of the circuitry underlying these behaviours, the development of its constituents downstream of the retina are still largely unknown.
Fig. 1-3 Schematic model for the OKR and OMR circuits. Adapted from Portugues et al., 2014 and Severi et al., 2014, respectively. Abbreviations: 5-HT, serotonin; MLR, mesencephalic locomotor region; OB, olfactory bulb; Pr, pretectum; PTub, posterior tuberculum; TH, tyrosine hydroxylase.
6
1.4 C
HARACTERIZATION OF SPECIFIC NEURONAL SUBPOPULATIONS IN ZEBRAFISHBRAIN DEVELOPMENT
:
THE USE OF TRANSGENIC LINESThe identification and characterization of neuronal populations and their involvement in specific circuits, such as those involved in visual processing, remains crucial to expand our knowledge on how the zebrafish brain is functionally organized.
One approach in the identification of distinct neuronal populations is the use of transgenic reporter fish lines designed to express fluorescent proteins in specific neuronal populations. These fish lines may contain reporter genes (such as GFP) directly under the control of the regulatory sequences of interesting genes or may drive the expression of Gal4 derivatives (such as GFF) that in combination with the appropriate UAS-reporter lines will drive reporter expression. Interestingly, in combination with GECI, these latter can be used to assess the neuronal response to specific stimuli.
Several large-scale projects have allowed the generation of hundreds of transgenic lines which have already been imaged at the cellular level by whole brain imaging, providing access to gene expression patterns in 70% of the larval brain and thus to numerous neuronal subpopulations that can be mapped to specific brain locations.
Mapping of neuronal populations traditionally relies on the simultaneous detection of cell types used as landmarks in anatomical annotation such as those identified by expression of neurotransmitters like GABA 12 or by expression of the tyrosine hydroxylase (TH), characteristic of the catecholaminergic neurons, already present at early stages 13,14. However, this only provides partial information on the location of cells. Major efforts have been made recently to develop methods allowing a more comprehensive anatomical characterization of specific subpopulations in the 6 dpf zebrafish brain 7,15,16. They involve the detection of a widely expressed protein (i.e. tERK) and the development of suitable algorithms that allow for the registration of individual 3D brain images into a reference brain. As a result, two atlases have been generated offering an open source database of gene expression of hundreds of transgenic lines and different antibodies together with anatomical labels, all registered into a common reference space: Z-brain and ZBB7,15.
However, although this constitutes a powerful and broadly accessible tool for the understanding of neuronal circuits for the 6 dpf, a similar characterization of zebrafish younger stages (1-5dpf) is still needed. Some data for the earlier developmental stages are available, including the major neuroanatomical expression atlas of important genetic and immunohistochemical markers in the early zebrafish 15, which offers an enormous quantity of 2-D visual data on gene expression patterns but is also compared with schematic anatomic reference brains from the 2nd to the 5th dpf. (Fig1.1B, C, D). In addition, 3-D maps of 2-4 dpf stages are included in the Virtual Brain Explorer (ViBE-Z) 17, but this has not been further developed.
For the current project, we are collaborating with M. Orger laboratory in the characterization of the expression of several GFF lines recently generated, during embryonic and early larval development. These lines, in combination with the UAS-GCaMP6, are currently being examined in M. Orger laboratory to determine the neuronal response of the GFF expressing neuronal subpopulations upon exposure of the fish to specific stimuli. Several interesting populations in the brain have been identified which respond to stimulus moving in specific directions (direction selective) and to abrupt changes in light intensity [S. Renninger and M. Orger, unpublished].
The characterization of the expression in development of both reporter lines and proteins, in particular related to circuits involved in visual processing, should provide useful information to understand acquisition of neuronal cell fates and the wiring mechanism during development. In
7 addition, it will help in the design and interpretation of experiments where they can be used to manipulate gene expression in a cell specific manner at specific times in development.
1.5 A
IMS OF THIS THESISWe aim to characterize neuronal subpopulations involved in visual processing by the use of reporter lines that drive GFP expression and therefore contribute to a better understanding of the acquisition of neuronal cell fates and establishment of neuronal circuits. For that matter we will:
1.
Examine GFP expression in zebrafish embryos and larvae from four transgenic reporter lines from the 1st to the 6th dpf, using immunohistochemistry and confocal imaging.2.
Label and identify the anatomical localization of GFP expressing cell populations by comparison with 3-D atlases and other studies on protein and gene expression.8
2
M
ATERIALS AND METHODS
2.1 A
NIMALS AND TRANSGENIC LINESThe zebrafish used were maintained by the vivarium platform at Champalimaud Research, where all aspects of fish housing essential to animal welfare, including centralized life-support system maintenance, tank cleaning and disinfection, maintenance and optimization of water quality, feeding, live feed production and nursery care are provided. The fish are maintained at the facility at 25°C, 50%-60% humidity, 14h:10h light:dark cycle with 200-300lux ambient light intensity in 3.5 l tanks containing about with 35 fish per tank and fed on rotifers, artemia and dry food daily. Fish water pH, salinity and dissolved gases are kept in physiological conditions 18.
In order to further investigate the acquisition of neuronal cell fates we used several reporter lines that show expression in subpopulations of neurons that are under study in Michael Orger’s lab for their involvement on visual stimulus processing. The three GFF lines have been generated in M. Orger´s laboratory and the other was previously generated in Wolman et al., 2008 19. The lines examined have different DNA constructs including GFP or GFF (a Gal4 derivative) inserted in their genome:
Pitx2c:GFP: previously generated 19 using an internal promoter of the pitx2 gene that specifically produces the pitx2c isoform together with the enhanced GFP (eGFP).
Tg BAC(ChAT:GFF;UAS:GFP): previously generated in Mike Orger’s laboratory (Renninger and Orger, unpublished) by transposon-mediated BAC (bacterial artificial chromosome) transgenesis. It harbours an insertion of a BAC containing the choline acetyl transferase genomic region with GFF cloned at the ChAT starting ATG.
Tg BAC(Gad1b:GFF;UAS:GFP): previously generated in Mike Orger’s laboratory (Renninger and Orger, unpublished) by transposon-mediated BAC transgenesis. It harbours an insertion of a BAC that includes the genomic region of Gad1b, which encodes the glutamate decarboxylase 1, with GFF cloned at the Gad1b starting ATG.
Tg BAC(Slc18a3b:GFF;UAS:GFP): previously generated in Mike Orger’s laboratory by transposon-mediated BAC transgenesis. It harbours an insertion of a BAC containing the solute carrier family 18 gene with GFF cloned at the Slc18a3b ATG.
The GFF lines were maintained in combination with UAS-GFP for their visualization 20, in other words, they were crossed with a UAS GFP line for the egg collection. Since zebra fish are photoperiodic in their breeding they produce embryos every morning after “sunrise”, therefore breeding males and females were put together in the same tank but separated by plastic barrier a few hours before the light period end, the day before the embryos are needed. The following day at the beginning of the light period the barrier was removed to allow fertilization and egg collection in the following hour. The embryos collected were then staged in hours after fertilization18. For our experiments we collected eggs in the range of 24 hours to 6 days post fertilization (hpf and dpf respectively) but examination of the embryos also assisted in the staging (comparisons between them and with reference brains).
After being collected in petri dishes embryos/larvae were raised at 28°C in E3 embryo medium (5 mM NaCl, 0.17 mM KCl, 0.33 mM CaCl2, 0.33 mM MgSO4, pH 7.2 RT), under 14/10 hours light/dark cycle. At 1 dpf, PTU (1-phenyl 2-thiourea) 1x was added every day to prevent the development of pigmentation.
9
2.2 S
AMPLE PREPARATION AND IMMUNOHISTOCHEMISTRYThe protocols used are modifications of those described in Inoue et al., 2011; Turner et al., 2014; Randlett et al., 2015.7,21,22
Embryos and larvae, from 1 dpf to 6 dpf, were firstly screened for GFP expression of the reporter transgenes under a fluorescence dissecting microscope and the best and brightest specimens were selected and sacrificed with tricaine1.6 mg/ml. Then, they were fixed in 4% paraformaldehyde (PFA) during two hours at room temperature and washed in PBS with 0.25% Triton (PBT). As a fraction of the fluorescence of the transgenic lines is eliminated by fixation, samples were then processed directly for whole mount immunohistochemistry.
Whole larvae were subjected to epitope retrieval by treatment with Tris HCl 150 mM pH9 at 70 °C for 15 min and then permeabilized in 0.05% Trypsin-EDTA for 5 min on ice. After blocking in blocking buffer (PBT + 1% bovine serum albumin (BSA) + 2% normal goat serum (NGS) + 1% dimethyl sulfoxide (DMSO)), samples were incubated with primary antibody recognizing GFP (Rabbit or mouse) from the collection of antibodies available in the laboratory known to label specific cell populations in the 6 dpf larvae, together with a pan-neuronal antibody, tERK (mouse) or in some cases anti-TH (Rabbit). Both anti-tERK and anti-TH were used together with anti-GFP to have as reference the position of the all brain or some landmarks, as they label all the neural cells and the catecholaminergic system, respectively. Then, samples were washed in PBT and incubated with the appropriate secondary antibody coupled to fluorescent dyes like Alexa 488 (combined with anti-GFP) and 568 (combined with anti-tERK and anti-TH). All antibodies were diluted in 1/500 µL in PBT + 1% BSA + 1% DMSO, with the exception of the anti-TH (1/100 µL). (table2.1)
Table 2-1- Primary and secondary antibodies used and respective manufacturer’s information and dilutions.
Antigen Manufacturer reference Host / Isotype RRID Dilution (µL) GFP-Tag polyclonal antibody Thermofisher: A-6455
Rabbit/ IgG AB_221570 1/500
GFP-Tag monoclonal antibody (3E6) ThermoFisher: A-11120 Mouse/ IgG2a AB_221568 1/500 Anti-Tyrosine Hydroxylase polyclonal Antibody (TH) Merckmillipore: AB152 Rabbit - 1/100 Anti-tERK antibody, p44/42 MAPK (Erk1/2) Cell signalling: 4696 Mouse IgG1 - 1/500 Anti-Rabbit IgG (H+L) polyclonal 2ary Antibody, Alexa Fluor 488 ThermoFisher: AB_143165
Goat / IgG AB_143165 1/500
Anti-Rabbit IgG (H+L) polyclonal 2ary Antibody, Alexa Fluor 568 ThermoFisher: A-11011
Goat / IgG AB_143157 1/500
Anti-Mouse IgG (H+L) polyclonal 2ary Antibody, Alexa Fluor 488 ThermoFisher: A-11001
Goat / IgG AB_2534069 1/500
Anti-Mouse IgG (H+L) polyclonal 2ary Antibody, Alexa Fluor 568 ThermoFisher: A-11004
10 After immunohistochemistry, samples were mounted on low-melting agarose (1.5% in PBS) directly on the slide, positioned the straightest way possible with their dorsal side closest to the coverslip with help of forceps and a plastic device built for this purpose. After being surrounded by a well of grease filled with PBS, the coverslip was added and the sample was ready to be imaged. 22
2.3 C
ONFOCAL MICROSCOPY AND IMAGE ANALYSISFor imaging the stained tissues we used an upright confocal laser point-scanning microscope, Zeiss LSM 710, a 25x multi- immersion objective (N.A. 0.8) in combination with the Argon Multi-line: 458 nm and DPSS: 561 nm lasers. The preparation was put on the microscope stage, fixed with modelling clay and a drop of glycerol was used as immersion medium. Using the ZEN 2010 software, focal planes were selected and the acquisition parameters (digital gain, offset and power) optimized for proper laser penetration and exposition. The whole brain was imaged at a voxel size of 1 × 1 × 2 μm (x × y × z) in a stack format. To cover the entire brain, two adjacent tiles were acquired and then stitched together.
All the image analysis was done with the open source software Fiji, where firstly the two tiles were stitched and the raw all-stack generated. To anatomically characterize GFP expression, the different samples from the different lines and stages were compared with anatomical reference brains and stacks and images from previous bibliography together with Z-brain 7 and zbb 15 atlases. Note that for the anatomical annotation on the 2 to the 5th dpf, and 6 dpf, Mueller and Wullimann 2015 and the zbb atlas 15 served as main references, respectively. Orthogonal views and 3D projections were also used to identify the anatomical regions through comparison. For presentation purposes the stacks of the chosen samples where made into z-projections, where the anatomical parts expressing GFP where clearly identified.
11
3
R
ESULTS
In order to characterize neuronal subpopulations that may be involved in visual processing and motor behaviour in the zebrafish larva throughout development, we selected three GFF lines generated in M. Orger laboratory :ChAT:GFF, Gad1b:GFF, Slc18a3b: GFF [S. Renninger, R. Tomas and M. Orger, unpublished]. These GFF expressing lines are currently being examined in the laboratory to identify neurons that are specifically active when the larvae are exposed to visual stimuli and/or performing motor behaviours. In addition, we selected a zebrafish line that has previously been described for the expression of GFP in a population of neurons involved in motor behaviour (Pitx2c:GFP).
We performed immunohistochemistry on larvae from 1st to the 6th dpf followed by confocal imaging and analysis. For immunostaining, anti-GFP antibodies were used in combination with either anti-tERK or anti-TH antibodies. The patterns obtained with the anti-tERK and anti-TH were used as reference for the identification of brain landmarks, as they reveal either all neurons or catecholaminergic neurons, respectively.
For each line and each developmental stage, the best representative samples are presented in the figures below as z-planes and z-maximum projections obtained from the original z-stacks (in Supplementary data). For the anatomical description of GFP expression (and TH expression when applicable), we follow a rostral to caudal order and separated structures from either the central (including the retina) or peripheral nervous system. The tentative assignment of the different structures is done by comparison of the original data with reference brains and gene and protein expression patterns reported in the literature and should be considered as an orientation for future work. Note that for the unknown anatomical structures, a name was created with the conjunction of the brain subdivision and a number given from rostral to caudal and dorsal to ventral (for ex. Rho1 – rhombencephalic cluster 1).
At the end of each descriptive section, the results are summarized as follows: (1) In a table: The GFP expression pattern for each line is summarized in a table of expression, where it is matched with anatomical terms and abbreviations. (2) In a written summary: A written subsection provides a general developmental overview focusing on the structures known to be involved in the OKR and OMR (in
12
3.1 P
ITX2
C:
GFP
This transgenic line genome has GFP associated with the pitx2 gene, which encodes a homeodomain protein that plays a role in the terminal differentiation of cell phenotypes and involved in the development of the eye. In addition, expression of GFP in the nMlf and mlf, important in visually evoked motor behaviour, has been previously described in the 1st dpf stage 19.
3.1.1
1dpf
At 1 dpf, within the prosencephalon, the ventro-caudal cluster (vrc) and tract of the post-optic commissure, which connects the vrc to the ventro-caudal cluster (vcc), present GFP expression.
In the mesencephalon, there is a clear pattern of expression in the vcc and the caudal most part (the developing nMlf) that extends to the fasciculus itself.
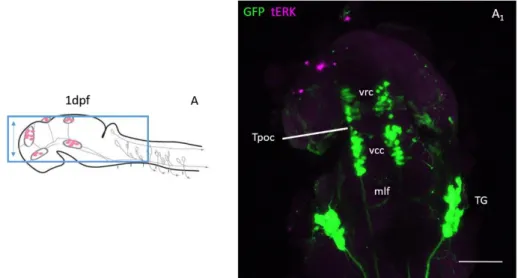
Peripherally, on both sides, strong GFP expression is observed in the trigeminal ganglia (TG), which extend thick downward projections and thinner projections to the rostral-most part of the head.(Fig. 3.1.A1)
3.1.2
2dpf
Within the diencephalon, strong GFP expression is observed in the ventral thalamus (vTha) (Fig. 3.2.B3).
In the mesencephalon, GFP expression is observed dorsally in the developing optic tectum, in some disperse cells in the stratum periventriculare (TeOsp) and in the more ventral tegmentum (Fig. 3.2.B1, 2).
GFP expression is observed in the mlf from the mesencephalon through the hindbrain, where it is almost absent (Fig. 3.2.B1-2).
Fig. 3-1- GFP expression in 1 dpf Pitx2c: GFP zebrafish brain. A, sketch of 1dpf brain area shown in A1, adapted from
Rubenstein 2017. A1, z-projection of Pitx2c: GFP 1dpf zebrafish brain after immunohistochemistry with anti-GFP (green)
and anti-tERK (magenta). The scale bar indicates approximately 100 μm. Abbreviations: mlf, medio-longitudinal fasciculus; TG, trigeminal ganglia; Tpoc, tract of the post-optic commissure; vrc, ventrocaudal cluster; vrc, ventrorostral cluster.
13 At the 2dpf stage a strong expression is observed in the peripheral trigeminal ganglia (TG) (Fig. 3.2.B2).
3.1.3
3dpf
At the 3dpf stage, GFP expression is observed in the telencephalic pallium (P) and sub-pallium (SubP) (Fig. 3.3.C3-4).
Within the diencephalon, a distinct GFP expression pattern is visible in the two radial groups of pretectal neurons, in the dorsal thalamus (dTha), posterior tuberculum (PTub) and the ventral posterior tuberculum (vPTub) (Fig. 3.3.C3, 4)
Dorsally in the mesencephalon, GFP expression is localized in the posterior commissure (pc), optic tectum neuropil (TeOn) and some cells of the stratum periventriculare (TeOsp), while ventrally it is also observed in the arrow-shaped tegmentum (where the nMlf is located) and the mlf, which extends to the hindbrain. (Fig. 3.3.C1-3)
Caudally, GFP expression is localized in the cerebellum (Cer), and in two rostral clear groups of cells and the stripes of developing vagus motor neurons (vagus MN) of the medulla oblongata.
Trigeminal ganglia and their projections still show a clear GFP expression pattern as in the previous stages, as shown in Fig. 3.3.C3-4.
Note that for this sample the anti-TH antibody was used. In panels C1-4, TH expression is observed in the olfactory bulb (OB), in some medial pretectal cells, locus coeruleus (LC) and in several neurons of the vagal region.
Fig. 3-2- GFP expression in 2 dpf Pitx2c: GFP zebrafish brain. B, sketch of 2dpf brain area shown in B1-3. B1-3, z-projection
of Pitx2c: GFP 2dpf zebrafish brain after immunohistochemistry with anti-GFP (green) and anti-tERK (magenta). The scale bars indicate approximately 100 μm. Abbreviations: mlf; medio-longitudinal fasciculus; Teg, tegmentum; TeO, optic tectum; TeOsp, optic tectum stratum periventriculare; vTha, ventral thalamus.
14 3.1.4
4dpf
At 4 dpf, in the telencephalon, GFP expression is observed in the pallium (P) and sub-pallium (SubP), and the more ventral anterior commissure (ac) (Fig. 3.4.D2-4).
Within the diencephalon, GFP expression is observed (from dorsal to ventral) in the posterior commissure (pc), some pretectal and thalamic cells (Pr and Tha), the posterior tuberculum (PTub), preoptic region (PO) and hypothalamus (Hy).
In the mesencephalon, tectal expression is observed in posterior commissure (pc) the neuropil (TeOn), some cells in the stratum periventriculare (TeOsp), the tegmentum (Teg, where is located the nMlf) and torus semicircularis (TS)(Fig. 3.4.D1-3).
Caudally, there is an unclear GFP expression pattern through the medulla oblongata (MO) (Fig. 3.4.D3).
Peripherally, trigeminal ganglia and their projections show a clear GFP expression (Fig. 3.4.D 3-4).
In this case the anti-TH antibody was used and its expression is observed through the olfactory bulb (OB), dopaminergic clusters within the hypothalamus (Hy) and many neurons of the vagal region. Fig. 3-3- GFP expression in 3 dpf Pitx2c: GFP zebrafish brain. C, sketch of 3dpf brain area shown in C1-4. C1-4, z-projection
of Pitx2c: GFP 3dpf zebrafish brain after immunohistochemistry with anti-GFP (green) and anti-TH (magenta). The scale bars indicate approximately 100 μm. Abbreviations: Cer, cerebellum; dTha, dorsal thalamus; LC, locus coeruleus; mlf, medio-longitudinal fasciculus; MO, medulla oblongata; nMlf, nucleus of the mlf; OB, olfactory bulb; Teg, tegmentum; TeOsp, optic tectum stratum periventriculare; TeOn, optic tectum neuropil; P, pallium; pc, posterior commissure; Pr, pretectum; PTub, posterior tuberculum; SubP, sub-pallium; TG, trigeminal ganglia; Vagus MN, vagus motor neurons; Vag Reg, vagal region; vPTub, ventral posterior tuberculum.
15 3.1.5
5dpf
At 5dpf, there is some GFP expression in the pallium and sub pallial projections (Fig .3.5.E2-3) that connect to the anterior commissure (Fig .3.5.D4).
In the diencephalon, GFP expression is observed (from dorsal to ventral) in the lateral region of the pretectum (Pr) (Fig .3.5.E2), dorsal thalamus (dTha), posterior tuberculum (PTub) and hypothalamus (Hy) (Fig .3.5.E3-4).
In the mesencephalon, there is localized GFP expression in the posterior commissure (pc), optic tectum neuropil (TeOn) and in some neurons of the stratum periventriculare (TeOsp), while the more ventral tegmentum (Teg, where nMlf is located) is massively labelled with anti-GFP. (Fig .3.5.E1-3). GFP expression can be also observed through the mlf.
Caudally, GFP expression can be observed in the cerebellum (Cer) and, within the medulla oblongata, in the anterior region and in the vagus motor neurons (vagusMN) (Fig .3.5.E2-3).
In this case the anti-TH antibody was used and, as shown in panels E1-4, its expression can
be observed in the olfactory bulb (OB), pretectal cells, dopaminergic clusters within the hypothalamus (Hy), vagal region, and mlct.
Fig. 3-4- GFP expression in 4 dpf Pitx2c: GFP zebrafish brain. D, sketch of 4dpf brain area shown in D1-4. D1-4, z-projection of Pitx2c: GFP 4dpf zebrafish brain after immunohistochemistry with anti-GFP (green) and anti-TH (magenta). The scale bars indicate approximately 100 μm. Abbreviations: ac, anterior commissure; Cer, cerebellum; Hy, hypothalamus; LC, locus coeruleus; mlf, medio-longitudinal fasciculus; MO, medulla oblongata; nMlf, nucleus of the mlf; OB, olfactory bulb; P, pallium; Teg, tegmentum; TeOn, optic tectum neuropil; Tha, thalamus; P, pallium; pc, posterior commissure; Pr, pretectum; PTub, posterior tuberculum; SubP, sub-pallium; TG, trigeminal ganglia.
16 3.1.6
6dpf
At 6dpf, within the telencephalon GFP expression is observed in the pallium (P), sub-pallium (SubP) and the more ventral anterior commissure (ac). (Fig .3.6.F2-4)
In the diencephalon, two radial groups of pretectal cells (Pr), the thalamus (Tha), posterior tuberculum (PTub), and hypothalamic difuse nucleus (dnHy) show GFP expression.
In the mesencephalon, localized GFP expression is observed in the tectum neuropil (TeOn), in some cells of the stratum periventriculare (TeOsp) and in several distinct groups of the most ventral tegmentum (Teg): nucleus of the mlf, oculomotor nerve nucleus (OmNn) and trochlear nucleus (tronuc) (Fig .3.6.F3).
Caudally, some cells in the cerebellum (Cer), anterior (superior raphe, SRa) and vagal regions of the medulla oblongata (OB) show GFP positive immunoreactivity (Fig .3.6.F1-2).
In this stage (sample) the anti-TH was used instead of the anti-tERK, to visualize the olfactory bulb (OB), prectectal cells (Pr), dopaminergic clusters within the hypothalamus (Hy) and vagal region. Fig. 3-5- GFP expression in 5 dpf Pitx2c: GFP zebrafish brain. E, sketch of 5dpf brain area shown in E1-4. E1-4, z-projection
of Pitx2c: GFP 5dpf zebrafish brain after immunohistochemistry with anti-GFP (green) and anti-TH (magenta). The scale bars indicate approximately 100 μm. Abbreviations: ac, anterior commissure; Cer, cerebellum; dTha, dorsal thalamus; Hy, hypothalamus; LC, locus coeruleus; mlf, medio-longitudinal fasciculus; mlct, medio longitudinal cathecolaminergic tract; MO, medulla oblongata; nMlf, nucleus of the mlf; OB, olfactory bulb; P, pallium; pc, posterior commissure; Pr, pretectum; PTub, posterior tuberculum; SubP, sub pallium; Teg, tegmentum; TeOn, optic tectum neuropil; TG, trigeminal ganglia; Vagus MN, vagus motor neurons; Vag Reg, vagal region;
17 Fig. 3-6- GFP expression in 6 dpf Pitx2c: GFP zebrafish brain. F, sketch of 6dpf brain area shown in F1-4. F1-4, z-projection
of Pitx2c: GFP 6dpf zebrafish brain after immunohistochemistry with anti-GFP (green) and anti-TH (magenta). The scale bars indicate approximately 100 μm. Abbreviations: ac, anterior commissure; Cer, cerebellum; dnHy, hypothalamus difuse nucleus; LC, locus coeruleus; mlf, medio-longitudinal fasciculus; mlct, medio longitudinal cathecolaminergic tract; MO, medulla oblongata; nMlf, nucleus of the mlf; OB, olfactory bulb; OmNn, oculomotor nerve nucleus; P, pallium; pc, posterior commissure; Pr, pretectum; PTub, posterior tuberculum; SubP, sub pallium; SRa, superior raphe; Teg, tegmentum; TeOn, optic tectum neuropil; Tha, Thalamus; TG, trigeminal ganglia; tronuc, trochlear nucleus; Vag R, vagal region;
18 3.1.7
Pitx2c:GFP: GFP expression summary
3.1.8
Pitx2c: GFP overview
From early in development a characteristic GFP expression pattern is observed in the developing diencephalon (vrc) and mesencephalon (vcc) and mlf.
In the telencephalon, GFP expression is observed in the pallium and sub-pallium, while in the diencephalon, it is observed in radial pretectal groups and in the ventral-most diencephalic regions.
During development in the mesencephalon, GFP expression is observed in sparse tectal neurons and ventrally in a great area of the tegmentum (where the nMlf nucleus is clearly labelled, as the
oculomotor nerve nucleus).
Caudally, GFP expression is observed in the cerebellum, while in the medulla oblongata it is localized only in some groups of anterior myelencephalic neurons and in the vagal region.
From the first day of development the peripheral trigeminal ganglia and their anterior and posterior projections show strong GFP expression.
Brain subdivision Expression Abbreviations
Telencephalon
Pallium, sub-pallium and anterior commissure.
ac; SubP; SubP;
Diencephalon
Pretectum, thalamus, posterior tuberculum, preoptic region, hypothalamus. Hy; PO; Pr; PTub; Tha; Mesencephalon
Some neurons of the optic tectum neuropil and stratum periventriculare, posterior commissure, tegmentum (nucleus of the mlf, oculomotor nerve nucleus and trochlear nucleus) nMlf; OmNn; pc; Teg; TeO; TeOn; TeOsp; tronuc;
Metencephalon Cerebellum. Cer;
Myelencephalon
Some neurons in the medulla oblongata in the superior raphe and the vagus motor neurons.
SRa; MO; VagusMn;
PNS Trigeminal ganglia and its
projections.
TG; Retina No specific pattern observed.
Table 3-1- Brain regions showing expression: summary of the GFP expression in the Pitx2c:GFP line providing a list of anatomical regions and its abbreviations, excluding the most primordial structures.
19
3.2 C
HAT
GFF:
UAS
GFP
This transgenic line genome harbours an insertion of a BAC containing the choline acetyl transferase genomic region with GFF cloned at the ChAT starting ATG. GFP expression was previously observed in the 6 dpf within the pretectum, preoptic region and thalamus/posterior tuberculum in M. Orger’s lab.
3.2.1
1dpf
At 1 day fertilization (dpf), within the prosencephalon, GFP is observed both in the post-optic commissure (poc) and the presumptive ventro-rostral cluster (vrc). Strong GFP expression is observed in the ventro-caudal cluster (vcc, within the mesencephalon), the medio-longitudinal fasciculus (mlf), and the tract of the posterior commissure (pc) that extends from the vcc (Fig. 3.7.A1).
In the peripheral nervous system (PNS), some disperse cells of the olfactory placode are also strongly labelled (OE).
This pattern was very consistent between the different imaged fish (see Supplementary data).
3.2.2
2dpf
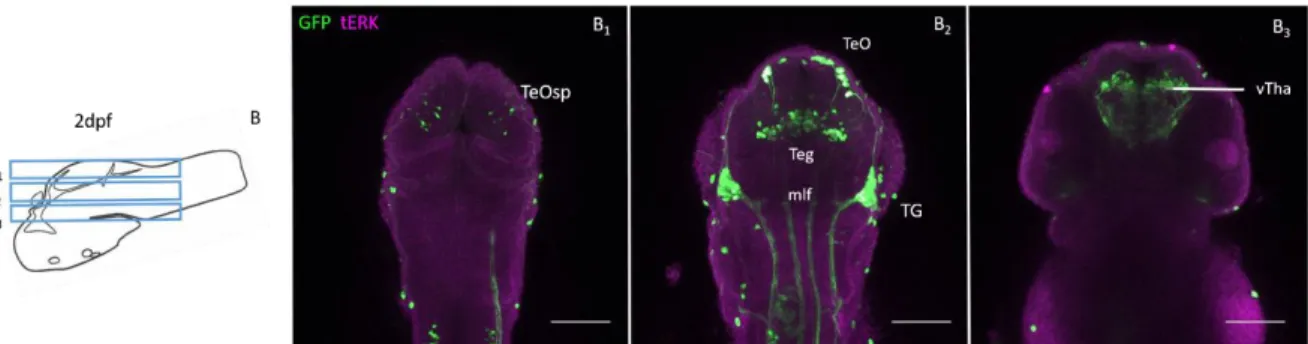
At the 2 dpf stage, GFP expression is found in some groups of glomerular shaped cells located in the ventral prosencephalon, in the region corresponding to the olfactory bulb (OB) (Fig. 3.8.B3).
Caudally, within the diencephalon, strong GFP expression is observed in cells distributed in a region that includes (from dorsal to ventral) the pretectum (Pr), ventral thalamus (vTha), and the posterior tuberculum (PTub), while the hypothalamus (located further ventrally) shows a dimmer signal close to the optic chiasm (oc) (Fig. 3.8.B2-3).
The developing retina (Ret) and optic nerve also show a strong GFP signal (Fig, 3.8.B3).
Fig. 3-7- GFP expression in 1 dpf ChAT GFF; UAS GFP zebrafish brain. A, sketch of 1dpf brain area shown in A1, adapted from Rubenstein 2017. A1, z-projection of Chat GFF; UAS GFP 1dpf zebrafish brain after immunohistochemistry with
anti-GFP (green) and anti-tERK (magenta). The scale bar indicates approximately 100 μm. Abbreviations: melf, medio-longitudinal fasciculus; OE, olfactory epithelium; pc, posterior commissure; poc, post optic commissure; vcc, ventro-caudal cluster; vrc, ventro-rostral cluster.