PORTUGUESE JOURNAL OF MANAGEMENT STUDIES, VOL. XIV, NO. 3, 2009
School of Economics and Management TECHNICAL UNIVERSITY OF USBON
BASEL II: OPERATIONAL RISK MEASUREMENT
IN THE PORTUGUESE BANKING SECTOR
Gua/ter Couto
Department of Economics and Management, and CEEApiA, University of the Azores, Portugal
Kevin Medeiros Bulhoes
Department of Economics and Management, University of the Azores, Portugal
Abstract
The present work focuses on one of the principal themes associated with the New Basel Accord -operational risk and its respective methodologies for calculating minimum capital requirements. The new capital accord encourages financial institutions to gradually evolve from basic to sophisticated methodolo-gies. Institutions applying sophisticated methods will be rewarded with deductions on capital allocated when calculating the capital ratio. The methodologies related to operational risk will be applied to a group of national banking institutions. These methodologies are referred to in Pillar I of the new capital accord: (i) the basic indicator approach, (ii) the standardized approach and (iii) the alternative standardized ap-proach. The purpose of this practical application is to evaluate and quantify the impact on several national banks of the different approaches linked to operational risk, introduced by Basel II.
JEL Classification: G 14, G21, G28, G32.
Key words: Basel II, Operational Risk, Regulatory Capital and Economic Capital.
I. INTRODUCTION
The present work briefly describes the general idea of the New Basel Capital Accord, also referred to as Basel II, focusing specifically on one of its new main themes - operational risk.
The main objectives of Basel II are to maintain international stability in the banking system and to create a unique methodology for calculating minimum
PORTUGUESE JOURNAL OF MANAGEMENT STUDIES, VOL. XIV, NO. 3, 2009
capital requirements for internationally active banks. With complex and consecu-tive transformations taking place in the banking sector, the new capital accord is adapted to the modern banking reality, strengthening the minimum capital requirements in financial institutions. The ongoing transformations in the bank-ing sector led to the emergence of different types of losses, which diverged from losses due to traditional risks, thus giving rise to operational risk.
This work investigates the benefits of the application of different methodolo-gies introduced by Basel II for operational risk in the Portuguese banking sector. We intend to evaluate the impact of more sophisticated methodologies against a basic one, registering both the advantages and disadvantages.
The remainder of the paper is organized as follows. Section 2 presents some existing literature on operational risk, section 3 explains the methodologies for calculating the minimum capital requirements for operational risk, section 4 de-scribes the empirical application of the methodologies developed by the BCBS, and concluding remarks are provided in section 5.
II. LITERATURE REVIEW
Basel II, ensures that the minimum capital requirements in financial institu-tions are sufficient to maintain bank stability. These minimum requirements can be calculated by several risk sensitive methodologies, stimulating a more efficient risk management in banks. Basel II, besides the objectives previously mentioned, has also introduced the following aims:
1. To improve risk measurement and management, keeping adequate levels of liquidity and solvency;
2. To approximate regulatory capital to economic capital;
3. To increase the dialogue between the national supervisor and the financial institutions, with regard to risk measurements and management; and 4. To increase market discipline, bank transparency and financial information.
The New Basel Accord aims at converging economic capital and regulatory capital. The use of more sophisticated methods for calculating an institution's risk will be rewarded with lower levels of capital (IFB, 2006). The previous President of the Basel Committee, Jaime Caruana, intended that the more risk sensitive the methodology is for calculating minimum capital requirements, the better adjusted the regulatory capital will be to the institution's risks, approximating economic capital.
Basel II was implemented on January 1, 2007 in the GlO countries. It is built on three pillars as can be observed in Figure 1.
PORTUGUESE JOURNAL OF MANAGEMENT STUDIES, VOL. XIV, NO. 3, 2009 FIGURE 1
Basel II Pillars
Basel II Framework
)
I
I
I
I
PILLAR I: PILLAR II: PILLAR Ill:
Minimum Capital Supervisory Review Market Discipline
Requirements Process
Pillar I ensures that banking institutions hold minimum capital requirements, sufficient to cover all existing risks. In Pillar II, the national supervisor, Banco de Portugal, must ensure that all national banks have sufficient minimum capital to face all incurred business risks. The national supervisor must also stimulate the development of techniques that could improve risk management in banks. Lastly, Pillar Ill of the New Basel Accord ensures that there is transparency in the financial situation and solvency of the institutions, allowing the market to create a more precise analysis of bank profiles and risks, applying incentives to fortify financial institutions' risk management and levels of capital (IFB, 2006).
According to Chorafas (2005), although the concept of operational risk has only appeared now, occurrences associated with this type of risk have existed in financial institutions for a long time. Fontnouvelle eta/. (2003), refers to the importance of operational risk in regulatory capital, claiming that the minimum capital requirements for operational risk can, in some cases, have a greater influ-ence than capital requirements for market risk.
The BCBS, as expressed in its documents, defines operational risk as the risk of loss resulting from inadequate or failed internal control, human resources and systems or from external events, including legal risk (BCBS, 2006). In line with the Basel II framework, Banco de Portugal in Aviso n.0 3/2006 defines
operation-al risk as the risk of losses as a result of the inadequate or negligent application of internal procedures, human resources and systems or from external causes.
Similar to what happens with credit risk, financial institutions will be able to choose between three methods for calculating the minimum capital require-ments for operational risk, each more sophisticated and risk sensitive than the one before (IFB, 2006).
PORTUGUESE JOURNAL OF MANAGEMENT STUDIES, VOL. XIV, NO. 3, 2009
the simplest. Capital charge is a fixed percentage of the average annual gross income over the last three years, as indicated by the BCBS. In the standardized approach (TSA), institutions must map their activities in eight distinct business lines (BL). In this situation, the annual gross income for each BL is multiplied by a specific {3, associated with each activity. Finally, in the advanced measurement approach (AMA), institutions will be able to use internal models with the capacity to measure operational risk and the capital to be allocated.
In the search for information based on operational risk, the Risk Manage-ment Group (RMG), a specific branch of the BCBS, obtained data from 89 finan-cial institutions from 19 countries in Europe, North and South America, Asia, and Australia. These data were treated on order to gather information concerning operational losses during 2001, capital allocated for operational risk, and the expected operational losses associated with each bank's BL (RMG, 2003). The investigation by the RMG made it possible to conclude that the banking sector is evolving quickly with regard to the gathering of data for operational risk purposes. On the other hand, financial institutions are still developing internal models for this purpose (RMG, 2003).
Moscadelli (2004) used the data collected by the RMG in 2002, and treated these data statistically. He obtained a relationship between the average gross income and capital charge for each BL. This contribution makes it possible to calculate the average gross income for each BL, as these values can still be very difficult obtain through a financial institution's annual report. Both authors, Fontnouvelle eta/. (2003) and Moscadelli (2004), concluded that there are two obstacles when analyzing operational losses. First, the quality of the extracted data can be dubious, and second, there are operational losses that are not regis-tered by the financial institutions.
Sundmacher (2004) begins his work with the idea that there are advantages to applying a more advanced methodology, that is to say less capital will be al-located for operational risk, as referred to by the BCBS. Yet the author questions the case where a bank generates activities primordially with superior {3 's. In this case, the institution will have to allocate more capital when using TSA than the BIA, there being no incentives to develop advanced models for operational risk. Sundmacher (2004) concluded that there should be a system of rewards, that is, an incentive for financial institutions to progress and develop advanced meth-odologies.
PORTUGUESE JOURNAL OF MANAGEMENT STUDIES, VOL. XIV, NO. 3, 2009 dmacher (2007) distributed the annual gross income equally into the eight BL, elaborating different scenarios.
This author concluded that the financial incentive to evolve from the BIA to the TSA was minimal. Of the three elaborated scenes, only in one situation were there benefits in evolving from the BIA to TSA, thus challenging the concept that the application of a more sophisticated method consumes less capital.
The following section presents the methodologies for calculating the mini-mum capital requirements for operational risk based on the concepts of the BCBS.
Ill. METHODOLOGY
Basic Indicator Approach
According to BCBS (2006), the capital requirements for operational risk is equal to the average over three years of a fixed percentage of the annual Gross In-come (GI) denoted as a. Gl is defined as net interest income plus net non-interest income. After concluding the Quantitative Impact Studies (QIS), the Basel Com-mittee fixed a at 15%. The BIA is expressed as follows:
KBIA = GI x a
(1)
where:
K81A = the capital charge under the Basic Indicator Approach;
Gl = average annual gross income, where positive, over the previous three years;
a
=
15%.The BIA does not consist of any specific criteria to be eligible for applying; however, banks are encouraged to comply with the committee's guidance on
Sound Practices for the Management and Supervision of Operational Risk (Feb-ruary of 2003) (BSBC, 2006).
The Standardized Approach
As stipulated by the BCBS (2006), this method foresees that banks' activi-ties are mapped into eight specific BL. Each BL is assigned a factor denoted as (3,
PORTUGUESE JOURNAL OF MANAGEMENT STUDIES, VOL. XIV, NO. 3, 2009 TABLE 1
Business Lines and {J Factors
BL {J
Corporate Finance (/3
1) 18%
Trading and Sales (/3
2) 18%
Retail Banking (/33) 12%
Commercial Banking (/3
4) 15%
Payment and Settlement (/3
5) 18%
Agency Services (/3
6) 15%
Asset Management (/37) 12%
Retail Brokerage (/3
8) 12%
Source: BCBS (2006)
The factor f3 for each BL was previously defined by the Basel Committee, and reflects historical operational losses. The capital charge for TSA is the sum of Gl per BL, multiplied by its respective {3. TSA can be expressed by the following equation:
(2)
where:
KrsA
=
the capital charge under the Standardized Approach;Gli
=
annual gross income in a given year, as defined above in the BIA, for each of the eight BL, wherei=
1, 2, 3 ... 8;f3i
=
a fixed percentage, set by the Committee for each of the eight busi-ness lines, wherei=
1, 2, 3 ... 8.The Alternative Standardized Approach
PORTUGUESE JOURNAL OF MANAGEMENT STUDIES, VOL. XIV, NO. 3, 2009
two BL by applying a f3 of 15%. The capital charge can be expressed by the fol-lowing equation:
(3)
where:
KAsA =the capital charge under the Alternative Standardized Approach; Gl; = annual gross income in a given year, as defined above in the BIA,
for each of the eight BL, where i = 1, 2, 3 ... 8;
f3; = a fixed percentage, set by the Committee for each of the eight business lines, where i= 1, 2, 3 ... 8;
f3Rs;cs = a fixed percentage, set by the Committee for each BL, retail bank-ing and commercial bankbank-ing, where i= 1, 2, 3 ... 8;
LARs;cs = loans and advances (average of the last three years) for retail and commercial banking;
m
=
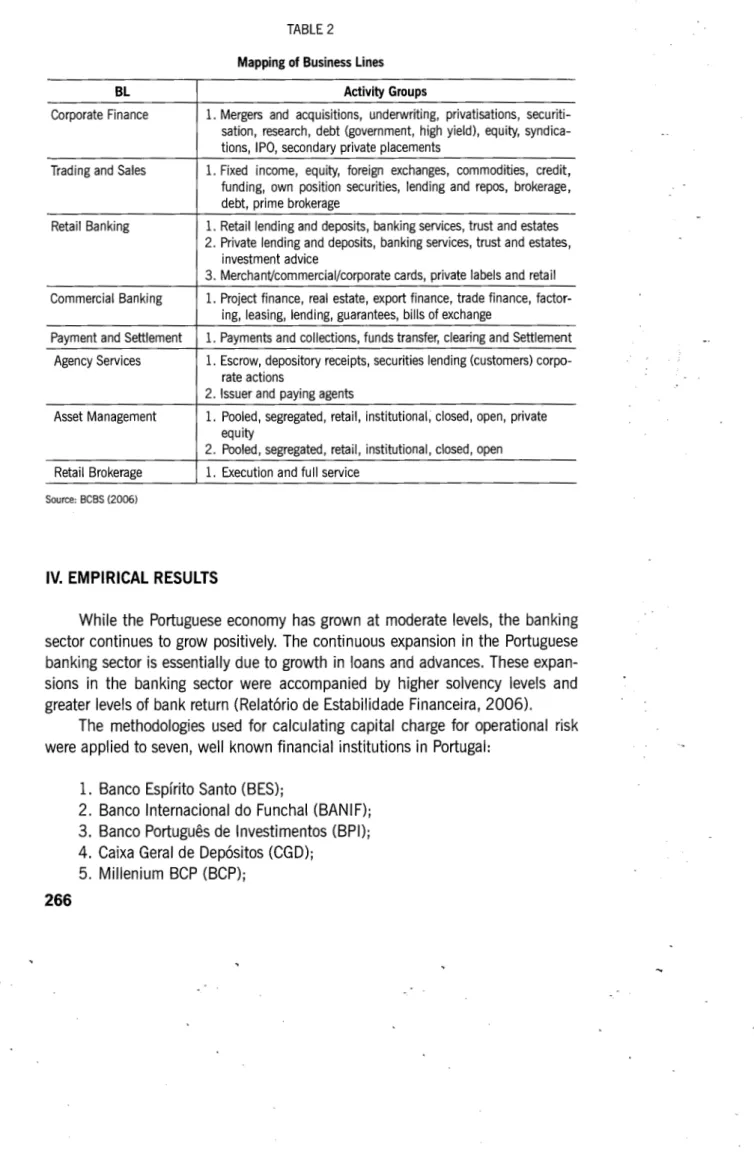
3,5%.For TSA and ASA, it is of great importance to correctly classify an institu-tion's activities in their respective BL, as shown in Table 2.
Advanced Measurement Approach
This last method foresees that financial institutions elaborate an internal operational risk measurement system using quantitative a qualitative criteria. In-stitutions will calculate capital charge as the sum of expected losses (EL) and unexpected losses (UL).
The following equation expresses how to calculate capital charge under de AMA:
KAMA=
L
(EL + UL)where:
KAMA = the capital charge under the Advanced Measurement Approach; EL = Expected Losses;
UL = Unexpected Losses.
PORTUGUESE JOURNAL OF MANAGEMENT STUDIES, VOL. XIV, NO. 3, 2009 TABLE 2
Mapping of Business Lines
BL Activity Groups
Corporate Finance 1. Mergers and acquisitions, underwriting, privatisations, securiti-sation, research, debt (government, high yield), equity, syndica-tions, IPO, secondary private placements
Trading and Sales 1. Fixed income, equity, foreign exchanges, commodities, credit, funding, own position securities, lending and repos, brokerage, debt, prime brokerage
Retail Banking 1. Retail lending and deposits, banking services, trust and estates 2. Private lending and deposits, banking services, trust and estates,
investment advice
3. MerchanVcommercial/corporate cards, private labels and retail
Commercial Banking 1. Project finance, real estate, export finance, trade finance, factor-ing, leasfactor-ing, lendfactor-ing, guarantees, bills of exchange
Payment and Settlement 1. Payments and collections, funds transfer, clearing and Settlement
Agency Services 1. Escrow, depository receipts, securities lending (customers) corpo-rate actions
2. Issuer and paying agents
Asset Management 1. Pooled, segregated, retail, institutional, closed, open, private equity
2. Pooled, segregated, retail, institutional, closed, open
Retail Brokerage 1. Execution and full service
Source: BCBS (2006)
IV. EMPIRICAL RESULTS
While the Portuguese economy has grown at moderate levels, the banking sector continues to grow positively. The continuous expansion in the Portuguese banking sector is essentially due to growth in loans and advances. These expan-sions in the banking sector were accompanied by higher solvency levels and greater levels of bank return (Relat6rio de Estabilidade Financeira, 2006).
The methodologies used for calculating capital charge for operational risk were applied to seven, well known financial institutions in Portugal:
1. Banco Espfrito Santo (BES);
2. Banco lnternacional do Funchal (BANIF); 3. Banco Portugues de lnvestimentos (BPI); 4. Caixa Geral de Depositos (CGD);
PORTUGUESE JOURNAL OF MANAGEMENT STUDIES, VOL. XIV, NO. 3, 2009 6. Montepio Geral (MG);
7. Sistema lntegrado CrE§dito Agricola Mutuo (SICAM).
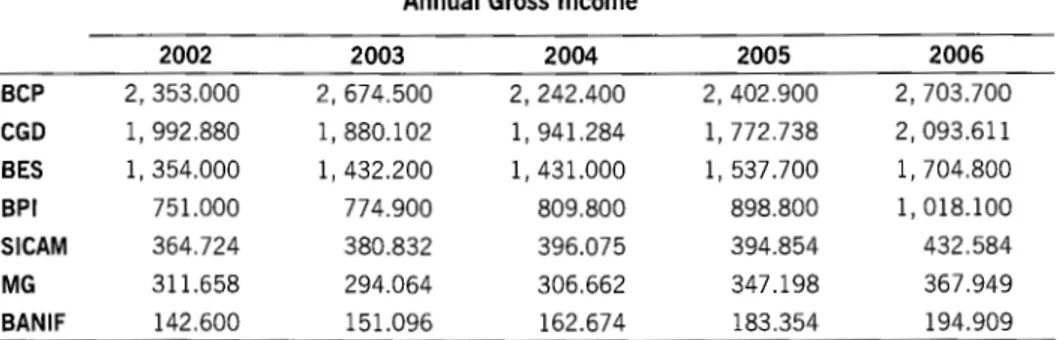
Due to the impossibility of retrieving internal data on operational losses, as referred by authors such as Rowe (2004), Currie (2005) and Sundmacher (2007), the AMA will not be applied to these banks in the Portuguese sector. On the other hand, Gl was taken from the banks' annual reports between 2002 and 2006. These values can be observed in Table 3.
TABLE 3
Annual Gross Income
2002 2003 2004 2005 2006
BCP 2, 353.000 2, 674.500 2, 242.400 2, 402.900 2, 703.700
CGD 1, 992.880 1, 880.102 1' 941.284 1, 772.738 2, 093.611
BES 1, 354.000 1, 432.200 1, 431.000 1, 537.700 1, 704.800
BPI 751.000 774.900 809.800 898.800 1, 018.100
SICAM 364.724 380.832 396.075 394.854 432.584
MG 311.658 294.064 306.662 347.198 367.949
BAN IF 142.600 151.096 162.674 183.354 194.909
Values in Millions of Euros.
BCP leads with the highest Gl, attaining 2,703.7 million Euros in 2006, distinguishing itself from the remaining institutions. CGD and BES rank second and third. Ranking last is BANIF with a Gl of 194.909 million Euros in 2006.
PORTUGUESE JOURNAL OF MANAGEMENT STUDIES, VOL. XIV, NO. 3, 2009
TABLE 4
Three Year Average of Gross Income
2005 2006 2007
BCP 2, 423.300 2, 439.933 2, 449.667
CGD 1, 938.089 1, 864.708 1, 935.878
BES 1, 405.733 1, 466.967 1, 557.833
BPI 778.567 827.833 908.900
SICAM 380.544 390.587 407.838
MG 304.128 315.975 340.603
BAN IF 152.123 165.708 180.312
Values in Millions of Euros.
TABLE 5
Loans and Advances
2002 2003 2004 2005 2006
BCP 45, 451.000 49, 177.000 49,939.000 54, 038.000 57,912.000
CGD 45, 204.000 45, 006.000 46, 619.000 49, 936.000 57, 268.000
BES 25, 795.000 26,042.000 28,487.000 31, 662.000 35, 752.000
BPI 19, 738.000 20, 690.100 21, 958.900 24, 409.200 28,263.000
MG 9, 970.119 10, 141.287 10, 653.708 12, 415.395 13,660.648
SICAM 6, 136.246 6, 334.263 6, 581.144 6, 863.579 6, 965.977
BAN IF 3, 948.239 4, 184.365 3, 715.532 4, 685.195 5, 342.949
Values in Millions of Euros.
TABLE 6
Three Year Average of Loans and Advances
2005 2006 2007
BCP 48, 189.000 51, 051.333 53, 963.000
CGD 45, 609.667 47, 187.000 51, 274.333
BES 26, 774.667 28, 730.333 31, 967.000
BPI 20, 795.667 22, 352.733 24, 877.033
MG 10, 255.038 11, 070.130 12, 243.250
SICAM 6, 350.551 6, 592.995 6, 803.567
BAN IF 3, 949.379 4, 195.031 4, 581.225
Values in Millions of Euros.
PORTUGUESE JOURNAL OF MANAGEMENT STUDIES, VOL. XIV, NO. 3, 2009
Basic Indicator Approach
In accordance with the BCBS (2006) and the Aviso n.0 9/2007 of the Banco de Portugal, the capital charge using equation 1 from the previous section was applied, resulting in the data in Table 7. This Table shows the capital charge for the seven Portuguese banks using the BIA. With this analysis we can eas-ily observe a linear relation between Gl and capital charge due to the fact that capital charge is a fixed percentage of Gl, i.e. capital charge will be exactly 15% of Gl. We can verify that BCP will allocate the most capital for operational risk with 367.450 million Euros in 2007. Ranking in last place is BANIF, allocating 27.047 million Euros in 2007.
TABLE 7
Capital Charge for BIA
2005 2006 2007
BCP 363.495 365.990 367.450
CGD 290.713 279.706 290.382
BES 210.860 220.045 233.675
BPI 116.785 124.175 136.335
SICAM 57.082 58.588 61.176
MG 45.619 47.396 51.090
BAN IF 22.819 24.856 27.047
Values in Millions of Euros.
The Standardized Approach
To apply this methodology, financial institutions must map their activities along eight BL, as pointed out in the previous section. Gl will also have to be divided into each BL, each fraction being multiplied by a fixed percentage
f3
as defined for every BL. Capital charge is equal to the sum of the products of the eight fractioned Gl values and their respective {3' s.PORTUGUESE JOURNAL OF MANAGEMENT STUDIES, VOL. XIV, NO. 3, 2009
RMG. This contribution by Moscadelli (2004) makes it possible to calculate, in average terms, the part of an institution's Gl belonging to each BL, making it pos-sible to calculate capital charge for operational risk for TSA and ASA.
TABLE 8
Fraction of Gross Income per BL
BL %PB
Corporate Finance 10.6% Trading and Sales 17.3% Retail Banking 36.0% Commercial Banking 18.4% Payment and Settlement 3.0% Agency Services 3.8% Asset Management 4.6% Retail Brokerage 6.4%
As a result of the application of equation 2, we obtained the capital charge to be allocated according to TSA. (Table 9). In this case, the ranking of capital charge per institution is identical to that of the BIA, that is, BCP continues to rank first and BAN IF ranks last, but it is important to notice that capital charge has now decreased to 14.52% of the gross income, when Gl is fractioned as Moscadelli (2004) foresaw. In this approach, the decomposition of Gl per BL is identical for all the financial institutions, as Moscadelli (2004) pointed out, but in reality this may not be linear because bank activities can differ significantly from institution to institution.
TABLE 9
Capital Charge for TSA
2005 2006 2007
BCP 351.904 354.320 355.733
CGD 281.443 270.787 281.122
BES 204.136 213.028 226.224
BPI 113.061 120.215 131.988
SICAM 55.261 56.720 59.225
MG 44.165 45.885 49.461
BAN IF 22.091 24.064 26.184
PORTUGUESE JOURNAL OF MANAGEMENT STUDIES, VOL. XIV, NO. 3, 2009
Alternative Standard Approach
In this methodology, as in the previous one, financial institutions must clas-sify their activities into the eight BL. This methodology differs from previous one with respect to retail and commercial banking. For these two BL, Gl will be sub-stituted by the value of LA associated to these two BL. Similar to what happened in TSA, in this approach we notice that LA are not divided into BL in banks' annual reports. Therefore the results obtained by Moscadelli (2004) for Gl were used, as decomposed in Table 8. As can be observed in the Table, the combined weight of Gl for retail and commercial banking is 54.4%. This reference was used to distinguish the fraction of LA for both retail and commercial banking. This de-composition of LA may not be a rigorous representation of reality, but significant divergences are not expected. Table 10 represents the values referring to 54.4% of the initial value obtained for LA for every institution.
TABLE 10
LA for Retail and Commercial Banking
2005 2006 2007
BCP 26, 214.816 27, 771.925 29, 355.872
CGD 24, 811.659 25, 669.728 27, 893.237
BES 14, 565.419 15, 629.301 17,390.048
BPI 11,312.843 12, 159.887 13, 533.106
MG 5, 578.741 6, 022.151 6, 660.328
SICAM 3, 454.700 3, 586.589 3, 701.140
BAN IF 2, 148.462 2, 282.097 2, 492.187
Values in Millions of Euros.
Appling equation 3, we obtain Table 11, which represents capital charge for the ASA. As can be observed in Table 11, capital charge for the ASA results in a ranking similar to TSA, with the exception of MG and SICAM, whose positions are inverted. This is due to the fact that MG has a greater amount of LA than SICAM.
implica-PORTUGUESE JOURNAL OF MANAGEMENT STUDIES, VOL. XIV, NO. 3, 2009
tions on capital charge: for some institutions less capital will be allocated with this approach, in other cases we will see the inverse situation.
TABLE 11
Capital Charge for ASA
2005 2006 2007
BCP 318.098 327.511 336.552
CGD 274.596 273.636 290.610
BES 181.157 191.303 207.314
BPI 117.375 125.490 138.737
MG 51.938 55.148 60.332
SICAM 46.477 47.918 49.804 BAN IF 22.608 24.332 26.512
Values in Millions of Euros.
TABLE 12
Capital Charge expressed in percentage
2005 2006 2007
BCP 13.13% 13.42% 13.74%
BPI 15.08% 15.16% 15.26%
CGD 14.17% 14.67% 15.01%
MG 17.08% 17.45% 17.71%
BES 12.89% 13.04% 13.31%
BAN IF 14.86% 14.68% 14.70%
SICAM 12.21% 12.27% 12.21%
Results Analysis
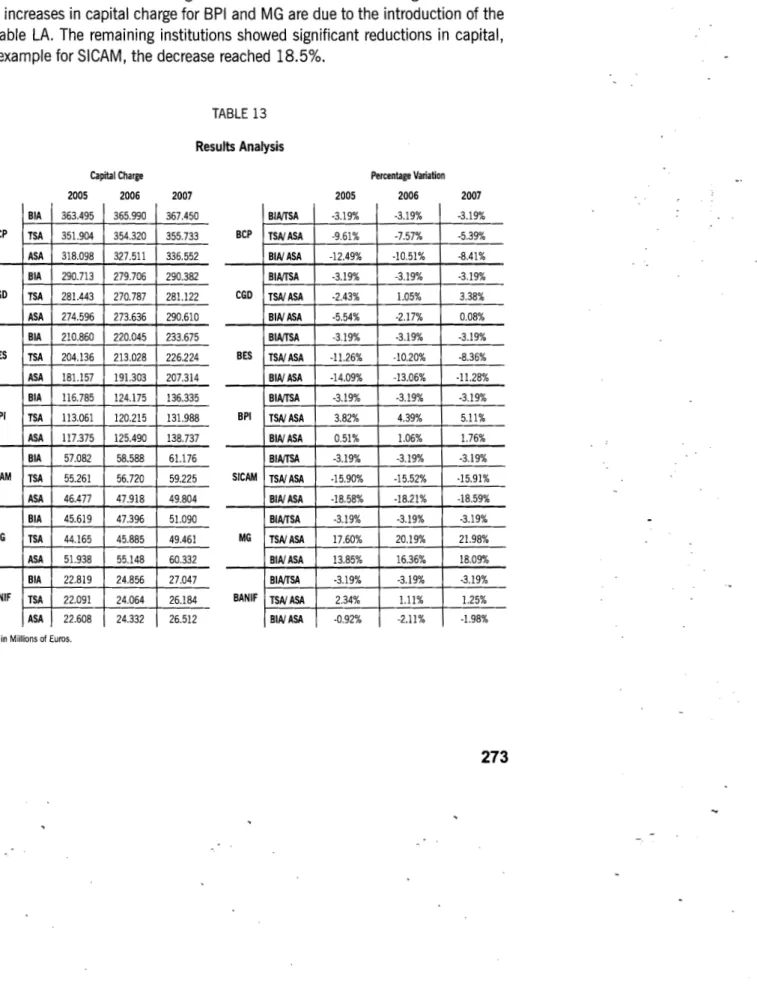
As can be observed, the results of the application of the three methodolo-gies, BIA, TSA and ASA are presented in Table 13, we verify that the impact of progressing from BIA to TSA is identical in all the institutions. This occurrence is due to the decomposition of Gl, which is identical for every institution. We can observe a decrease of approximately 3.20% in capital charge in using TSA. The ASA showed that the introduction of LA to the equation had significant results for the various institutions. Specifically, BCP, BES and SICAM, decreased their capital charge, varying from 5% to 16%. The inverse situation also occurs. BPI, MG and BAN IF showed an increase in capital charge, varying from 1% to 22%. The case of CGD is peculiar: capital charge starts by decreasing in 2005 and then
PORTUGUESE JOURNAL OF MANAGEMENT STUDIES, VOL. XIV, NO. 3, 2009
increases in 2006 and 2007. Another analysis also evidenced here, is the option of an institution progressing directly from the BIA to the ASA. This analysis shows that this option is favorable to all the financial institutions, with the exception of BPI and MG. BPI would have an increase in capital charge of about 1%, which is insignificant. The case of MG is more severe, the increase in capital charge would reach 18% in 2007. Maintaining TSA in this case is more advantageous for MG. The increases in capital charge for BPI and MG are due to the introduction of the variable LA. The remaining institutions showed significant reductions in capital, for example for SICAM, the decrease reached 18.5%.
TABLE 13
Results Analysis
Capital Charge Percentage Variation
2005 2006 2007 2005 2006 2007
BIA 363.495 365.990 367.450 BIA/TSA -3.19% -3.19% -3.19%
BCP TSA 351.904 354.320 355.733 BCP TSA/ ASA -9.61% -7.57% -5.39%
ASA 318.098 327.511 336.552 BIA/ ASA -12.49% -10.51% -8.41%
BIA 290.713 279.706 290.382 BIA/TSA -3.19% -3.19% -3.19%
CGD TSA 281.443 270.787 281.122 CGD TSA/ ASA -2.43% 1.05% 3.38%
ASA 274.596 273.636 290.610 BIA/ ASA -5.54% -2.17% 0.08%
BIA 210.860 220.045 233.675 BIA/TSA -3.19% -3.19% -3.19%
BES TSA 204.136 213.028 226.224 BES TSA/ ASA -11.26% -10.20% -8.36%
ASA 181.157 191.303 207.314 BIA/ ASA -14.09% -13.06% -11.28%
BIA 116.785 124.175 136.335 BIA/TSA -3.19% -3.19% -3.19%
BPI TSA 113.061 120.215 131.988 BPI TSA/ ASA 3.82% 4.39% 5.11%
ASA 117.375 125.490 138.737 BIA/ ASA 0.51% 1.06% 1.76%
BIA 57.082 58.588 61.176 BIA/TSA -3.19% -3.19% -3.19%
SICAM TSA 55.261 56.720 59.225 SICAM TSA/ ASA -15.90% -15.52% -15.91%
ASA 46.477 47.918 49.804 BIA/ ASA -18.58% -18.21% -18.59%
BIA 45.619 47.396 51.090 BIA/TSA -3.19% -3.19% -3.19%
MG TSA 44.165 45.885 49.461 MG TSA/ ASA 17.60% 20.19% 21.98%
ASA 51.938 55.148 60.332 BIA/ ASA 13.85% 16.36% 18.09%
BIA 22.819 24.856 27.047 BIA/TSA -3.19% -3.19% -3.19%
BAN IF TSA 22.091 24.064 26.184 BAN IF TSA/ ASA 2.34% 1.11% 1.25%
ASA 22.608 24.332 26.512 BIA/ ASA -0.92% -2.11% -1.98%
PORTUGUESE JOURNAL OF MANAGEMENT STUDIES, VOL. XIV, NO. 3, 2009
V. CONCLUDING REMARKS
Basel I satisfied its initial objectives for many years, guaranteeing the finan-cial stability of the international banking system. However, rapid transformations in the banking sector made revision to the Basel I framework necessary. The new capital accord, Basel II, came to strengthen minimum capital requirements in financial institutions, improving the levels of solvency and solidity of each institu-tion.
In the present work, beyond the application of the methodologies for opera-tional risk, we verified the axiom that is constantly referred to in the Basel Frame-work and studies elaborated by other authors. This axiom is based on the fact that the application of an advanced or sophisticated methodology will benefit a bank, decreasing capital charge for operational risk. According to the analysis elabo-rated in the previous section and considering the results pointed out by Moscadelli (2004), we verify that, when abdicating from the BIA and adopting TSA, the fi-nancial institutions will benefit from a capital charge reduction of, approximately, 3.2%. This conclusion was similar to the one Sundmacher (2007) obtained: opt-ing for TSA over the BIA, capital charge will decrease albeit insignificantly.
On the other hand, we must be conscious that these results will depend on the dominant activities within each institution. As Sundmacher (2004) stated in his study, an institution in which BL with greater f3's -for example 18%- pre-dominate, will allocate more capital in an advanced methodology, so it is more advantageous to apply the BIA, which has an a of 15%. The opposite may also occur, when an institution's dominant BL have smaller {3' s, for example, 12%. In this situation, the institution will allocate less capital using TSA. In the last methodology, ASA, we verified diversified results; the introduction of the variable LA gave rise to an increase or decrease in capital charge in comparison with TSA. We also verified that in the majority of the banks, progressing from BIA to ASA is, in general, advantageous, that is, lower values of capital can be allocated.
This work sought to evaluate the benefits of the use of a more sophisticated methodology set out by the Basel Committee for each one of the seven Portuguese banking institutions. As mentioned previously, progressing from BIA to TSA is beneficial for all institutions. The second choice - progressing directly from BIA to ASA - is equally favorable. The use of the more advanced methodologies - TSA and ASA - is limited by the mapping of the banks' activities, which, as we can observe in their annual reports, are still in need of some structuring. With respect to the application of the ASA, institutions will have to evaluate their situations better. In the case of four institutions, CGD, BPI, MG and BANIF, it is preferable to remain in TSA, especially in the case of MG, where capital charge increases by approximately 22%. On the other hand, BCP, BES and SICAM benefited with the application of the ASA. SICAM benefited with a decrease of approximately
PORTUGUESE JOURNAL OF MANAGEMENT STUDIES, VOL. XIV, NO. 3, 2009
16%. In progressing directly from BIA to ASA, institutions can save up to 18.5% of capital, as is the case for SICAM; however, they can lose up to 18%, as is the case for MG.
As Currie (2004b) stated in her work, significant increases in capital charge can have negative consequences for institutions, that is, they may desire to in-crease the general level of prices, which can result in a credit crunch.
Although there has been significant progress in recent years, Holmes (2003) argues that there are still obstacles when analyzing operational risk. First, op-erational risk is very hard to quantify correctly. Second, while credit risk can be identified easily, it is difficult to evaluate if all operational risk situations have been included. Third, certain risks can lose their relevance in an institution over time. Finally, the difficulty in validating a good method for calculating capital charge decreases its own reliability. Currie (2005) claims that the greatest obstacle in operational risk is that non-measurable factors cannot be controlled, arguing that quality cannot be measured, and, therefore, cannot be controlled.
PORTUGUESE JOURNAL OF MANAGEMENT STUDIES, VOL. XIV, NO. 3, 2009
References
Banco Comercial Portugues, Relat6rio e Contas de 2002 a 2006. Banco de Portugal, (2006a). Aviso n.0 3/2006.
Banco de Portugal, (2006b). Relat6rio de Estabilidade Financeira-2006. Banco de Portugal, (2007a). Aviso n.0 9/2007.
Banco Espfrito Santo, Relat6rio e Contas de 2002 a 2006.
Banco lnternacional do Funchal, Relat6rio e Contas de 2002 a 2006. Banco Portugues de lnvestimentos, Relat6rio e Contas de 2002 a 2006.
Basel Committee on Banking Supervision, (2006). Internal Convergence of Capital Measurement and Capital Standards - A Revised Framework - Comprehensive Version, Working Paper, Basel, BIS.
Caixa Geral de Depositos, Relat6rio e Contas de 2002 a 2006.
Chorafas, D. N., (2005). Operational Risk Control with Basel//, Oxford: Elsevier. Credito Agricola, Relat6rio e Contas de 2002 a 2006.
Currie, C., (2004a). Basel II and Operational Risk- Overview of Key Concerns, Working Paper no. 134. School of Finance and Economics. University of Technology of Sydney.
Currie, C., (2004b). Potential Effect of the New Basel Operational Risk Capital Requirements. Work-ing Paper no. 137. School of Finance and Economics. University of Technology of Sydney. Currie, C., (2005). A Test of the Strategic Effect of Basel II Operational Risk Requirements on
Banks. Working Paper no. 143. School of Finance and Economics. University of Technology of Sydney.
Fontnouvelle, P., Rueff, V. J., Jordan, J., e Rosengren, E. (2003). Using Loss Data to Quantify Op-erational Risk. Working Paper, Federal Reserve Bank of Boston.
Holmes, M. (2003). Measuring Operational Risk: a Reality Check. Risk Management. September 2003.
lnstituto Forma<;iio Bancaria (IFB), 2006. Acordo de Basileia II- No<;6es Fundamentais.
Jobst, A. A. (2007). Constraints of Consistent Operational Risk Measurement and Regulation: Data Collection and Loss Reporting, Journal of Financial Regulation and Compliance, A no 2007, Volume 15 (4), pp. 423-449.
Montepio Geral, Relat6rio e Contas de 2002 a 2006.
Mori, T., e Harada, E. (2001). Internal Measurement Approach to Operational Risk Capital Charge, Working Paper, Bank of Japan.
Moscadelli, M. (2004). The Modelling of operational risk: experience with the analysis of the data collected by the Basel Committee. Temi di discussion del Servizio Studi, Working Paper, Banca D'ltalia, Number 517.
Risk Management Group, (2003b). The 2002 Loss Data Collection Exercise for Operational Risk: Summary of the Data Collected, Working Paper, Basel, BIS.
Rowe, D. (2004). Operational Risk and Black Swans. Risk. September 2004. Vol. 17 (9). Sundmacher, M. (2004). Operational Risk Measurement in Banks: Arbitrage, Adjustments and
Alternatives, Working Paper, University of Western Sydney.
PORTUGUESE JOURNAL OF MANAGEMENT STUDIES, VOL. XIV, NO. 3, 2009
Resumo
Com este trabalho, pretende-se efectuar uma abordagem generica sobre a origem do Novo Acordo de Basileia, que tem como objectivo a estabilidade do sistema bancario internacional, no qual e dado especial enfase
a
convergencia entre capital regulamentar e capital econ6mico atraves de metodologias do tipo risk sensitive. Pretende-se ainda, focalizar numa das principais novidades do Basileia II - o risco operacional e respectivas metodologias de calculo dos requisitos minimos. 0 Novo Acordo pretende en-corajar as instituig6es financeiras a evoluiram gradual mente para metodologias mais complexas, sendo estas recompensadas por dedug6es no volume do capital a ser alocado para fundos pr6prios. Neste sentido, foi efectuada uma aplicagao das metodologias associadas ao risco operacional a um con junto de instituig6es bancarias nacionais. Das metodologias referentes a este tipo de risco destacam-se no Pilar I do Novo Acordo: (i) metoda basico, (ii) metoda standard e (iii) standard alternativo. 0 objectivo deste trabalho visa avaliar e quantificar o impacto decorrido da aplicagao do Basileia II.Palavras-chaves: Basileia II; Risco Operacional; Capital Regulamentar; e Capital Econ6mico.