PORTUGUESE JOURNAL OF MANAGEMENT STUDIES, VOL. XI/, NO. 2, 2007
W
School of Economics and Management TECHNICAL UNIVERSITY OF LISBONG
ELECTRICITY MARKET PRICE FORECASTING BY GRID COMPUTING
OPTIMIZING ARTIFICIAL NEURAL NETWORKS
I Niimura
Faculty of Economics, Hosei University, Tokyo
K. Ozawa
Faculty of Economics, Hosei University, Tokyo
N. Sakamoto
Faculty of Economics, Hosei University, Tokyo
Abstract
This paper presents a grid computing approach to parallel-process a neural network time-series model for forecasting electricity market prices. A grid computing environment introduced in a university computing laboratory provides access to otherwise underused computing resources. The grid computing of the neural network model not only processes several times faster than a single iterative process, but also provides chances of improving forecasting accuracy. Results of numerical tests using real market data on twenty grid-connected PCs are reported.
Keywords: Grid computing, electricity market, prices, forecasting, neural networks.
1. INTRODUCTION .
In many areas of the world, the electric utility industry has been deregulated and competitive markets have been created for electrical energy supply and related
services (Shahidehpour, Yamin, and Li, 2002.). A typical market-based operation
includes a one-day forward energy trading market which replaces the traditional centralized dispatch scheduling by a regionally monopolistic utility. In the deregulated markets, all the market participating energy suppliers are competing
Correspondence Address: K. Ozawa, Faculty of Economics, Hosei University, 4342 Aihara-cho, Machida-shi, Tokyo, 194-0298, JAPAN. E-mail: kozawa@hosei.ac.jp
PORTUGUESE JOURNN.. OF MANAGEMENT STUDIES, VOL. X//, NO. 2, 2007
for a piece of load to serve at a lowest possible price at a certain hour of a day. Forecasting future market prices is critically important for determining the bid strategies. Although the past price information is usually available from the market operators, as in other commodity exchange markets, there are irregular price fluctuations, in part because of speculative moves and exogenous factors, which can make accurate forecasting quite difficult.
Neural networks are known to produce generally more accurate nonlinear models than linear models such as ARMA models for a time series forecasting (Bunn, 2000). However, in addition to large data sizes required for training the neural networks, heavy computing load due to the repeat optimization of the nonlinear models to achieve accurate forecasting is very demanding for computing power. The optimization of neural networks requires repeat solutions from different (usually random) starting values of parameters, and it takes quite a long time to process many repeat solutions to achieve accurate output.
On the other hand, recent development of networked computing environment has opened the gateway to grid computing which can provide extra computing power over a high-speed communication network with relatively inexpensive computer hardware (Gagliardi and Grey, 2006). By the grid computing framework, spare computing resources that are otherwise unused are made available for parallel computation of complex mathematical problems. The optimization of neural network models can be implemented in the grid computing environment, and can produce many parallel solutions in a fraction of time that would be required for single processor computing, thus potentially achieving more accurate results with a reasonable amount of time. It also improves the utilization of computing resources that would otherwise be idle.
In this paper, the authors implement parallel computing of a neural network-based forecasting system in a grid computing framework utilizing university computer training equipment. The grid computing environment includes twenty-one low cost PCs. Using a commercially available market forecasting application program and a grid computing middleware, actual market data in North America are analyzed and results are examined.
PoRTUGUESE JOURNAL OF MANAGEMENT STUDIES, VOL. XI/, NO. 2, 2007
2. ELECTRICITY MARKET PRICE FORECASTING
Because electrical energy is not able to be stored in large scale and heavy equipment, for example thermal power generating stations need ample lead time to operate in the most economical fashion, forecasting the load consumption is quite important for the optimal scheduling of the power systems. In the traditional electric utility industry, therefore, forecasting techniques for future load consumption have been extensively studied and standard models have been developed (Gross and Galiana, 1987).
Since the early 1990s, artificial neural networks (ANNs) have been applied to the forecasting of the electrical loads (Hippert, Pedreira, and Souza, 2001), and standard packages have been used by many utility companies (Khotanzad, et al., 1997). Artificial neural networks have been r~ported to improve noticeably the accuracy of forecasting over earlier linear time series-based models. ANN-based models also have the flexibility of the design, and less care is needed for non-specialist users, but computation tends to take extensive time. Load forecasting is often done on an off-line basis, and the time constraints are not so stringent particularly when only peak load is concerned.
As the electrical utility industry is deregulated and competition is introduced, many attempts of forecasting the electricity market prices have been reported (Niimura, 2006). Most of these approaches are based on either the linear time-series models or various neural networks, but some special considerations are needed for market price forecasting. Particularly, because market trading is held for every hour of the target day, forecasting the 24-hour profile of prices is important. In most of the cases, the input data are the time series of past price data published by the market operator. Fig. 1 shows the general procedure of the ANN-based market price forecasting.
Major data for the price forecasting are the past market prices. Typically, price records of two weeks to one month leading up to the forecast target date are necessary for accurate forecasting. Simple statistical analysis on the input data set (e.g., mean and volatility) will give some hint of model selection and later model validation.
PORTUGUESE JOURNAL OF MANAGEMENT STUDIES, VOL XI/, NO. 2, 2007
FIGURE 1
Procedure of market price forecasting
FIGURE 2
Neural network model
Marketdata j
Error calculation
Slats.
I
information
PORTUGUESE JOURNAL OF MANAGEMENT STUDIES, VOL. XI/, NO. 2, 2007 After the model optimization, validation is carried out. Because the validation data are not included in the training, they are applied to measure the general performance of the model. If the validation results are not acceptable, the model optimization may be repeated with a different set of starting parameters. If validation fails several times, the model structure might need to be reviewed, by adding more input data, for example. If the model validation is successful, the model is applied to the actual forecast. Output may not be the estimated prices only; it is also convenient to obtain other statistical information such as confidence intervals. Most of the computing time is consumed in the training process of the neural networks. By distributing the repetitive process of the optimization to several machines, grid computing can significantly shorten the effective computational time. Because the nonlinear model of the ANN is trained from a different starting point in each training process, there is a greater chance of finding a better solution by obtaining as many separate results as possible similar to that of single optimization in the overall processing time.
3. GRID COMPUTING IMPLEMENTATION
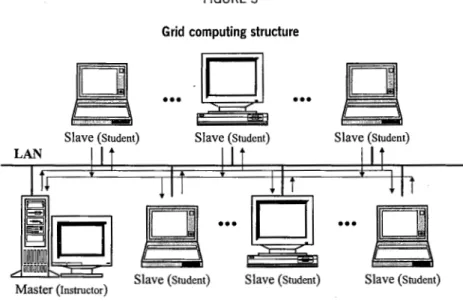
Modern universities are equipped with relatively new personal computers installed for use by the students and the researchers. Many of the non-technical departments also offer introductory courses on information technologies (IT), but this computing equipment is often not used unless students are in the computer laboratory sessions. These relatively inexpensive PCs are now connected with the local area network (LAN). By implementing grid computing middleware, which is often implemented in the form of a screensaver (Berman, Fox, and Hey, 2003) on the virtual slave machines, computationally demanding applications such as the market price forecasting can benefit from the parallel computing while improving the utilization rate of the otherwise unused equipment.
Fig. 3 shows a concept diagram of the trial grid computing structure. Specifying one of the grid connected machines as a master PC (typically an instructor's terminal in a computer lab environment), we installed the master controller program of the middleware, and the slave screen saver on the rest of the grid-connected machines. The master program is often supplied with a programming environment of various languages (C, Visual Basic, or Matlab, etc.) that controls the distribution of tasks and data, and retrieval of the results of the distributed computation from each of the slave machines. When the screensaver on a slave machine starts, the slave machine requests the master for jobs. The master machine selects a target data set that has not been processed and sends the data and the task to the slave machine. The target application program to be executed at the slave machine need not necessarily be developed and/ or recompiled especially for the grid computing environment.
PORTUGUESE JOURNAL OF MANAGEMENT STUDIES, VOL. XI/, NO. 2, 2007
FIGURE 3
Grid computing structure
...
·~
•••Slave (Student) Slave (Student) Slave (Student)
•••
Master (Instructor) Slave (Student)
In the university environment, the grid machines tend to be uniform and often form a cluster in the same location. However, depending on the capability of the middleware, grid computing can extend beyond the computer labs or even out of university campus. It could be also implemented on a mixture of different hardware platforms in a business IT environment.
4. NUMERICAL EXAMPLES
The authors implemented a commercial middleware AD-Powers which has a user interface based on MS-Excel spreadsheets and Visual Basic for Applications (VBA) application development environment in the undergraduate Economics information technology laboratory at Hosei University. Twenty one PCs running a standard Windows operating system on Celeron D340-2.93GHz CPU with 512MB PC-2700 memory were connected by fast Ethernet network. Electricity market forecasting was processed by Electricity Market Predictor (EMarP) system, another commercial application originally intended for single-processor computing, which can run in the above middleware environment. The EmarP application is developed in C/C+ + language.
The slave machines executed the application under the special screen saver and returned the results to the master middleware controlling the overall grid computation. The target data were obtained from Pennsylvania-New Jersey-Maryland (P JM) one-day forward electrical energy market.
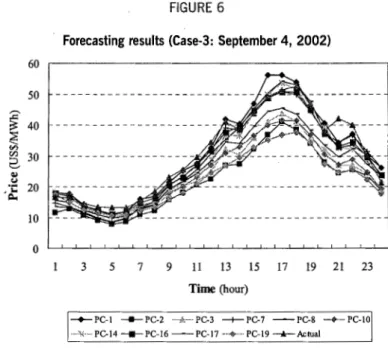
PORTUGUESE JOURNAL OF MANAGEMENT STUDIES, VOL. XI/, NO. 2, 2007 usually on hot summer and cold winter days. Forecasting results are shown in Figs. 4 to 6. Due to the space limitation, only the best ten results in 20-machine parallel cases are shown.
100
90
80 ::2 70
~
~ 60
;;;; <Zl
50 2
Cll 40
"'
·;:::: 30
~
20
10
0
FIGURE 4
Forecasting results (Case-1: July 18, 2002)
3 5 7
________________________ j l
9 II 13 15 17 19 21 23
Time (hour)
PC-3 - + - PC-6 - PC-8 - PC-9 · 0 ... PC-15 -lt-PC-16 .. w · PC-20 --A-Actual
FIGURE 5
Forecasting results (Case-2: August 1, 2002)
140
-120
~
100E
t5 80
2 60
40
20
0
3 5 7 9 II 13 15 I 7 19 21 23
Time (hour)
PORTUGUESE JOURNAL OF MANAGEMENT STUDIES, VOL. X//, NO. 2, 2007
50
~
40E
""'
2
30...
'"'
·;E
20 10FIGURE 6
Forecasting results (Case-3: September 4, 2002)
3 5 7 9 11 13 15 17 19 21 23
Time (hour)
-+-PC-I --PC-2 ... ;,. ... pc-3 --+-PC-7 -PC-8 -.-PC-10 ... x ... PC-14--- PC-16- PC-17 .. _... ... PC-19 --Actual
Table 1 shows the computational time and forecasting accuracy obtained in the grid computing environment for different configurations. While the number of PCs participating in grid computing varied from one to twenty, the maximum optimization-validation iteration was limited to twenty for all the cases. Errors were measured by the mean absolute percentage error (MAPE) against the actual price values. Accuracy improvements were achieved when the best cases of the overall forecast results were selected by a certain criterion (such as the minimum validation error). Even if the parallel-computed results look similar, such as shown in Figs. 4 to 6, it is relatively easy to remove over-fitted cases by a simple criterion such as the maximum limits (performed on the master PC side).
For a comparison, Table 2 lists the results of single computer processing using a different number of model optimization-validation. As the number of optimization-validation increases, it becomes more consistent and we tend to obtain (relatively) good results among several different possibilities. What can also be observed in Table 2 is that the computation time almost linearly increases as the number of optimization-validation increases.
PORTUGUESE JOURNAL OF MANAGEMENr STUDIES, VOL. XI/, NO. 2, 2007
TABLE 1
Computational Time and Accuracy - Grid Computing
Case Grid Pes Time (s) Errors(%)
20 34 11.79
Case-1 10 86 11.10
5 188 11.20
1 404 10.93
20 49 6.74
Case-2 10 150 7.09
5 216 6.59
1 542 7.13
20 66 7.25
Case-3 10 234 ·7.76
5 563 9.55
1 1141 11.36
TABLE 2
Computational Time and Accuracy - Single Computing
Case Validation loop 1 5 10 20
Case-1 Errors(%) 11.19 11.08 10.69 10.93
Time (s) 19 127 230 404
Case-2 Errors(%) 9.13 10.55 7.73 7.13
Time (s) 31 126 276 542
Case-3 Errors(%) 15.14 8.97 11.33 11.36
Time (s) 73 320 518 1141
and data preprocessing which is common among different cases but is currently done on the slave side.
5. CONCLUSIONS
PORTUGUESE JOURNAL OF MANAGEMENT STUDIES, VOL. XII, NO. 2, 2007
for grid computing). As the number of tasks to be processed by the grid exceeded the total number of PCs, we might experience a noticeable overhead problem. However, by the application of workload scheduling (for example, Nguyen, et al., 2005), it was possible to extract the maximum available computing power from the grid computing environment. The observation of the results will provide insights into the future applications of grid computing in forecasting tasks and related modeling including, for example, achieving the best accuracy of forecast from the multiple solutions available from the grid computing.
~
~
Q,l
e
E:::FIGURE 7
Speed vs. cluster size
1200
+ Case-1 !Ill Case-2 .i. Case-3
1000
---800 600 400 200 0 0 ~---.---
~---_______
,
________.
_______________________ _ w•
•
5 10 15 20
Number of Grid PCs
25
References
Shahidehpour, M., Yamin, H., and Li, Z. (2002). Market operations in electric power systems:
forecasting, scheduling, and risk management, New York: Wiley.
Bunn, D.W. (2000). Forecasting loads and prices in competitive power markets. Proceedings of IEEE, 88 (2), 163-169.
Gagliardi, F. and Grey, F. (2006). Old world, new grid. Spectrum, IEEE, 43 (7), 28- 33.
Gross, G. and Galiana, F. D. (1987). Short-term load forecasting. Proc. IEEE, 75 (12), 1558- 1573.
Hippert, H.S., Pedreira, C. E., and Souza, R. C. (2001). Neural networks for short-term load fore-casting: a review and evaluation. IEEE Trans. Power Systems, 16 (1), 44-55.
Khotanzad, A., Afkhami-Rohani, R., Lu, T. L., Abaye, A., Davis, M. and Maratukulam, D. J. (1997).
ANNSTLF-A neural-network-based electric load forecasting system. IEEE Trans. Neural Net-works, 8 (4), 835-846.
Niimura, T. (2006). Forecasting techniques for deregulated electricity market prices - Extended
Survey. Proc. Power Systems Conference and Exposition, 51 -56.
Berman, F., Fox, G., and Hey, T. (eds.). (2003). Grid computing: Making the global infrastructure a
reality, New York: Wiley.
PORTUGUESE JOURNAL OF MANAGEMENT STUDIES, VOL. XI/, NO. 2, 2007
Resumo
Este artigo apresenta uma grelha de computa~ao para um processo paralelo num modelo de redes neuronais em series temporais para previsao dos pre~os de mercado da electricidade. A grelha de compu-ta~ao introduzida num laborat6rio universitario de computa~ao fornece o acesso a recursos sub-utilizados. A grelha de computa~ao do modelo da rede neuronal nao s6 apresenta um processamento mais rapido do que um processo iteractivo unico, mas tambem fornece a possibilidade de aumentar a exactidao das previs6es. Este estudo reporta o resultado de testes numericos usando dados reais de mercado em vinte grelhas conectadas de PCs.
Palavras Chave: Grelha de computa~ao; mercado de electricidade; pre~os; previsao; redes neuronais.