ScienceDirect
Available online at www.sciencedirect.com
Procedia Computer Science 121 (2017) 982–989
1877-0509 © 2017 The Authors. Published by Elsevier B.V.
Peer-review under responsibility of the scientific committee of the CENTERIS - International Conference on ENTERprise Information Systems / ProjMAN - International Conference on Project MANagement / HCist - International Conference on Health and Social Care Information Systems and Technologies.
10.1016/j.procs.2017.11.127
10.1016/j.procs.2017.11.127
© 2017 The Authors. Published by Elsevier B.V.
Peer-review under responsibility of the scientific committee of the CENTERIS - International Conference on ENTERprise Information Systems / ProjMAN - International Conference on Project MANagement / HCist - International Conference on Health and Social Care Information Systems and Technologies.
1877-0509 Available online at www.sciencedirect.com
ScienceDirect
Procedia Computer Science 00 (2017) 000–000
www.elsevier.com/locate/procedia
1877-0509 © 2017 The Authors. Published by Elsevier B.V.
Peer-review under responsibility of the scientific committee of the CENTERIS - International Conference on ENTERprise Information Systems / ProjMAN - International Conference on Project MANagement / HCist - International Conference on Health and Social Care Information Systems and Technologies.
CENTERIS - International Conference on ENTERprise Information Systems / ProjMAN -
International Conference on Project MANagement / HCist - International Conference on Health
and Social Care Information Systems and Technologies, CENTERIS / ProjMAN / HCist 2017, 8-10
November 2017, Barcelona, Spain
Forum participation plugin for Moodle: Development and
Discussion
Andrés Muñoz
a,c*, Ramiro Delgado
c, Enrique Rubio
d, Carlos Grilo
a, Vitor
Basto-Fernandes
a,baSchool of Technology and Management, CIIC, Polytechnic Institute of Leiria, R. Gen. Norton de Matos, 2411-901 Leiria, Portugal b Instituto Universitário de Lisboa (ISCTE-IUL), University Institute of Lisbon, ISTAR-IUL, Av. das Forças Armadas, 1649-026 Lisboa, Portugal
cDepartamento de Ciencias de la Computación, Universidad de las Fuerzas Armadas ESPE, Av. General Rumiñahui, 382 Sangolquí - Ecuador dUniversidad de las Palmas de Gran Canaria, Calle Juan de Quesada, 35001 Las Palmas de Gran Canaria, Las Palmas, España
Abstract
At present, a large amount of software has been created to analyze social networks, such as libraries to access online social networking APIs, software to draw graphs and tools to use and analyze networks. In fact, and because of the use of Moodle as standard Learning Management System at the University of Las Palmas de Gran Canaria, in 2009 was born the idea of creating a plugin for Moodle capable of analyzing forums in which students participate and of identifying the major players within the student network. This work is about the present state of such plugin, which provides useful information to teachers so that, through the use of social network analysis, allows them to make decisions to improve and promote participatory education. Here, we show the application of the plugin to three case studies, in two different universities, which allowed to evaluate its usefulness and to compare the information according to the variables that influenced each case study.
© 2017 The Authors. Published by Elsevier B.V.
Peer-review under responsibility of the scientific committee of the CENTERIS - International Conference on ENTERprise Information Systems / ProjMAN - International Conference on Project MANagement / HCist - International Conference on Health and Social Care Information Systems and Technologies.
Keywords: Social Network Analysis, Learning Management Systems, Moodle
* Corresponding author.
E-mail address: [email protected]
Available online at www.sciencedirect.com
ScienceDirect
Procedia Computer Science 00 (2017) 000–000
www.elsevier.com/locate/procedia
1877-0509 © 2017 The Authors. Published by Elsevier B.V.
Peer-review under responsibility of the scientific committee of the CENTERIS - International Conference on ENTERprise Information Systems / ProjMAN - International Conference on Project MANagement / HCist - International Conference on Health and Social Care Information Systems and Technologies.
CENTERIS - International Conference on ENTERprise Information Systems / ProjMAN -
International Conference on Project MANagement / HCist - International Conference on Health
and Social Care Information Systems and Technologies, CENTERIS / ProjMAN / HCist 2017, 8-10
November 2017, Barcelona, Spain
Forum participation plugin for Moodle: Development and
Discussion
Andrés Muñoz
a,c*, Ramiro Delgado
c, Enrique Rubio
d, Carlos Grilo
a, Vitor
Basto-Fernandes
a,baSchool of Technology and Management, CIIC, Polytechnic Institute of Leiria, R. Gen. Norton de Matos, 2411-901 Leiria, Portugal b Instituto Universitário de Lisboa (ISCTE-IUL), University Institute of Lisbon, ISTAR-IUL, Av. das Forças Armadas, 1649-026 Lisboa, Portugal
cDepartamento de Ciencias de la Computación, Universidad de las Fuerzas Armadas ESPE, Av. General Rumiñahui, 382 Sangolquí - Ecuador dUniversidad de las Palmas de Gran Canaria, Calle Juan de Quesada, 35001 Las Palmas de Gran Canaria, Las Palmas, España
Abstract
At present, a large amount of software has been created to analyze social networks, such as libraries to access online social networking APIs, software to draw graphs and tools to use and analyze networks. In fact, and because of the use of Moodle as standard Learning Management System at the University of Las Palmas de Gran Canaria, in 2009 was born the idea of creating a plugin for Moodle capable of analyzing forums in which students participate and of identifying the major players within the student network. This work is about the present state of such plugin, which provides useful information to teachers so that, through the use of social network analysis, allows them to make decisions to improve and promote participatory education. Here, we show the application of the plugin to three case studies, in two different universities, which allowed to evaluate its usefulness and to compare the information according to the variables that influenced each case study.
© 2017 The Authors. Published by Elsevier B.V.
Peer-review under responsibility of the scientific committee of the CENTERIS - International Conference on ENTERprise Information Systems / ProjMAN - International Conference on Project MANagement / HCist - International Conference on Health and Social Care Information Systems and Technologies.
Keywords: Social Network Analysis, Learning Management Systems, Moodle
* Corresponding author.
E-mail address: [email protected]
2 Andrés Muñoz et al. / Procedia Computer Science 00 (2017) 000–000
1. Introduction
Social Network Analysis (SNA) is a research technique that analyses the social structure that emerges from the combination of relationships among members of a given population. SNA mathematically examines characteristics of the relationships between the members of the social network.
SNA is used to understand the behavior of participants in a social network and, if possible, to improve it. By identifying who has been interacting with whom, we may also know which groups/clusters exist within the network. Furthermore, SNA allows the segmentation of data based on user behavior and understanding natural groups that have been formed accordingly.
Moodle is a Learning Management System developed to integrate several aspects of modern education. It was written in open source code and supported by a large community of developers worldwide. This community is always working on plugins to improve the performance of the platform. Here, we describe a plugin for Moodle that resorts to SNA to allow teachers to identify the most relevant actors in the courses’ forums, helping them to take measures to improve students’ participation in these virtual environments.
Understanding who the “important” persons in a group are and what are their interests, should help us make improvements in the social interaction in eLearning platforms such as Moodle. But, to achieve this, it is necessary to use methodologies such as Learning Analytics, Data Collection Methods, and Data Analysis.
The rest of the paper is organized as follows. Section 2 addresses related work divided into sub relevant topics. Section 3 describes all about the plugin development and functionality. Section 4 presents a discussion on the application of the plugin on three real undergraduates and master courses. Finally, Section 5 presents the conclusions and future lines of research of this work.
2. Related Work
A large number of authors define a social network as a configuration within some society where individuals are related to each other, and whose relationships can be of different types, such as financial exchanges, friendship, sexual relations, among others. Apart from this, the globalized environment arises as a network society, which means that the interests of companies and people are projected and validated socially but also regarding connectivity with other nodes and distributed ownership1. Also, the foundations of social software allow the formation of interconnected and related collaborative communities of general or specific scope, with a web-oriented architecture as a model for the development of programs and services2.
Social Networking Analysis is a branch of the social sciences that study human interactions or social relationships rather than individual attributes3. It originates primarily in sociology, anthropology and is used in political science, economics, and history, as well as a subject of study in mathematics, physics, biology and computer science4,5.
Networks are defined as a set of objects called nodes that are connected by one or more relationships called connections6. Nodes in the social context are a wide range of social units, such as individuals, groups, companies, organizations, and websites. The sociography method as a way of visualizing networks consists in drawing nodes as points and connections as lines. Indeed, representing networks as graphs is often preferred rather than traditional statistics5,7.
The network data is usually stored as adjacency matrixes5. An adjacency matrix tells us what relationships each node has with other nodes: each cell [i, j] is set to 1 if there is a direct relation between nodes i and j and 0, otherwise. It is possible to operate directly on the adjacency matrix without the actual visual representation of the data7. Theorems of graph theory use the adjacency matrix to construct metrics such as the overall density of a network and centrality, the multipoint network relationship7. Measures of various types of centrality have been used to detect nodes or actors with more power and influence8.
SNA has traditionally used quantitative methods such as surveys and measures of the structural properties of social networks using refined quantitative techniques. In academic papers, applications are divided into two groups of tools: those that have a graphical user interface based on autonomous software and those based on programming languages libraries. In the first group, we have, for example, Gephi9, Cytoscape10, Ucinet11, and Pajek12. In the second group, the most used libraries are NetworkX13 and igraph14. The first is an open source project and is implemented in Python. Igraph is written in C with interfaces for C and Python Units. In this work, we used Pajek since it is a freeware
Andrés Muñoz et al. / Procedia Computer Science 121 (2017) 982–989 983
ScienceDirect
Procedia Computer Science 00 (2017) 000–000
www.elsevier.com/locate/procedia
1877-0509 © 2017 The Authors. Published by Elsevier B.V.
Peer-review under responsibility of the scientific committee of the CENTERIS - International Conference on ENTERprise Information Systems / ProjMAN - International Conference on Project MANagement / HCist - International Conference on Health and Social Care Information Systems and Technologies.
CENTERIS - International Conference on ENTERprise Information Systems / ProjMAN -
International Conference on Project MANagement / HCist - International Conference on Health
and Social Care Information Systems and Technologies, CENTERIS / ProjMAN / HCist 2017, 8-10
November 2017, Barcelona, Spain
Forum participation plugin for Moodle: Development and
Discussion
Andrés Muñoz
a,c*, Ramiro Delgado
c, Enrique Rubio
d, Carlos Grilo
a, Vitor
Basto-Fernandes
a,baSchool of Technology and Management, CIIC, Polytechnic Institute of Leiria, R. Gen. Norton de Matos, 2411-901 Leiria, Portugal b Instituto Universitário de Lisboa (ISCTE-IUL), University Institute of Lisbon, ISTAR-IUL, Av. das Forças Armadas, 1649-026 Lisboa, Portugal
cDepartamento de Ciencias de la Computación, Universidad de las Fuerzas Armadas ESPE, Av. General Rumiñahui, 382 Sangolquí - Ecuador dUniversidad de las Palmas de Gran Canaria, Calle Juan de Quesada, 35001 Las Palmas de Gran Canaria, Las Palmas, España
Abstract
At present, a large amount of software has been created to analyze social networks, such as libraries to access online social networking APIs, software to draw graphs and tools to use and analyze networks. In fact, and because of the use of Moodle as standard Learning Management System at the University of Las Palmas de Gran Canaria, in 2009 was born the idea of creating a plugin for Moodle capable of analyzing forums in which students participate and of identifying the major players within the student network. This work is about the present state of such plugin, which provides useful information to teachers so that, through the use of social network analysis, allows them to make decisions to improve and promote participatory education. Here, we show the application of the plugin to three case studies, in two different universities, which allowed to evaluate its usefulness and to compare the information according to the variables that influenced each case study.
© 2017 The Authors. Published by Elsevier B.V.
Peer-review under responsibility of the scientific committee of the CENTERIS - International Conference on ENTERprise Information Systems / ProjMAN - International Conference on Project MANagement / HCist - International Conference on Health and Social Care Information Systems and Technologies.
Keywords: Social Network Analysis, Learning Management Systems, Moodle
* Corresponding author.
E-mail address: [email protected]
2 Andrés Muñoz et al. / Procedia Computer Science 00 (2017) 000–000
1. Introduction
Social Network Analysis (SNA) is a research technique that analyses the social structure that emerges from the combination of relationships among members of a given population. SNA mathematically examines characteristics of the relationships between the members of the social network.
SNA is used to understand the behavior of participants in a social network and, if possible, to improve it. By identifying who has been interacting with whom, we may also know which groups/clusters exist within the network. Furthermore, SNA allows the segmentation of data based on user behavior and understanding natural groups that have been formed accordingly.
Moodle is a Learning Management System developed to integrate several aspects of modern education. It was written in open source code and supported by a large community of developers worldwide. This community is always working on plugins to improve the performance of the platform. Here, we describe a plugin for Moodle that resorts to SNA to allow teachers to identify the most relevant actors in the courses’ forums, helping them to take measures to improve students’ participation in these virtual environments.
Understanding who the “important” persons in a group are and what are their interests, should help us make improvements in the social interaction in eLearning platforms such as Moodle. But, to achieve this, it is necessary to use methodologies such as Learning Analytics, Data Collection Methods, and Data Analysis.
The rest of the paper is organized as follows. Section 2 addresses related work divided into sub relevant topics. Section 3 describes all about the plugin development and functionality. Section 4 presents a discussion on the application of the plugin on three real undergraduates and master courses. Finally, Section 5 presents the conclusions and future lines of research of this work.
2. Related Work
A large number of authors define a social network as a configuration within some society where individuals are related to each other, and whose relationships can be of different types, such as financial exchanges, friendship, sexual relations, among others. Apart from this, the globalized environment arises as a network society, which means that the interests of companies and people are projected and validated socially but also regarding connectivity with other nodes and distributed ownership1. Also, the foundations of social software allow the formation of interconnected and related collaborative communities of general or specific scope, with a web-oriented architecture as a model for the development of programs and services2.
Social Networking Analysis is a branch of the social sciences that study human interactions or social relationships rather than individual attributes3. It originates primarily in sociology, anthropology and is used in political science, economics, and history, as well as a subject of study in mathematics, physics, biology and computer science4,5.
Networks are defined as a set of objects called nodes that are connected by one or more relationships called connections6. Nodes in the social context are a wide range of social units, such as individuals, groups, companies, organizations, and websites. The sociography method as a way of visualizing networks consists in drawing nodes as points and connections as lines. Indeed, representing networks as graphs is often preferred rather than traditional statistics5,7.
The network data is usually stored as adjacency matrixes5. An adjacency matrix tells us what relationships each node has with other nodes: each cell [i, j] is set to 1 if there is a direct relation between nodes i and j and 0, otherwise. It is possible to operate directly on the adjacency matrix without the actual visual representation of the data7. Theorems of graph theory use the adjacency matrix to construct metrics such as the overall density of a network and centrality, the multipoint network relationship7. Measures of various types of centrality have been used to detect nodes or actors with more power and influence8.
SNA has traditionally used quantitative methods such as surveys and measures of the structural properties of social networks using refined quantitative techniques. In academic papers, applications are divided into two groups of tools: those that have a graphical user interface based on autonomous software and those based on programming languages libraries. In the first group, we have, for example, Gephi9, Cytoscape10, Ucinet11, and Pajek12. In the second group, the most used libraries are NetworkX13 and igraph14. The first is an open source project and is implemented in Python. Igraph is written in C with interfaces for C and Python Units. In this work, we used Pajek since it is a freeware
984 Andrés Muñoz et al. / Procedia Computer Science 121 (2017) 982–989
Andrés Muñoz et al. / Procedia Computer Science 00 (2017) 000–000 3 application, implemented in Pascal; It has powerful visualization tools and efficient algorithms for the analysis of large networks, among other characteristics.
To our best knowledge, there is only one other plugin that addresses SNA for Moodle15. This plugin shows the participation graphs based on different SNA metrics such as density, out degree, in degree and point centrality of the forum. Although it is published as a plugin for the 2.5 Moodle version, the author stresses that it is in an early stage of development and still is not stable for production environments. Also, the internal operation of the plugin is unknown due to the lack of existing documentation.
3. Forum participation plugin for Moodle: Development
The Forum participation plugin consists in an installable Moodle plugin that shows graphical information about the students’ participation in Moodle forums. Based on this information, teachers can take decisions to encourage students to participate in forums, turning learning a more collaborative and participatory process. The plugin data analysis is done over adjacency matrixes that represent the graph of interactions between users in the platform. It is possible to select the type of forum, the group, the discussion within a forum and, then, display the graphic analysis result.
3.1. The adjacency and the collaboration matrices
To turn SNA possible, it is necessary to first extract data from the Moodle MySQL database. We obtained the information from the database using two scripts written in the PHP language to determine the network adjacency matrix (described above in Section 2) and what we call the collaboration matrix, both needed to build the charts and graphs featured in the plugin.
The collaboration matrix is a type of adjacency matrix, used to save the number of comments that a forum user has made on the contents published by each of the other users. This matrix also contains a number of rows and columns equal to the number of users in the network, since rows and columns again represent the users, both in the same order. Each matrix cell [i, j] contains the total number of comments that user i has made on the contents of user j.
We note that, in practice, the adjacency and the collaboration matrices emulate, bidirectional and unidirectional networks/relationships, respectively. Both types of relationships can be visualized graphically and intuitively in the plugin’s graphs (see Fig. 4). This is possible because the Moodle forums have a nested structure, in which each user can respond specifically to the message of another user. As these are interactions in forums and, taking into account that teaching activities are within each course, we have a very interesting test bench in which we can see interactions between users, including the teacher’s interactions with the students.
3.2. Architecture
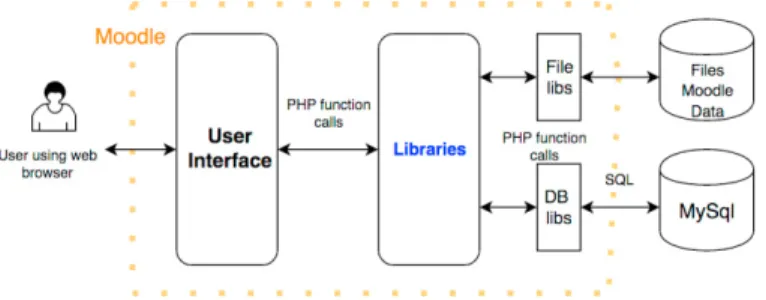
Moodle has a modular architecture, shown in Fig. 1. In fact, Moodle is an acronym for Modular Object-Oriented Dynamic Learning Environment16, so it allows third party software to be installed and used on the platform. Therefore, the Forum participation plugin was made under Moodle architecture standards.
Fig. 1. Moodle third layer architecture.
4 Andrés Muñoz et al. / Procedia Computer Science 00 (2017) 000–000
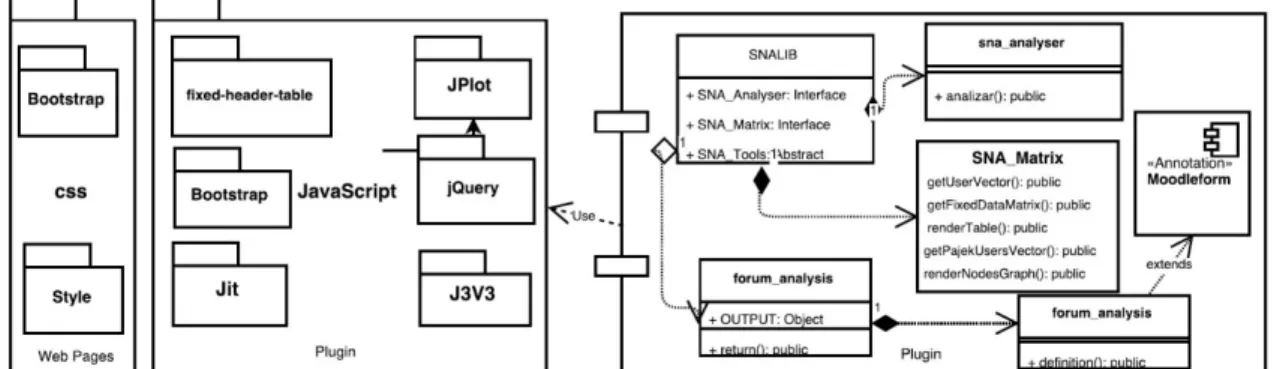
The plugin architecture is based on three main parts. The first one is represented by all the logic files that retrieve the data from the database. The second part is formed by all the files that work on to build the matrixes from the data extracted. The last one is formed by all the visual libraries that the plugin uses in order to present the visual data to the user. Fig. 2 shows all the plugin components, split out into two layers. The first layer shows all the graphic libraries such as Bootstrap, Fixed-Header-Table, Jqplot, Jit, JQuery, and J3V3. All these libraries are used to show the graphs such as the ones shown in the paper. The second layer below is where the plugin business logic takes place. In this layer, there is the main file called SNALIB; this PHP file has all the logic to perform the data retrieving and to build the adjacency and collaboration matrixes. To visualize all the results, specific functions have been implemented that execute logic to build each graph result. Then, a JSON object is created and passed as parameter to a PHP entry page of each library mentioned before.
For example, to create the Degree Graph (Section 3.6) the renderNodesGraphAlt() function is used to fill the nodes array by iterating the adjacency matrices mentioned before (Section 3.1). The data attached to each node depends on the type of graph. For the Degree Graph, for example, each node is described by the role of the user (teacher or student), the degree of the node, the contributions and the responses of the corresponding user and, finally, the cluster to which the node belongs. Once all the nodes are defined, we create links between the related nodes. Finally, a
json_encode object is created representing the nodes array which is sent as a parameter of the PHP graph library entry
page. In this case, we used a J3V3 entry page called “d3js_graph.php”.
Fig. 2.Moodle Forum participation plugin components architecture.
This plugin is developed in PHP and JavaScript code and uses several external jQuery libraries to graph the results of the analysis. It has a direct integration with Moodle 2.9 and 3.1 which makes it portable and easy to install and update. It allows performing the analysis of participation of the students in the Moodle forums choosing parameters such as forums, groups, discussions and the type of graphic in which the result will be represented. Sections 3.4 to 3.8 describe each of the plugin’s features.
3.3. The Collaboration Table
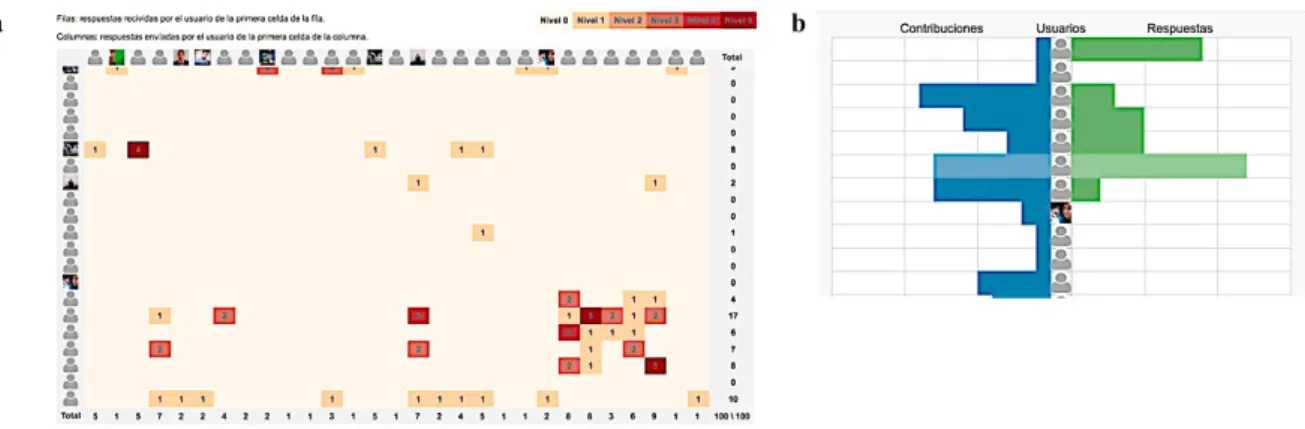
The Collaboration Table, Fig. 3 (a), is based on the collaboration matrix previously described. Besides showing for each cell [i, j] the number of comments user i has done to the contents of user j, the color of each cell follows a logarithmic scale of the number of comments that have been done. Lighter and stronger colors correspond respectively, to a smaller and a larger number of comments. Below the table, it is also possible to observe the total number of comments each user received on his/her contents from other users. Likewise, on the right side of the table it is shown the total number of comments each user has done on the contents of other users. This table helps identifying the most active actors in the network.
application, implemented in Pascal; It has powerful visualization tools and efficient algorithms for the analysis of large networks, among other characteristics.
To our best knowledge, there is only one other plugin that addresses SNA for Moodle15. This plugin shows the participation graphs based on different SNA metrics such as density, out degree, in degree and point centrality of the forum. Although it is published as a plugin for the 2.5 Moodle version, the author stresses that it is in an early stage of development and still is not stable for production environments. Also, the internal operation of the plugin is unknown due to the lack of existing documentation.
3. Forum participation plugin for Moodle: Development
The Forum participation plugin consists in an installable Moodle plugin that shows graphical information about the students’ participation in Moodle forums. Based on this information, teachers can take decisions to encourage students to participate in forums, turning learning a more collaborative and participatory process. The plugin data analysis is done over adjacency matrixes that represent the graph of interactions between users in the platform. It is possible to select the type of forum, the group, the discussion within a forum and, then, display the graphic analysis result.
3.1. The adjacency and the collaboration matrices
To turn SNA possible, it is necessary to first extract data from the Moodle MySQL database. We obtained the information from the database using two scripts written in the PHP language to determine the network adjacency matrix (described above in Section 2) and what we call the collaboration matrix, both needed to build the charts and graphs featured in the plugin.
The collaboration matrix is a type of adjacency matrix, used to save the number of comments that a forum user has made on the contents published by each of the other users. This matrix also contains a number of rows and columns equal to the number of users in the network, since rows and columns again represent the users, both in the same order. Each matrix cell [i, j] contains the total number of comments that user i has made on the contents of user j.
We note that, in practice, the adjacency and the collaboration matrices emulate, bidirectional and unidirectional networks/relationships, respectively. Both types of relationships can be visualized graphically and intuitively in the plugin’s graphs (see Fig. 4). This is possible because the Moodle forums have a nested structure, in which each user can respond specifically to the message of another user. As these are interactions in forums and, taking into account that teaching activities are within each course, we have a very interesting test bench in which we can see interactions between users, including the teacher’s interactions with the students.
3.2. Architecture
Moodle has a modular architecture, shown in Fig. 1. In fact, Moodle is an acronym for Modular Object-Oriented Dynamic Learning Environment16, so it allows third party software to be installed and used on the platform. Therefore, the Forum participation plugin was made under Moodle architecture standards.
Fig. 1. Moodle third layer architecture.
The plugin architecture is based on three main parts. The first one is represented by all the logic files that retrieve the data from the database. The second part is formed by all the files that work on to build the matrixes from the data extracted. The last one is formed by all the visual libraries that the plugin uses in order to present the visual data to the user. Fig. 2 shows all the plugin components, split out into two layers. The first layer shows all the graphic libraries such as Bootstrap, Fixed-Header-Table, Jqplot, Jit, JQuery, and J3V3. All these libraries are used to show the graphs such as the ones shown in the paper. The second layer below is where the plugin business logic takes place. In this layer, there is the main file called SNALIB; this PHP file has all the logic to perform the data retrieving and to build the adjacency and collaboration matrixes. To visualize all the results, specific functions have been implemented that execute logic to build each graph result. Then, a JSON object is created and passed as parameter to a PHP entry page of each library mentioned before.
For example, to create the Degree Graph (Section 3.6) the renderNodesGraphAlt() function is used to fill the nodes array by iterating the adjacency matrices mentioned before (Section 3.1). The data attached to each node depends on the type of graph. For the Degree Graph, for example, each node is described by the role of the user (teacher or student), the degree of the node, the contributions and the responses of the corresponding user and, finally, the cluster to which the node belongs. Once all the nodes are defined, we create links between the related nodes. Finally, a
json_encode object is created representing the nodes array which is sent as a parameter of the PHP graph library entry
page. In this case, we used a J3V3 entry page called “d3js_graph.php”.
Fig. 2.Moodle Forum participation plugin components architecture.
This plugin is developed in PHP and JavaScript code and uses several external jQuery libraries to graph the results of the analysis. It has a direct integration with Moodle 2.9 and 3.1 which makes it portable and easy to install and update. It allows performing the analysis of participation of the students in the Moodle forums choosing parameters such as forums, groups, discussions and the type of graphic in which the result will be represented. Sections 3.4 to 3.8 describe each of the plugin’s features.
3.3. The Collaboration Table
The Collaboration Table, Fig. 3 (a), is based on the collaboration matrix previously described. Besides showing for each cell [i, j] the number of comments user i has done to the contents of user j, the color of each cell follows a logarithmic scale of the number of comments that have been done. Lighter and stronger colors correspond respectively, to a smaller and a larger number of comments. Below the table, it is also possible to observe the total number of comments each user received on his/her contents from other users. Likewise, on the right side of the table it is shown the total number of comments each user has done on the contents of other users. This table helps identifying the most active actors in the network.
986 Andrés Muñoz et al. / Procedia Computer Science 00 (2017) 000–000 Andrés Muñoz et al. / Procedia Computer Science 121 (2017) 982–989 5
Fig. 3. (a) The Collaboration Table; (b) The Contributions and Responses Bar Chart.
3.4. The Contributions and Responses Bar Chart
The Contributions and Responses Bar Chart, Fig. 3 (b), vertically lists all the actors in the network and shows, using a bars chart, the number of contributions of each member and the responses each one got from other members of the network. It also allows displaying in the right part of the screen the content of each contribution and response of a user (not shown here). This chart helps the teacher to see the content of each input and to easily identify users with the highest number of contributions and responses.
3.5. The Centrality Graph
The Centrality Graph, Fig. 5 (a), shows a circle shaped graph where the nodes “vertex” at the center are the most important nodes according to the degree centrality measure, which measures simply the number of nodes to which each node is connected (called the node degree). The graph allows the user to select a node, in which case the network is rearranged so that the selected node is displayed in the center. Besides, the thickness of the connections varies according to the number of interactions between the users to which the nodes correspond, allowing the teacher to have a visual idea of the students with which some student interacted more.
Fig. 4. (a) The Centrality Graph; (b) The Degree Graph.
3.6. The Degree Graph
The Degree Graph Fig. 4 (b) allows the user to have an idea of the amount of contributions and responses of the forum’s participants. In this graph, the diameter of each node is proportional to the activity (contributions and
6 Andrés Muñoz et al. / Procedia Computer Science 00 (2017) 000–000
responses), that is, the compound degree of the node (incoming plus outgoing relationships). The orange circle corresponds to a teacher and the blue circles to student. Passing the mouse over a node shows a photo of the corresponding user and the contributions and answers received. Also, in this graph, it is possible to identify unidirectional as well as bidirectional relationships between the nodes. Finally, in this graph node are spatially organized to evidence the clusters that may exist within the network.
3.7. Files in Pajek format
The plugin also allows obtaining the collaboration matrices in Pajek format so that they can be used in the Pajek application. This feature is useful to get several indicators, such as node degree (the number of direct relationships of a node), degree centrality, closeness centrality, Betweenness centrality, eigenvector centrality, degree centralization and network density12,17,18, all of which may be used to identify the key actors in a network of contacts.
4. Discussion
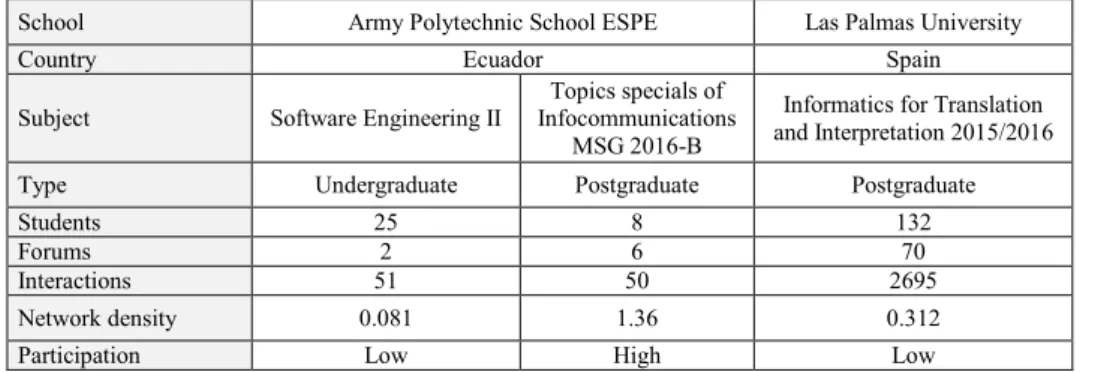
This section discusses the application of the plugin on three case studies from the Las Palmas University, Spain – Gran Canarias, and the Army Polytechnic School ESPE, Ecuador. For each case study, Table 1 shows the following information: school, country, lecture, type (scope of the application), the number of students, the number of forums, the number of groups, the number of interactions, network density and the participation level. The participation level was evaluated from network density ranges: 0 to 0.4 is considered a low participation level, 0.4 to 0.75 is a medium participation level, and above 0.75 it is considered a high participation level.
Table 1. Case studies summary.
School Army Polytechnic School ESPE Las Palmas University
Country Ecuador Spain
Subject Software Engineering II Infocommunications Topics specials of MSG 2016-B
Informatics for Translation and Interpretation 2015/2016
Type Undergraduate Postgraduate Postgraduate
Students 25 8 132
Forums 2 6 70
Interactions 51 50 2695
Network density 0.081 1.36 0.312
Participation Low High Low
4.1. Case study 1: Software Engineering II
This case study is the only undergraduate course that was used. In this case, the participation of the students was low, with only 51 interactions. In Fig. 5(a), a red line surrounds the main actors of the network. The links between the students inside the red line are wider than the students outside the line, so the interaction between those nodes is higher among them than among others.
The teacher can also identify the most effective actors correctly in this network using the Degree Graph. As we can see in Fig 5(a), the biggest nodes correspond to the students that had more interactions (for which the sum of received responses and contributions done is highest). The teacher can also perform a complementary analysis to relate students’ participation with academic success.
Fig. 3. (a) The Collaboration Table; (b) The Contributions and Responses Bar Chart.
3.4. The Contributions and Responses Bar Chart
The Contributions and Responses Bar Chart, Fig. 3 (b), vertically lists all the actors in the network and shows, using a bars chart, the number of contributions of each member and the responses each one got from other members of the network. It also allows displaying in the right part of the screen the content of each contribution and response of a user (not shown here). This chart helps the teacher to see the content of each input and to easily identify users with the highest number of contributions and responses.
3.5. The Centrality Graph
The Centrality Graph, Fig. 5 (a), shows a circle shaped graph where the nodes “vertex” at the center are the most important nodes according to the degree centrality measure, which measures simply the number of nodes to which each node is connected (called the node degree). The graph allows the user to select a node, in which case the network is rearranged so that the selected node is displayed in the center. Besides, the thickness of the connections varies according to the number of interactions between the users to which the nodes correspond, allowing the teacher to have a visual idea of the students with which some student interacted more.
Fig. 4. (a) The Centrality Graph; (b) The Degree Graph.
3.6. The Degree Graph
The Degree Graph Fig. 4 (b) allows the user to have an idea of the amount of contributions and responses of the forum’s participants. In this graph, the diameter of each node is proportional to the activity (contributions and
responses), that is, the compound degree of the node (incoming plus outgoing relationships). The orange circle corresponds to a teacher and the blue circles to student. Passing the mouse over a node shows a photo of the corresponding user and the contributions and answers received. Also, in this graph, it is possible to identify unidirectional as well as bidirectional relationships between the nodes. Finally, in this graph node are spatially organized to evidence the clusters that may exist within the network.
3.7. Files in Pajek format
The plugin also allows obtaining the collaboration matrices in Pajek format so that they can be used in the Pajek application. This feature is useful to get several indicators, such as node degree (the number of direct relationships of a node), degree centrality, closeness centrality, Betweenness centrality, eigenvector centrality, degree centralization and network density12,17,18, all of which may be used to identify the key actors in a network of contacts.
4. Discussion
This section discusses the application of the plugin on three case studies from the Las Palmas University, Spain – Gran Canarias, and the Army Polytechnic School ESPE, Ecuador. For each case study, Table 1 shows the following information: school, country, lecture, type (scope of the application), the number of students, the number of forums, the number of groups, the number of interactions, network density and the participation level. The participation level was evaluated from network density ranges: 0 to 0.4 is considered a low participation level, 0.4 to 0.75 is a medium participation level, and above 0.75 it is considered a high participation level.
Table 1. Case studies summary.
School Army Polytechnic School ESPE Las Palmas University
Country Ecuador Spain
Subject Software Engineering II Infocommunications Topics specials of MSG 2016-B
Informatics for Translation and Interpretation 2015/2016
Type Undergraduate Postgraduate Postgraduate
Students 25 8 132
Forums 2 6 70
Interactions 51 50 2695
Network density 0.081 1.36 0.312
Participation Low High Low
4.1. Case study 1: Software Engineering II
This case study is the only undergraduate course that was used. In this case, the participation of the students was low, with only 51 interactions. In Fig. 5(a), a red line surrounds the main actors of the network. The links between the students inside the red line are wider than the students outside the line, so the interaction between those nodes is higher among them than among others.
The teacher can also identify the most effective actors correctly in this network using the Degree Graph. As we can see in Fig 5(a), the biggest nodes correspond to the students that had more interactions (for which the sum of received responses and contributions done is highest). The teacher can also perform a complementary analysis to relate students’ participation with academic success.
988 Andrés Muñoz et al. / Procedia Computer Science 00 (2017) 000–000 Andrés Muñoz et al. / Procedia Computer Science 121 (2017) 982–989 7
Fig. 5. (a) Centrality Graph – case study 1; (b) Degree Graph – case study 2.
4.2. Case study 2: Topics specials of Info communications MSG 2016 B
In this case study, we see much more participation of the students concerning the first case study. We also observe that groups have been formed within the network, led by the actors that have the thickest nodes. Being a masters’ course, it can be appreciated that students are interested in interacting with each other, and knowing the opinions expressed by their classmates. Fig. 5(b) shows the Degree Graph provided by the plugin for this case.
We can observe once again which the most notable actors of the network are. In fact, the graph also shows clearly that these actors establish groups within the network. An important point in this case study is that the responses to the teacher are much less than the responses to the main actors of the network. Indeed, there are even actors who do not interact with the teacher. The teacher in this case study should consider whether his/her contributions are raising enough interest for students to respond.
4.3. Case study 3: Informatics for Translation and Interpretation 2015/16
The last case study is the one that has more interactions. Despite having 2695 interactions, it has a low network density. However, we can see many useful data from this network. For instance, it can be seen that there are main actors in the middle of Fig. 6, and secondary actors that are the contour of the circle of the diagram.
. Fig. 6. Centrality Graph – case study 3.
8 Andrés Muñoz et al. / Procedia Computer Science 00 (2017) 000–000
Among the main actors, two of them are even more central than the others. This is because they connect with almost the entire network as a whole. In this case, the most central node is that of the teacher, which indicates that the contributions of the teacher in the forums provoked responses from all 132 students.
5. Conclusions and Future Work
With this work, a useful tool has been developed for the Moodle Virtual Learning Platform. It allows the teacher to analyse the behavior of his/her students when using the forums in the platform. Also, it allows the user to export the adjacency and collaborative matrices in the Pajek format so that metrics specific to the analysis of social networks can be taken.
The analysis of the three case studies shows a very different behavior for undergraduate and postgraduate courses. In postgraduate courses we have a much more participative network, that is, we observe high interaction between the students. In addition, it is always observed that four to five students stand out as the most participative of the network (this number depends on the number of actors that are in the network).
Social Networks Analysis in the Moodle platform should be understood as a powerful tool that allows to analyze valuable data of students’ behavior, with which both teachers and students can apply learning models and analysis of learning to improve the quality of education and student participation.
An important evolution of this work will be to verify if there is some correlation between the participation of the students in the forums and their academic success. Another future work direction is to improve the visual part of the plugin, including additional information to the visualization of nodes. Besides showing the distribution of the network, showing the value for each node of the applied metric is also considered of interest.
References
1. Castrillón E. Las redes sociales de Internet : también dentro de los hábitos. Anagramas. 2010. p. 107:116.
2. Ruiz C. B. Las redes sociales y la protección de datos hoy. Anu. la Fac. Derecho (Alcalá Henares), no. 2. 2009. p. 107:116.
3. Edwards G. Methods Review paper Mixed-Method Approaches to Social Network Analysis. ESRC Natl. Cent. Res. Methods, vol. NCRM.015, no. January. 2010. p. 1:30.
4. Chaudhary A. K, Warner L. A. Introduction to Social Network Research : Application of Social Network Analysis in Extension 1. IFAS Ext. Univ. Florida. 2015. p. 1:4.
5. Prell C. Social Network Analysis. Theory and Methodology. First. London: Sage Publications Ltd. 2011. 6. Faust K, Fitzhugh S. Social Network Analysis: Methods and Applications. No 20114. 1994
7. Scott J. Social network analysis: developments, advances, and prospects. 6th Decenn. SP17 Conf. 2011.
8. K. van Veen and Kratzer J. National and international interlocking directorates within Europe: corporate networks within and among fifteen European countries. Econ. Soc., vol. 40, no. 1. 2011. p. 1:25.
9. Bastian M, Heymann S, and Jacomy M´. Gephi: An Open Source Software for Exploring and Manipulating Networks,” Third Int. AAAI Conf. Weblogs Soc. Media. 2009. p. 361:362.
10. Saito R. A travel guide to Cytoscape plugins. Nat. Methods, vol. 9, no. 11. 2012. p. 1069:76.
11. Borgatti S. P, Everett M. G. and Freeman L. C. Ucinet for Windows: Software for Social Network Analysis,” Harvard Anal. Technol., vol. 2006, no. January, p. SNA Analysis software. 2002.
12. W. D. (Erasmus U. R. NOOY and V. B. (University of L. (), ANDREJ MRVAR (University of Ljubljana). Expl.oratory Social Network Analysis with Pajek. Cambridge Univ. Press, vol. 1, no. 9. 2005. p. 362.
13. Akhtar N., Javed H. and Sengar G. Analysis of Facebook Social Network. CICN’13 Proc. 2013 5th Int. Conf. Comput. Intell. Commun. Networks. 2013.
14. Csárdi G., Nepusz T. The igraph software package for complex network research. InterJournal Complex Syst., vol. 1695. 2006. p. 1695. 15. Yun Su. “Incubating: Social Network Analysis (SNA) Tool; 2017, [Online]. Available:https://moodle.org/plugins/mod_sna.
16. Moodle Pty Ltd, The Moodle Trademark; 2017, [Online]. Available: https://moodle.com/trademarks/.
17. Rajasingh I., Rajan B., Florence D. Betweeness-centrality of grid networks,” in ICCTD 2009 - 2009 International Conference on Computer Technology and Development, 2009, vol. p. 407:410.
Fig. 5. (a) Centrality Graph – case study 1; (b) Degree Graph – case study 2.
4.2. Case study 2: Topics specials of Info communications MSG 2016 B
In this case study, we see much more participation of the students concerning the first case study. We also observe that groups have been formed within the network, led by the actors that have the thickest nodes. Being a masters’ course, it can be appreciated that students are interested in interacting with each other, and knowing the opinions expressed by their classmates. Fig. 5(b) shows the Degree Graph provided by the plugin for this case.
We can observe once again which the most notable actors of the network are. In fact, the graph also shows clearly that these actors establish groups within the network. An important point in this case study is that the responses to the teacher are much less than the responses to the main actors of the network. Indeed, there are even actors who do not interact with the teacher. The teacher in this case study should consider whether his/her contributions are raising enough interest for students to respond.
4.3. Case study 3: Informatics for Translation and Interpretation 2015/16
The last case study is the one that has more interactions. Despite having 2695 interactions, it has a low network density. However, we can see many useful data from this network. For instance, it can be seen that there are main actors in the middle of Fig. 6, and secondary actors that are the contour of the circle of the diagram.
. Fig. 6. Centrality Graph – case study 3.
Among the main actors, two of them are even more central than the others. This is because they connect with almost the entire network as a whole. In this case, the most central node is that of the teacher, which indicates that the contributions of the teacher in the forums provoked responses from all 132 students.
5. Conclusions and Future Work
With this work, a useful tool has been developed for the Moodle Virtual Learning Platform. It allows the teacher to analyse the behavior of his/her students when using the forums in the platform. Also, it allows the user to export the adjacency and collaborative matrices in the Pajek format so that metrics specific to the analysis of social networks can be taken.
The analysis of the three case studies shows a very different behavior for undergraduate and postgraduate courses. In postgraduate courses we have a much more participative network, that is, we observe high interaction between the students. In addition, it is always observed that four to five students stand out as the most participative of the network (this number depends on the number of actors that are in the network).
Social Networks Analysis in the Moodle platform should be understood as a powerful tool that allows to analyze valuable data of students’ behavior, with which both teachers and students can apply learning models and analysis of learning to improve the quality of education and student participation.
An important evolution of this work will be to verify if there is some correlation between the participation of the students in the forums and their academic success. Another future work direction is to improve the visual part of the plugin, including additional information to the visualization of nodes. Besides showing the distribution of the network, showing the value for each node of the applied metric is also considered of interest.
References
1. Castrillón E. Las redes sociales de Internet : también dentro de los hábitos. Anagramas. 2010. p. 107:116.
2. Ruiz C. B. Las redes sociales y la protección de datos hoy. Anu. la Fac. Derecho (Alcalá Henares), no. 2. 2009. p. 107:116.
3. Edwards G. Methods Review paper Mixed-Method Approaches to Social Network Analysis. ESRC Natl. Cent. Res. Methods, vol. NCRM.015, no. January. 2010. p. 1:30.
4. Chaudhary A. K, Warner L. A. Introduction to Social Network Research : Application of Social Network Analysis in Extension 1. IFAS Ext. Univ. Florida. 2015. p. 1:4.
5. Prell C. Social Network Analysis. Theory and Methodology. First. London: Sage Publications Ltd. 2011. 6. Faust K, Fitzhugh S. Social Network Analysis: Methods and Applications. No 20114. 1994
7. Scott J. Social network analysis: developments, advances, and prospects. 6th Decenn. SP17 Conf. 2011.
8. K. van Veen and Kratzer J. National and international interlocking directorates within Europe: corporate networks within and among fifteen European countries. Econ. Soc., vol. 40, no. 1. 2011. p. 1:25.
9. Bastian M, Heymann S, and Jacomy M´. Gephi: An Open Source Software for Exploring and Manipulating Networks,” Third Int. AAAI Conf. Weblogs Soc. Media. 2009. p. 361:362.
10. Saito R. A travel guide to Cytoscape plugins. Nat. Methods, vol. 9, no. 11. 2012. p. 1069:76.
11. Borgatti S. P, Everett M. G. and Freeman L. C. Ucinet for Windows: Software for Social Network Analysis,” Harvard Anal. Technol., vol. 2006, no. January, p. SNA Analysis software. 2002.
12. W. D. (Erasmus U. R. NOOY and V. B. (University of L. (), ANDREJ MRVAR (University of Ljubljana). Expl.oratory Social Network Analysis with Pajek. Cambridge Univ. Press, vol. 1, no. 9. 2005. p. 362.
13. Akhtar N., Javed H. and Sengar G. Analysis of Facebook Social Network. CICN’13 Proc. 2013 5th Int. Conf. Comput. Intell. Commun. Networks. 2013.
14. Csárdi G., Nepusz T. The igraph software package for complex network research. InterJournal Complex Syst., vol. 1695. 2006. p. 1695. 15. Yun Su. “Incubating: Social Network Analysis (SNA) Tool; 2017, [Online]. Available:https://moodle.org/plugins/mod_sna.
16. Moodle Pty Ltd, The Moodle Trademark; 2017, [Online]. Available: https://moodle.com/trademarks/.
17. Rajasingh I., Rajan B., Florence D. Betweeness-centrality of grid networks,” in ICCTD 2009 - 2009 International Conference on Computer Technology and Development, 2009, vol. p. 407:410.