Functional prototype of a performance
management system for hospitality
Nuno Miguel da Conceição António
Project developed to obtain the
Master degree in hospitality administration and management
Project executed under the supervision of
Prof. Francisco Serra, PhD
Functional prototype of a performance
management system for hospitality
Nuno Miguel da Conceição António
Project developed to obtain the
Master degree in hospitality administration and management
Project executed under the supervision of
Prof. Francisco Serra, PhD
Functional prototype of a performance
management system for hospitality
STATEMENT OF AUTHORSHIP
DECLARAÇÃO DE AUTORIA DE TRABALHO
I declare that I am the author of this work, which is original and unpublished. Authors and works consulted are properly cited in the text and listed in the included list of references.
Declaro ser o autor deste trabalho, que é original e inédito. Autores e trabalhos consultados são devidamente citados no texto e constam da listagem de referências incluídas.
_______________________________
Copyright Nuno Miguel da Conceição António.
The University of the Algarve has the right to perpetually and without geographic boundaries, archive and publicize this work through copies reproduced on paper or any digital form, or by any known or to be invented medium, to release through scientific repositories and admit its copy and distribution for noncommercial, educational or research purposes, as long as credit is given to the author and the editor.
A Universidade do Algarve tem o direito, perpétuo e sem limites geográficos, de arquivar e publicitar este trabalho através de exemplares impressos reproduzidos em papel ou de forma digital, ou por qualquer outro meio conhecido ou que venha a ser inventado, de o divulgar através de repositórios científicos e de admitir a sua cópia e distribuição com objetivos educacionais ou de investigação, não comerciais, desde que seja dado crédito ao autor e editor.
ACKNOWLEDGMENTS
Although this is considered an individual work, due to its scope, extent and nature, without the contribution and the help of other persons I wouldn’t have been able to do it. Therefore, it’s indispensable that I thank them all for their support.
First of all, I would like to thank my supervisor, Professor Francisco Serra. Without his deep knowledge and expertise in hospitality, performance management, strategic management and technological background, complemented by his practical experience in the implementation of performance management systems I wouldn’t have been able to learn and put so much in practice, in such short of time. Moreover, despite the time restrictions required by his duties, his availability for meetings and conferences, for quickly revising documents and for pointing out guidelines proved to be crucial factors that allowed me to take this work to its end. I am sure that without his contribution, it would have been impossible to execute it, at least along similar lines.
In academic terms, I would like to thank also Professor Carlos Afonso who, together with Professor Francisco Serra, not only brought Data Analytics to my attention, but also introduced me to the existence of the Data Analyses course in Coursera.org (that I ended up completing to gain more knowledge for my research) and to the existence of the Design Science Research Methodology, which ended up being very important in the development of this work.
My last academic acknowledgment is to the ESGHT – Higher School of Management, Hospitality and Tourism of the University of the Algarve, for the preparation classes and for the provision of various means of research, without which, it wouldn’t have been possible to execute this work.
Another special educational acknowledge is due to The Data Warehousing Institute (TDWI), the recognized world leader in education and research in the business intelligence, data warehousing, and analytics industry, for granting me a scholarship for their World Conference (held in Las Vegas, USA - February 2014), which allowed me to have training in business intelligence and performance management and also obtain a certification in Business Analytics. What I learned there helped me
But this work wouldn’t have been possible without the hotels’ engagement. Unfortunately, to maintain the hotels unidentified and not reveal any confidential information, I am not able to mention the hotel’s names and the persons involved. Nevertheless, I would like to thank all of them. Not only the administrators and general managers who believed in the project and agreed to participate and give access to their information, but also to all team members, that even in the peak season took time to be available for project meetings, to answer questions and take notes on issues that they thought could be helpful for the project.
To Michael Kessler from ReviewPro and to Vibhu Bansal from Itsys a special thank you for understanding the academic nature of the project and enabling me to have special conditions to access to their companies data sources API’s.
Another special “thank you” to Edgar Santos for taking the time to explain me the Primavera ERP database structure and also to Mr. António Borralho, who also took some time to explain me the relations between the Portuguese SNC accounting system, USALI and the Primavera ERP.
I would also like to thank also my colleagues at Wareguest. Ruben Duarte for developing the project logo, Carlos Leote for his advices in web programming and Nelson Russa for allowing me to use his C# wrapper for the Highcharts javascript library, as well as helping me solving programming issues when I tried to expand his wrapper. Ana Oliveira, Zélia Freitas, Paulo Lopes and Nuno Pereira for taking their own time to execute the project’s heuristic evaluation. However, a special mention is due to my colleague Carlos Soares, not only for executing the heuristic evaluation, but also for helping me shape the project concept and together with Mr. Carlos Alexandre making it possible for Wareguest to fund my travel expenses to the TDWI conference, the data center usage and the costs to access the Reviewpro and Itsys API’s.
A big “thank you” to Rita Soares and Peter Bolton, who despite being “recruited” at the last minute, managed to find time to review the final document.
Another “thank you” is due to my companions of the board of PORTISUB – Clube
Subaquático de Portimão, for their understanding and availability during this last year
I would like to thank also my family and friends for supporting me and understanding my absence during this last year.
Last, but never the least, I would like to thank my wife Sofia. Without her comprehension, support and encouragement none of this would be possible.
ABSTRACT
This project involved the creation and real-life evaluation in four hotels, of a functional prototype of a performance management system specific for the hospitality industry, with the objective of testing the viability to develop a commercial service.
This system can be defined as a set of dashboards that enable the systematic monitoring of business information (goals, metrics and indicators - constructed from multiple data sources) that facilitate management decision-making.
To assert its viability, a three point evaluation criteria was established: (1) that there were no technical obstacles that could limit the system’s scope or performance; (2) that users would identify the benefits of using the system; and (3) that quantifiable improvements could achieved.
The system was designed based on distributing computing and agent architecture and its development followed the Design Science Research methodology, which also demonstrated its suitability for management research projects.
With the prototype’s development and its use by four hotels, it was possible to confirm that no technical aspects would condition the commercial viability of the system. The same can be said about the users’ perception of the system’s benefits, as they identified a long list of benefits and situations where the system could be used with better results than traditional decision making routines.
Although it was possible to verify that three of the participating hotels improved their operational indicators when compared to the previous year, due to calendar constraints and the inexistence of benchmarking data sets it was not possible to produce evidence that those performance improvements could be attributed to the use of the system.
Globally, these results - complemented by the request of all the participating hotels to continue to use the prototype and their willingness to pay in the future for a commercial service that provided the same information as the prototype - confirmed it’s viability and commercial relevance.
Keywords: dashboard, performance management, business intelligence, hospitality, data analytics.
RESUMO
Este projeto envolveu a criação de um protótipo funcional de um sistema de gestão do desempenho empresarial, especifico para a indústria hoteleira.
Este sistema pode ser definido como um conjunto de painéis de bordo que possibilita a monitorização sistemática da informação empresarial, o qual permite traduzir a estratégia da organização em objetivos, métricas e indicadores adaptados a todos os departamentos e colaboradores, facilitando o apoio à decisão, otimização de processos e um maior nível de proatividade.
O objetivo de criação deste protótipo foi o de testar a viabilidade de desenvolvimento de uma versão comercial de um serviço a ser distribuído sob a forma de Software as
a Service (SaaS), uma vez que como demonstrado na pesquisa bibliográfica, não
existe um sistema semelhante.
Para responder ao objetivo do projeto foram definidos três critérios de avaliação: (1) a existência obstáculos técnicos que pudessem limitar o âmbito ou o desempenho do sistema; (2) a identificação de benefícios pelos utilizadores; e (3) a constatação de melhorias quantificáveis resultantes da utilização do sistema.
O desenvolvimento do projeto foi precedido de uma exaustiva pesquisa bibliográfica, não só nos tópicos da gestão do desempenho a nível generalista e da sua aplicação na hotelaria, mas também nos tópicos em que os sistemas de gestão desempenho empresarial têm que estar assentes, como: Business Intelligence, Data Analytics, painéis de bordo e visualização de dados.
De modo a responder adequadamente aos requisitos que um sistema a ser distribuído no formato SaaS deve ter, nomeadamente os requisitos de resiliência e escalabilidade, a arquitetura do sistema foi desenhada no âmbito da computação distribuída e de agentes resilientes. Essa arquitetura foi concebida em três camadas, cada uma composta por um conjunto de vários componentes (serviços/aplicações/agentes):
• Fontes de dados: o Do hotel:
§ Sistema de gestão financeira/contabilidade (ERP). o Externas:
§ Meteorologia; § Reputação social;
§ Preços e disponibilidades em venda on-line. o De introdução manual:
§ Procura e oferta do mercado – entidades oficiais; § Oferta do mercado – STR;
§ Orçamentos e objetivos. • Data center:
o Web services:
§ Serviço para recepção de dados de PMS; § Serviço para recepção de dados de ERP. o Aplicações:
§ Orquestrador dos agentes de leitura, transformação e carregamento de fontes de dados, também conhecido como
Extract, Transform and Load (ETL);
§ Agente ETL de dados meteorologia;
§ Agente ETL de dados de reputação social;
§ Agente ETL de dados de preços e disponibilidade em venda
on-line.
o Bases de dados:
§ Base de dados transacional onde são arquivados todos os dados gerais do sistema e geridas as filas de tarefas, bem como os dados lidos das várias fontes e os respectivos metadados; § Base de dados transacional por unidade hoteleira;
§ Base de dados dimensional por unidade hoteleira. • Visualização de dados:
o Portal:
§ Painéis de bordo; § Scorecards; § Pivot tables.
Para aferir a viabilidade do protótipo do sistema, o mesmo foi disponibilizado a quatro hotéis da região algarvia, com características comuns, mas com modos de operação distintos, onde esteve em funcionamento pleno e avaliação, durante os meses de Julho e Agosto de 2014.
Contudo, os hotéis estiveram envolvidos no projeto quase desde o seu início, pois o desenvolvimento do mesmo foi baseado na metodologia Design Science Research (traduzida para Português por alguns autores como “Ciência do projeto”) - uma metodologia relativamente recente e com cada vez mais defensores, inclusivamente nas disciplinas de gestão. Esta metodologia tem como paradigma o desenvolvimento de soluções para problemas práticos e portanto, de utilidade comprovável. Deste modo, os hotéis contribuíram ativamente para a sua elaboração, tendo o seu
feedback sido utilizado ao longo das várias interações de desenvolvimento,
demonstração e avaliação, para melhor adequar o sistema às suas necessidades e a definir a prioridade de implementação dos diversos requisitos.
Apesar da limitação do calendário escolar e do tempo de desenvolvimento do protótipo ser previsivelmente longo, o que limitou o período de tempo de avaliação do protótipo nos hotéis, este acabou por revelar resultados bastante positivos, confirmando inequivocamente a viabilidade de criação do sistema enquanto serviço comercial, se tivesse sido esse o objetivo da sua implementação.
Dos pontos de vista técnico e da percepção dos utilizadores sobre os benefícios do sistema, os excelentes resultados não deixam qualquer dúvida sobre a pertinência do mesmo. Do ponto de vista da quantificação da melhoria do desempenho dos hotéis, foi possível constatar que as 3 unidades hoteleiras apresentaram melhorias consideráveis no desempenho dos seus principais indicadores operacionais face ao mesmo período no ano anterior. Contudo, devido a vários fatores como o curto período de tempo que o sistema esteve em avaliação nos hotéis, o período de avaliação ter decorrido na chamada “época alta” e a inexistência de dados de
benchmarking oficiais à data de elaboração deste documento, não permitem afirmar
inequivocamente que o sistema contribuiu para a melhoria do desempenho nos hotéis.
Tecnologicamente, a ausência de problemas encontrados ao nível da extração dos dados primários existentes nas diversas aplicações dos hotéis participantes (adequação, precisão, confiabilidade e atualidade) e o desempenho das várias componentes de hardware e software mostraram um elevado grau de performance e fiabilidade. Também o facto de os utilizadores identificarem benefícios que obtiveram pela utilização do sistema, tais como melhoria dos preços médios praticados a partir das informações fornecidas pelas análises de reputação social e comparação de preços publicados na internet, demonstra que o mesmo constitui uma mais-valia importante para os processos de decisão.
Todos concordaram que poderão tirar ainda melhor partido do sistema, através do uso das suas componentes analíticas para realizar melhor planeamento, orçamentos e planos de marketing, ou seja, tomar decisões com base em informação e conhecimento e não com base na intuição, que é justamente, um dos propósitos deste tipo de sistemas.
Por tudo isto, e até por todos os hotéis participantes terem pedido para continuar a utilizar o sistema após o período de avaliação, e também por terem revelado receptividade em adquirir o mesmo na eventualidade de este ser disponibilizado como um serviço pago, deu-se como alcançado o objetivo de comprovar a viabilidade de desenvolvimento de um serviço comercial baseado no protótipo testado.
Complementarmente, o desenvolvimento deste projeto permitiu ainda comprovar a adequabilidade da metodologia Design Science Research à investigação em gestão, ao demonstrar que o desenvolvimento de um artefacto, neste caso, um protótipo funcional concebido com relevância e rigor, pode resolver um problema até agora não endereçado por outros sistemas de gestão para hotelaria, nomeadamente a integração de dados de várias fontes de modo a servir como ferramenta de apoio à decisão empresarial.
Palavras chave: painel de bordo, desempenho empresarial, hotelaria, business
TABLE OF CONTENTS INTRODUCTION ... 1 Context ... 2 Scope ... 3 Document structure ... 3 2 LITERATURE REVIEW ... 5 2.1. Performance management ... 5 2.2. Business intelligence ... 8 2.3. Data Analytics ... 13 2.4. Dashboards ... 16 2.5. Data visualization ... 19
2.6. Performance management in hospitality ... 20
3 METHODOLOGY ... 24
3.1 Problem identification and motivation ... 24
3.2 Selection of the methodology ... 25
3.3 Research entry point ... 28
3.3.1 System concept ... 28
3.4 Data sources ... 29
3.5 Activities sequence ... 31
4 PROTOTYPE DEVELOPMENT AND TESTING ... 33
4.1 Iteration 1 ... 33
4.1.1 Defining the system’s objectives ... 33
4.1.2 Design and development ... 44
4.1.3 Demonstration ... 44
4.2 Iteration 2 ... 47
4.2.1 Solution objectives definition ... 47
4.2.2 Design and development ... 48
4.2.3 Visualization layer ... 50
4.2.4 Demonstration ... 53
4.2.5 Evaluation ... 58
4.3 Iteration 3 ... 59
4.3.1 Solution objectives definition ... 59
4.3.2 Design and development ... 60
4.3.3 Demonstration ... 61
4.3.4 Evaluation ... 65
4.4 Iteration 4 ... 66
4.4.1 Solution objectives definition ... 66
4.4.2 Design and development ... 66
4.4.3 Demonstration ... 67 4.4.4 Evaluation ... 71 4.4.5 Communication ... 73 5 RESULTS ... 74 5.1 Experimental method ... 74 5.2 Testing ... 74 5.3 Observational method ... 75
5.3.1 User information logs ... 79
5.4 Analytical ... 83 5.4.1 Server performance ... 83 5.4.2 Data sources ... 84 5.4.3 Security ... 85 5.4.4 Heuristic evaluation ... 85 5.4.5 Hotels performance ... 86 6 DISCUSSION ... 87 6.1 Technical perspective ... 87 6.2 Business perspective ... 89
7 CONCLUSIONS ... 93
7.1 Limitations and recommendations ... 94
BIBLIOGRAPHIC REFERENCES ... 97
APPENDIXES ... 110
APPENDIX I - SUMMARY OF RECENT PUBLICATIONS THAT ADDRESS THE NEED FOR BI/DA APPROACHES IN HOSPITALITY ... 111
APPENDIX II - LIST OF BI/DASHBOARD SYSTEMS/APPLICATIONS ... 112
APPENDIX III - PROJECT ACTIVITIES GANTT CHART ... 114
APPENDIX IV - LIST OF CHARACTERISTICS A PM SYSTEM SHOULD HAVE . 116 APPENDIX V - SOFTWARE REQUIREMENTS SPECIFICATION ... 118
APPENDIX VI - PRESENTATION SLIDES MADE TO HOTELIERS ... 144
APPENDIX VII - NON-DISCLOSURE AGREEMENT TEMPLATE ... 149
APPENDIX VIII - SYSTEM ARCHITECTURE DIAGRAM – ITERATION 2 ... 150
APPENDIX IX - LIST OF MEASURES, METRICS AND INDICATORS ... 151
APPENDIX X - GENERAL FEATURES OF THE WEBSITE ... 157
APPENDIX XI - MASTER DATABASE ENTITY RELATIONSHIP DIAGRAM ... 161
APPENDIX XII - TRANSACTIONAL DATABASES ENTITY RELATIONSHIP DIAGRAM ... 162
APPENDIX XIV - SLIDES OF PRESENTATION MADE TO HOTELIERS ON
ITERATION 2 ... 169
APPENDIX XV - WEATHER – CURRENT/FORECAST PAGE ... 175
APPENDIX XVI – WEATHER – DASHBOARD PAGE ... 176
APPENDIX XVII - CI PRICES AND INVENTORIES PAGE ... 177
APPENDIX XVIII - CI - SOCIAL REPUTATION PAGE ... 178
APPENDIX XIX - SOCIAL REPUTATION PAGE ... 179
APPENDIX XX - SYSTEM ARCHITECTURE DIAGRAM – ITERATION 3 ... 180
APPENDIX XXI - PMS – SCORECARD PAGE ... 181
APPENDIX XXII - PMS – ANALYTICS PAGE ... 182
APPENDIX XXIII - MARKET – OFFICIAL STATISTICS PAGE ... 183
APPENDIX XXIV - MARKET – STR COMPETITIVE SET ... 184
APPENDIX XXV - PERFORMANCE DASHBOARD PAGE (DEFAULT) ... 185
APPENDIX XXVI - BALANCED SCORECARD PAGE ... 186
APPENDIX XXVII - FINANCIAL RESULTS PAGE ... 187
APPENDIX XXVIII - AD HOC REPORTS PAGE ... 188
APPENDIX XXIX - SSL CERTIFICATE ... 189
APPENDIX XXX - SERVER SECURITY ASSESSMENT REPORT ... 190
TABLE OF FIGURES
Figure 2.1: PM Process ... 7
Figure 2.2: Intelligence hierarchy ... 9
Figure 2.3: Tools and capabilities of BI ... 10
Figure 2.4: Intelligence hierarchy impact on ROI ... 13
Figure 2.5: Number of publications with BI and Analytics terms as keywords ... 14
Figure 2.6: PM Analytics ... 15
Figure 2.7: MAD Framework ... 17
Figure 2.8: Summary of dashboard research paths with implications for design ... 19
Figure 2.9: Data science Venn diagram ... 23
Figure 3.1: The DSRM process model ... 28
Figure 3.2: Project activities sequence diagram ... 32
Figure 4.1: System concept diagram ... 33
Figure 4.2: A Comparison of dashboard data architecture ... 35
Figure 4.3: Orchestrator and agents running on the system server ... 50
Figure 4.4: Relationship among disciplines, fields and practices in ID ... 51
Figure 4.5: Website areas ... 52
Figure 4.6: Example of chart drilldown ... 56
Figure 4.7: Bullet chart ... 68
Figure 5.1: Logins per hotel, per day ... 79
Figure 5.2: Weighted global visits per page ... 82
TABLE OF TABLES
Table 2.1: Traditional BI vs BI for PM comparison ... 12
Table 3.1: DSR Guidelines ... 27
Table 4.1: The seven characteristics of KPIs ... 36
Table 4.2: Indicators properties taxonomy ... 37
Table 4.3: Indicators taxonomy template ... 38
Table 4.4: Data sources ... 40
Table 4.5: List of selected hotels ... 46
Table 4.6: Bullet chart colors ... 69
Table 5.1: Absolute number of visits per page/menu option ... 80
Table 5.2: Weighted number of visits per page/menu option ... 80
Table 5.3: Absolute time spent (in seconds) per page/menu option ... 81
Table 5.4: Weighted time spent (in seconds) per page/menu option ... 81
Table 5.5: Databases size ... 83
ACRONYMS AND ABREVIATIONS • ABW – Average Booking Window.
• ALOS – Average Length of Stay.
• API – Application Programming Interface. • ARR – Average Room Rate.
• BA – Business Analytics. • BI – Business Intelligence. • BSC – Balanced Scorecard. • CI – Competitive Intelligence.
• CRM – Customer Relationship Management. • DA – Data Analytics.
• DS – Design Science.
• DSR – Design Science Research.
• DSRM – Design Science Research Methodology. • DSS – Decision Support System.
• EBITDA – Earnings Before Interest, Taxes, Depreciation and Amortization. • ETL – Extract, Transform and Load.
• GOP – Gross Operating Profit.
• GOPPAR – Gross Operating Profit Per Available Room. • GRI – Global Review Index.
• HCI – Human-Computer Interaction. • ID – Interaction Design.
• IIS – Microsoft Internet Information Server. • INE – Instituto Nacional de Estatística. • IS – Information Systems.
• IT – Information Technology. • LY – Last Year.
• MTD – Month-To-Date.
• OE – Operational Excellence.
• OTA – Online Travel Agencies. • PD – Performance Dashboard. • PM – Performance Management. • QoS – Quality of Service.
• RevPAR – Revenue per Available Room. • RM – Revenue Management.
• SaaS – Software as a Service.
• SNC – Sistema de Normalização Contabilística (Accounting normalization system).
• SR – Social Reputation.
• SRS – Software Requirements Specification (document). • TP – Turismo de Portugal.
• TRevPAR – Total Revenue per Available Room.
• USALI – Uniform Systems of Accounts for the Lodging Industry. • WS – Web Services.
GLOSSARY
• Big data – collection of data sets that are so large and complex that they require advanced and unique data storage, management, analysis and visualization technologies.
• Data mart - a departmentalized structure of data feeding from the data warehouse where data is de-normalized based on the department’s/user’s need for information (Inmon, 2002).
• Data mining - the process of analyzing large amounts of data in search of previously undiscovered business patterns (Inmon, 2002).
• Data warehouse - a collection of integrated, subject-oriented databases designed to support the decision support system function, where each unit of data is relevant to some moment in time. The data warehouse contains atomic data and lightly summarized data (Inmon, 2002).
• Json – Javascript Object Notation. Open standard to transmit data objects as human-readable text consisting of attribute-value pairs.
• Metadata – commonly defined as data about data or data that describes data. • RESTful – web services that are in conformity with the Representational State
Transfer (REST), an abstraction of the World Wide Web architecture.
• ROI – Return on Investment. From an economic standpoint can be described as the profit in relation to the invested capital.
• SOAP – Simple Object Access Protocol. Protocol specification used in the exchanging of structured information in computer networks, mostly used with the use of web services.
• Web service – software system designed to support interoperability between electronic devices over a network.
• XML – Extended Markup Language. Markup language that defines a set of rules to encode documents in a format that is both human and machine-readable.
INTRODUCTION
The main objective of this project is to evaluate the viability of developing a commercial service1 of a Performance Management (PM) software system for
the hospitality industry, that by using dashboards, presents a broad set of metrics and Key Performance Indicators (KPIs) on the hotel’s performance to all hotel staff, regardless of their hierarchy and department, as a tool to give feedback and enable faster adoption/correction of actions to better align the hotel’s performance with its strategy and goals.
To accomplish this objective, since no such system specific for the hospitality industry seems to exist (see Chapter 2), a prototype was built. To assess this viability, the results were evaluated on three perspectives, which could be interpreted as research questions:
• Q1 - Are there any technical issues that can limit the scope and performance of the system itself?
• Q2 - Does the hotel’s staff identify the benefits of using the system? • Q3 - Is it possible to identify quantifiable improvements in the hotels
performance?
Although the main objective of this project was the prototype instantiation, its development shouldn’t be considered the only objective. The knowledge, abstracted, representative and generalized (to a degree), obtained from prototyping, was another important objective of the research. As defended by Zheng (2009), prototyping should be considered a vehicle to learn the problem domain, seek a solution and finally create knowledge. Therefore, while trying to answer the project questions, was expectable that other important aspects could also be learned and assessed during the development of the prototype, such as:
• Technical obstacles in accessing proprietary databases;
1 “Service” because as a cloud-based system, it should be available to hotels on the SaaS – Software as a Service model, paid by usage period, rather than a product installed locally on their premises and paid as a one-time-fee only.
• Unavailability of data to produce some of the metrics; • Database performance issues;
• User’s reluctance to use the system or the need for a formal strategic plan.
Context
The phrase “If you can’t measure it, you can’t manage it” was attributed to the renowned writer, professor and management consultant, Peter Drucker. However the Institute created with his name2 to foment the transformation of his ideas and legacy into action, have clarified this by saying that this is an incorrect quote (Zak, 2013). In fact, what Drucker (1993) wrote in his book “Management: Tasks, responsibilities, practices” was:
“Work implies not only that somebody is supposed to do the job, but also
accountability, a deadline, and finally the measurement of results, that is, feedback from results on the work and on the planning process itself”, which is
substantially different and has a more holistic approach. It has to be seen as an argument on the field of strategic management and operational excellence, as of the need during the planning process to establish measures for actions as a way to have feedback and improve processes about those actions, and cannot be reduced to the measurement perspective.
As identified by Bititci, Mendibil, Nudurupati, Garengo, & Turner (2006), performance measurement systems, through cultural change in organizations, lead to a more participative and consultative management style, which drive continuous improvement and lead to significant performance improvements on the five case studies they reviewed. Similarly conclusions were found by Franco-Santos, Lucianetti, & Bourne (2012). From 76 empirical studies the authors identified that performance measurement systems had a significant impact on people’s behavior, organizational capabilities, and performance. Moreover, they came to the conclusion that performance measurement systems
play a key role in strategy, communication and management processes that enable organizations to excel.
Scope
Although organizations that pursue Operational Excellence (OE) require the development and implementation of a strategy that enables them to implement actions to obtain the desired goals, it’s outside the scope of this work to introduce the subject of OE and how strategic plans should be conceived and communicated to all members of an organization in order for the organization to achieve better performance.
This research project, above all, focuses on the requirements and the process of development, implementation and evaluation of a PM system that should be used as a tool, part of an OE program, to provide better results, therefore, it explores mainly the technology and the hotel expertise aspects of the system, other than the strategy required to fully take advantage of it.
As a consequence, this project identifies the main characteristics of a PM system and the required technology concepts to implement it, such as dashboards, Business Intelligence (BI) and Data Analytics (DA). It also identifies the areas of expertise in hospitality where the system could have more impact and that should be addressed on the prototype, such as Revenue
Management (RM), Social Reputation (SR), common hotel metrics/KPIs,
supply/demand analysis, among others.
Document structure
In addition to this introductory chapter, this document has six other chapters. The document’s structure and its chapters is not similar to would be expected in a Master of Science thesis, because this work was submitted as a project, particularly, as a software development project, not as a regular research thesis. For this reason, the structure, besides the scientific and contextual component of the research, also reflects the software development and implementation component.
The other chapters that are part of this document are:
• Chapter 2 – Literature review: introduces the current knowledge on PM systems along with its components of BI, DA, dashboards and data visualization, which are key features of this project. The chapter ends with a description of the state of the art on PM systems in hospitality; • Chapter 3 – Methodology: presents the methods used for the definition
of system concepts, the metrics and KPIs used in the system, as well as the necessary data to calculate them, and finally, and an overview of the design science research methodology used for the system development process;
• Chapter 4 – Prototype development and testing: describes the design, elaboration, demonstration and evaluation activities of the different development iterations;
• Chapter 5 – Results: presents the results obtained from the system usage data, users and experts evaluation as well as overall results; • Chapter 6 – Discussion: debates the results presented in the previous
chapter;
• Chapter 7 – Conclusions: presents the conclusions gathered from the results obtained and also some limitations found in the project, as well as some recommendations for future research and development.
Also, there are several appendixes available at the end of the document containing, among other pieces, the full software specifications used as guidelines for the project development.
The companion DVD also includes the project source code and databases, as well as links to enable the system evaluation.
Due to the multi-disciplinarily scope of this research project, it is recommend that readers are familiarized not only with the field of hospitality management, but also with Information Technology (IT), PM and accounting.
2 LITERATURE REVIEW
For a thorough and broad review of literature, as recommend by Webster & Watson (2002) a structured approach was used to determine the source materials and identify the ones relevant to the subject and scope of the project. This approach involved:
1. Search of major journals, scientific databases (Web of Knowledge, Web of Science, Journal Citation Reports, among others) and magazines, amid other scientific sources;
2. Going backward by reviewing the citations found in papers (and other documents) identified during the search.
3. Going forward by finding papers that cited the discovered papers.
However, because of the highly technical subject of the project and the speed at which technology changes and progresses, with the objective of obtaining the most recent perspectives about the topics covered, other electronic sources like magazines, blogs, industry conference proceedings, industry reports and additional sources were also surveyed during the period from August 2013 to February 2014.
In order to obtain a large number of sources the searches were made in English, Portuguese and Spanish.
2.1. Performance management
There are some misperceptions about the definition of the term Performance
Management (Howson, 2007). Accordingly to Cokins (2009) this is in part due
to semantics and language. Often, acronyms like Business Performance
Management, Corporate Performance Management and Enterprise
Performance Management, are seen on the media, but lately there has been a
move to converge all these expressions into Performance Management.
In spite of the difficulty in settling for a definition, as explained by Eckerson (2011), today, PM is outlined in a very embracing way as “the combination of processes and technologies that help an organization measure, monitor, and
manage its business to optimize performance and achieve goals”. Yet, some authors have a different understanding and differentiate between Performance
Management and Performance Measurement. Whereas some argue that Performance Management and Performance Measurement are different
disciplines that follow one another in an interactive process (Lebas, 1995), others suggest that the more recent literature shows a clear tendency to merge the bodies of knowledge from the two areas (Folan & Browne, 2005).
Traditionally, Performance Measurement was related to systems that were primarily based on information recollected from accounting systems (Yigitbasioglu & Velcu, 2012). A turning point occurred when Kaplan & Norton (1992) introduced “The Balanced Scorecard” (BSC) and suggested the use of both financial and non-financial metrics in performance measurement. This became essential to have an holistic performance rating of an organization (Neumann & Cauvin, 2008), which evolved from being a system to measure important metrics to becoming Performance Management, “the process of managing an organization’s strategy” (Cokins, 2009).
Eckerson (2011) supports that PM is not about improving an organization performance in general, but it “is about improving performance in the right direction”. The author also refers to the fact PM bridges the gap between strategy and execution, resulting in three major benefits for organizations:
1. Improved communication – using dashboards and scorecards tailored to individual roles, executives can better communicate strategy and expectations to managers and staff at all levels;
2. Improved coordination – by fostering collaboration through the exchange
of ideas and information between the organizational levels, units and departments;
3. Improved control – using up-to-date information on market conditions and
operational processes, the staff can better adjust plans and fix/improve operations in a timely manner.
The same author, as depicted in Figure 2.1, suggests a framework that describes the components of PM and how it should work.
Figure 2.1: PM Process
This closed-loop process turns strategy into action in four steps that revolve around integrated data and metrics that provide the vocabulary and means for measuring performance across whole organization.
Some authors like Cokins (2009) are already referencing a PM 2.0 as an advance over PM 1.0. The author describes this “new” PM as placing more emphasis on strategy execution. The author declares, “Its purpose is not just better reporting and monitoring dashboard dials, but moving the dials and improving performance”. The author also asserts that additional features of PM
2.0 are analytical tools such as segmentation or statistical correlation analysis,
that can be seamlessly embedded within all of the various methodologies to accelerate and improve decision making and risk management. In addition the author also refers to the fact that PM 2.0 is defined by terms like “optimized, unified, integrated, holistic and synchronized” but to achieve this vision organizations have to reduce the myriad of independent and legacy IT systems and build integrated ones, instead.
2.2. Business intelligence
Report and analytical tools are major features of the PM process, since these are the tools that support the strategy’s execution.
Although Turban, Sharda, Delen, & King (2010) claim that the term Business
Intelligence was only coined in the mid-1990s by the Gartner Group, other
authors say the term was created back in 1958 by an IBM engineer who defined it “as the ability to comprehend the interrelationships of presented facts in such a way as to guide action towards a desired goal” (in Garret, 2012). Albeit with the passing of time the various definitions seem to agree on the same principles of what BI is. A commonly accepted definition is the one created by Turban et al. (2010) that describes BI as “an umbrella term that combines architectures, tools, databases, analytical tools, applications, and methodologies”. Other authors, like Liebowitz (2006), prefer the more goal oriented definition of the Knowledge Management and Business Intelligence Workshop (2005) which states that BI is an “active, model-based, and prospective approach to discover and explain hidden, decision-relevant aspects in large amounts of business data to better inform business decision processes”.
These definitions are highly related to the definition of PM. Turban et al. (2010) state that PM is an emerging portfolio of applications and methodologies that contains evolving BI architecture in its core. For the authors, PM “extends the monitoring, measuring, and comparing of sales, profit, cost, profitability, and other performance indicators by introducing the concept of management and feedback”.
The same authors define the major BI objective as:
“To enable interactive access (sometimes in real time) to data, to enable manipulation of data, and to give business managers and analysts the ability to conduct appropriate analysis. By analyzing historical and current data, situations, and performances, decision makers get valuable insights that enable them to make more informed and better decisions. The process of BI is based on the transformation of data to information, then to decisions, and finally to
This transformation of data into actions is very simply illustrated in what Liebowitz (2006) calls the “intelligence hierarchy” as depicted on Figure 2.2.
Figure 2.2: Intelligence hierarchy
Source: Adapted from Liebowitz (2006)
This transformation is built around four main types of capital from the organization’s intelligence (Liebowitz, 2006):
• Human: knowledge embodied in the organizations employees;
• Structural: knowledge embedded in the company like databases, property rights, among others;
• Relationship: social capital learned from customers and stakeholders; • Competitive: obtained from knowing what competitors are doing.
A subset of BI that is gaining more importance as time goes by is Competitive
Intelligence (CI). With its goal of providing a balanced picture of the
environment to decision makers (Sauter, 2010), CI is “involved with developing a systematic program for capturing, analyzing and managing external (and internal) information and knowledge to improve the organization’s decision-making capabilities”. This primarily external involvement of CI, brings to BI the capacity of not only focusing on the information available internally, but also on externally available information like competitors performance and market demand to produce better results and provide a wider perspective of the environment.
As a result of the need to transform data into actions, taking in account the types of capital and the areas where BI should be used to drive profit impact, a BI system must include tools, capabilities and techniques as portrayed in Figure 2.3. Not all of them are present in every BI system, but the most sophisticated ones include most of them.
Figure 2.3: Tools and capabilities of BI
Because some of these tools, capabilities and techniques are in the core of this project, a more detailed explanation about some of them is due:
• Decision Support Systems (DSS): are computer-based systems that facilitate choices by helping decision makers with the organization of information and modeling of outcomes (Sauter, 2010);
• Executive Information Systems/Executive Support systems: these systems emerged when analytical capabilities and multidimensional reports, as well as other visualization tools were added to DSS (Turban, Sharda, & Delen, 2011);
• Data warehouse: a collection of integrated, subject-oriented databases designed to support the DSS function, where each unit of data is relevant at some moment in time. The data warehouse contains atomic data and lightly summarized data (Inmon, 2002). Today, it includes not only historical data, but also current data so that it can provide real-time decision support (Turban et al., 2011);
• Online Analytical Processing (OLAP): is a multidimensional database management system technology that enables, with very good performance, to summarize and aggregate the data available in the data
warehouses (Inmon, 2002). It focuses on analyzing and exploring data, whereas query and report tools put more emphasis on accessing data for monitoring purposes (Howson, 2007);
• Extract, Transform and Load (ETL): ETL technologies are instrumental in the process and use of data warehouses. The ETL is an integral component of any data-centric project (Turban et al., 2011). This process consists on the extraction (reading data from different sources), transformation (reviewing the data quality and adapting it to the data warehouse structure according to previously defined rules) and loading (storing the data in the data warehouse);
• Dashboards: Few (2006), as commonly accepted, described a dashboard as “a visual display of the most important information needed to achieve one or more objectives; consolidated and arranged on a single screen so the information can be monitored at a glance”. As the author outlined, the key objective of dashboards is to display information at a glance.
Some authors, like Ballard et al. (2005) argue that BI for PM has some differences from “traditional BI”, particularly because BI for PM needs to focus more on operational decision making and therefore needs to be more proactive and timely, supporting a wide range of business users. A comparison between “traditional” and PM-based BI can be seen on Table 2.1.
Table 2.1: Traditional BI vs BI for PM comparison
Category Traditional BI BI for PM
Implementation Departmental Enterprise-wide
Focus Historical Timely, right-time or real-time Decisions Strategic and tactical Strategic, tactical and operational Users Business analysts Everyone
Orientation Reactive Proactive
Output Analyses Recommendations and actions
Process Open-ended Closed-loop
Measures Metrics Key performance indicators (KPIs) and actionable (in-context) metrics
Views Generic Personalized
Visuals Tables, charts and reports Dashboards and scorecards Collaboration Informal Built-in
Interaction Pull (ad hoc queries) Push (events and alerts)
Analysis Trends Exceptions
Data Structured Structured and unstructured
Source: Adapted from Ballard et al. (2005)
As seen in
Figure 2.4, in the analogy between the human brain and software systems presented by Cokins (2009), transactional systems and BI/PM systems are on a completely different level in terms of the intelligence hierarchy and in terms of the Return On Investment (ROI) they represent to organizations. However, this ROI is only achievable when BI investments are connected to specific business goals, analysis, decisions and actions that result in improved performance (Williams & Williams, 2007).
Figure 2.4: Intelligence hierarchy impact on ROI
On the other hand, implementing a BI system requires technology, but that itself isn’t enough, because if business’s processes aren’t adapted to capitalize it, the investment will be counterproductive (Williams & Williams, 2007). But, as these authors say, without BI it is extremely difficult for managers to cope with modern business complexity. If organizations want to innovate, establish competitive advantage and deliver strong profit growth, they have to adopt BI and readjust their business processes.
2.3. Data Analytics
Data Analytics (DA) similarly to other disciplines, is identified by different names
like Business Analytics (BA), Statistical Analysis, Data Mining or simply
Analytics (Scarisbrick-Hauser, 2007). DA is a subset of BI (Davenport & Harris,
2007). These authors define DA as “the extensive use of data, statistical and quantitative analysis, explanatory and predictive models, and fact-based management to drive decisions and actions”.
DA was introduced in the late 2000’s to represent the key analytical component of BI (Davenport, 2006). Lately, terms like Big Data and Big Data Analytics also started to be used to describe data sets and analytical techniques that are so large and complex that they require advanced and unique data storage, management, analysis and visualization technologies (H. Chen, Chiang, & Storey, 2012).
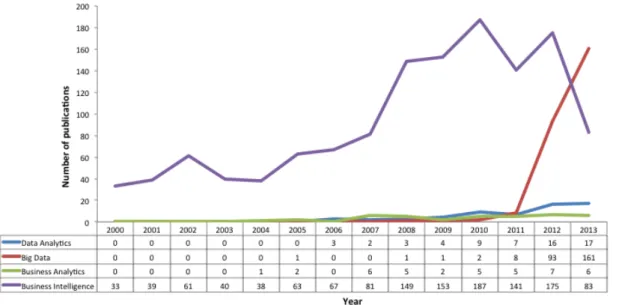
In a 2011 survey, deployed to over 4000 IT professionals, from 93 countries and 25 industries, DA was identified as one of the major technological trends in the 2010’s (H. Chen et al., 2012). In the academic community, BI and DA fields are also getting increased importance. Research on the evolution of the number of publications, conducted on the B-ON Portal3, concerning publications that have as main topics BI, DA and related terms, shows, as detailed in Figure 2.5, that the number of publications with BI as a keyword is the only that is declining (maybe because it’s also the older and more consolidated concept). Contrarily, the number of publications who have DA, Big Data and Business Analytics as keywords (more recent concepts), have increased.
3 B-ON is an online portal that enables scientific institutions in Portugal to search papers, books and other contents in thousands of scientific publications, databases and other sources like Web of Science, Academic Search Complete,
British Library Public, Library of Congress, Elsevier, Springer, among others. Figure 2.5: Number of publications with BI and Analytics terms as keywords
This increasing importance can be attributed to the need of organizations to become more effective and efficient in their operations (Turban et al., 2011), because high-performance business processes are among the last points of differentiation between organizations. Previous factors such as unique geographical positioning, protective regulation, political uncertainty and commoditization no longer apply.
Many industries offer similar products and use comparable technology (Sauter, 2010; Bose, 2009; Davenport & Harris, 2007), consequently, differentiation between them has to be achieved by making better informed, evidence-based decisions through the use of improved predicting tools (Sauter, 2010).
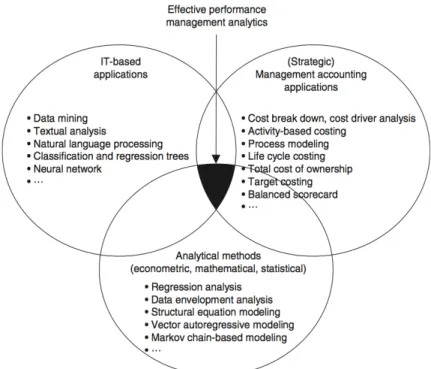
Several authors like Schultz (2004) and Schläfke, Silvi, & Möller (2013) have acknowledged the growing importance of DA in PM and its connection to the organization’s strategy. Schläfke et al. (2013) even went further and proposed a framework where they defined the relation between IT-based applications, management/accounting applications and analytical methods (depicted in Figure 2.6 as Performance Management Analytics - “the extensive use of data and analytical methods to understand relevant business dynamics, to effectively control key performance drivers, and to actively increase organizational performance”.
2.4. Dashboards
Dashboards are the visualization entry point for PM. Dashboards enable staff at all levels of the organization to view all key facts/metrics and start the exploration of the data (Schultz, 2004). Dashboards are the primary vehicle for communicating PM within the organization (Dover, 2004). When used with a powerful analytical engine, dashboards have the potential to get the right information presented to key users at the most valuable time.
Besides the previously cited definition by Few (2006) that a dashboard is a way to monitor, at a glance, the most important information needed to achieve one or more objectives, in the context of PM, Eckerson (2011) deepened that definition and concept. He entitled it Performance Dashboards (PD) and expressed it as “a layered information delivery system that parcels out information, insights, and alerts to users on demand so they can measure, monitor, and manage business performance more effectively”.
According to Eckerson (2011), PD should be much more than screens populated with impressive graphics. They should be “full-fledged business information systems designed to help organizations optimize performance and achieve strategic objectives”. As a result, the author, states that the terms “PD system” or “PM system” are equivalent and that the two are interchangeable. According to the author, a PM system should have three significant features that he called the “three threes”:
• Three applications – set of functionalities designed to fulfill specific user requirements:
o Monitoring: enable users to monitor performance against metrics aligned with the organization’s strategy;
o Analysis: enable users to explore data across many dimensions and organizational hierarchies. To allow this, systems must use a variety of technologies, capabilities and methods as the ones associated with DA and BI;
decision-• Three layers – based on the MAD (monitor, analyze and drill to detail) framework that defines how the dashboard should section information in layers (see Figure 2.7):
o Graphical, metrics data: provide a graphical view of performance metrics, usually in the form of charts and alerts;
o Summarized, dimensional data: dimensional data navigable by users per subject and hierarchy, where users can slice and dice, drill up/down or pivot data to view exceptions and trends from any perspective;
o Detailed, transactional data: let users reach the more atomic level of data and analyze the transactional data if that is needed to understand the cause of a problem.
• Three types – these types emphasize the three applications and three layers:
o Operational dashboards: enable front-line staff to manage and control operational processes using detailed data that is refreshed frequently;
o Tactical dashboards: enables the monitoring of departmental processes and projects. These are mostly used to monitor and optimize processes;
o Strategic dashboards: used to monitor the execution of strategic objectives.
Whereas dashboards are typically associated with operational information (Eckerson, 2011; Cokins, 2009), scorecards as introduced in the Balanced
Scorecard (Kaplan & Norton, 1992) are more associated with tracking the
progress towards achieving goals and reviewing performance (Cokins, 2009). However, in the context of a PM system, Allio (2012) and Eckerson (2011), consider that the term used is not relevant as long as the system helps users and organizations to focus on what matters and therefore, mixing different types of dashboards and concepts is a valid approach to obtain the desired results, even though some contextual examination should be made in the selection of the best solution to adopt in each case (Lorence, 2010a; Cokins, 2009).
PM systems can be among the highest ROI solutions an organization can implement, because the benefits they bring allow the organization to unify all of its measures across systems and empower users to do tasks they couldn’t do otherwise (Dover, 2004). However, some authors like Pauwels et al. (2009) argue that there is no research that empirically demonstrates that dashboards improve profits or in the long-term, improve an organization’s performance. Despite this lack of evidence, more recent publications corroborate the advantages of using a PM system by studying practical implementations (A. de Waal & Kourtit, 2013).
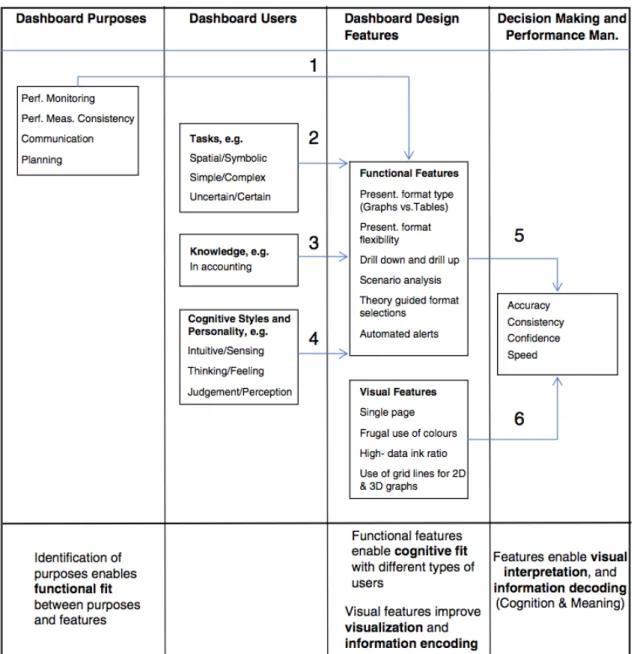
Implementing a PM system can have several obstacles like assuring data availability, accessibility and accuracy in a timely fashion (Lorence, 2010b). Another obstacle well referenced in the literature is the design itself. An extensive list of literature on this subject can be found in the article “A review of dashboards in performance management: implications for design and research” (Yigitbasioglu & Velcu, 2012). In this article, the authors summarized the research paths (see Figure 2.8) with implications for the dashboard design that should be followed to avoid problems in PM systems implementation.
Figure 2.8: Summary of dashboard research paths with implications for design
2.5. Data visualization
Another very important characteristic that cannot be overlooked is the visual presentation element (Eckerson, 2011; Caldeira, 2010; Few, 2006). This element should not be taken lightly as it can represent the difference between acceptance or not, of the dashboard by the users. This topic is so important that the previously cited authors have chapters in their books dedicated to it. Other authors have also written comprehensive documentation on the same topic and reinforced its importance and the details that should be applied to the metric’s
visual presentation (Hursman, 2013; Juice Analytics, 2009; Rasmussen, Chen, & Bansal, 2009).
To comply with this visual presentation characteristic, dashboards resort to the use of graphics and charts, however, as stressed by C. Chen, Härdle, & Unwin (2008) sometimes, graphics and charts can be a very effective way of information communication, but if not correctly used, they can also be very ineffective.
Graphical presentation of information started having more projection with the magnificent books of Edward Tufte (C. Chen et al., 2008). In his book “The visual display of quantitative information” (Tufte, 2007) the author makes the definition that “excellence in statistical graphics consists of complex ideas communicated with clarity, precision, and efficiency” and established a set of rules that graphics must comply with, to achieve this excellence.
2.6. Performance management in hospitality
In a literature review paper related to PM in the service sector, based on 141 peer-reviewed publications from 1981 to early 2008, developed by Yasin & Gomes (2010) the authors concluded that there was still the need for more theoretical and practical application work. From these 141 publications, only 7 were from a hospitality publication, which demonstrates the relative novelty of the subject. Additionally, in another literature review paper about the state of the art in hotel performance (Sainaghi, 2010), from the 152 publications analyzed by the author, only 14 were about Performance Measurement.
The small number of publications about real-world use of PM systems in the hospitality industry identified by Yasin & Gomes (2010) seems to continue, since only four articles covering the subject of PM/Performance Measurement were found during the research for this project. Even so, only one of these papers was recent and specific on the topic of PM (Y.-C. Chen, Wang, & Chu, 2011). The other papers were older and more related to the metrics used to measure hotel performance, under the topic of Performance Measurement (Cruz, 2007; Haktanir & Harris, 2005; Harris & Mongiello, 2001) rather than PM.
Except for two papers proposing specific frameworks for Performance
Measurement (Ivankovič, Janković, & Perišić, 2010; Phillips, 1999) that don’t
seem to be relevant for the scope of this work (lacking fundamental pieces -technology wise - or limited scope), no other literature on hospitality was found on PM frameworks specific to the industry.
Yet, in another literature review paper about the development of information and communication technologies in hospitality (Ip, Leung, & Law, 2011), the authors studied 88 publications from 1999 to 2008 and came to the conclusion that two topics where the subject of 46% of the publications, strategic and operational management and, RM, topics highly related to PM. These fields require systems that embrace BI and DA, which consequently can benefit from the implementation of PM systems.
Particularly, RM is a field where a PM system can have great impact. In other travel industries having a system to help automate RM is already considered a mission-critical component for success (Mehrotra & Ruttley, 2006). RM is of a multi-disciplinary nature (Serra, 2013). In its genesis is the need to analyze supply and demand, analyze historic data, analyze completion data, implement strategic and tactical restrictions by customer segments and distribution channels, identify booking-pace, length-of-stay, cancelation/no-show and rate patterns (Serra, 2013; Mehrotra & Ruttley, 2006), which are all data-centric tasks and processes that require inputs from multiple data sources (Serra, 2013) and the capabilities, techniques and technologies in the core of BI and DA.
The implementation of mathematical models in DA, the use of better forecasting models that can make use of all available data and new technologies (Chiang, Chen, & Xu, 2007) and the switching from intuition-based pricing decisions to analytics-based pricing (Garrow & Ferguson, 2008) are some of the referenced subjects in RM publications that could lead to effective revenue maximization. Consequently, as RM is having a more central and strategic role in hospitality, it will require better performance measurement techniques (Kimes, 2010).
Apart from RM, in other areas of the hospitality industry, BI as a tool of PM has been often cited as having an increasing importance. The use of data mining technology in Customer Relationship Management (CRM) (Danubianu & Hapenciuc, 2008), use of dashboards, real-time (or near) access to operational data, easier and faster identification of trends as well as highly visual data maps, loaded with analytics, filters and alerts (Korte, Ariyachandra, & Frolick, 2013) are topics that the most recent literature points out, towards the future of BI systems as a way to better align strategies to the organization’s objectives. The hospitality industry is becoming a leader in the use of BI, particularly, in the case of major hospitality organizations. They have greatly benefited from BI and IT, even though most of them still have much to gain from BI (Korte et al., 2013). This tendency can be observed in the latest issues of business publications, where hospitality industry professionals and consultants are increasingly addressing the need of the industry to embrace the use of all data at their disposal, dashboards and analytical tools, which are the foundations of BI and PM systems. A summarized list of these articles and papers is available in Appendix I.
Piccoli, Carroll, & Hall (2011) created a model to evaluate the electronic maturity of hospitality organizations and the level at which they have systematic and analytical processes implemented to take advantage of opportunities in demand generation, multi-channel distribution and revenue optimization. This model describes, at the upper stages (4 and 5), that organizations must have fully integrated systems, with analytical capabilities to achieve a continuous learning and improvement process of optimization, which emphasizes the need for hospitality organizations to have suitable PM systems.
At the time this research took place, no specific, self-proclaimed, out-of-the-box PM system was found on the market. However, there are some generic BI and dashboard systems and also some systems related to specific fields of the hospitality industry, mainly for RM, that incorporate a lot of the capabilities and techniques a BI/PM system should have and that can be used to implement a PM system. A list of some of these systems/applications and their main characteristics is presented in Appendix II.
Some authors (Yangyong & Yun, 2011; Conway, 2010) call this set of competencies/skills as “data science” and describe this mix as illustrated in Figure 2.9.
Figure 2.9: Data science Venn diagram
Source: Adapted from Conway (2010)
IT hacking skills
Mathematical
and statistics
knowledge
Substantive
expertise
Danger zone! Machine learning DATA SCIENCE3 METHODOLOGY 3.1 Problem identification and motivation
The literature review presented in the previous chapter reinforced the relevance of developing a PM system specific for the hospitality industry and its novelty. Moreover, as elaborated in point 2.6, whereas strategic and management decisions should shift from intuition-based to become analytics-based, the requirements for performance measurement techniques increases in the hospitality industry (Kimes, 2010). Also the need to automate mission-critical areas, like RM, because of its data-centric and multi-disciplinary nature (Serra, 2013) requires the capabilities, techniques and technologies in the core of PM, BI and DA.
Together with this need to make better, faster and information-based decisions, the acknowledged inexistence of an out-of-the-box PM system specific to the hospitality industry, is clearly a problem that can be addressed in the context of
Design Science Research (DSR), as it requires the development of an artifact,
in this case, a prototype of software system, fulfilling the two requirements of DSR: Relevance – by addressing a real business need and Rigor – by the need to apply the proper body of knowledge in the artifact development (Cleven, Gubler, & Hüner, 2009; Hevner, March, Park, & Ram, 2004).
A justification for the development of a specific system is also possible to infer, particularly because the market seems open to the use of such a product. This conclusion is based on a survey made in 2004 of 635 experts, consultants and BI industry analysts by The Data Warehousing Institute (TDWI), the world’s leading organization in business intelligence, data warehousing and analytics education and research4. The survey found that 59% of the organizations that had implemented PM systems have built their own, opposed to 30% of the organizations that have bought third party packages. The survey author