1877-Selec
A
Abst Curre adva produ satisf produ possi The p and i the i mana comp propo long © 20 Selec Keyw * C E-0428 © 2014 Th ction and peer-rev
Lean Si
a Faculda
tract
ent economic antage. For this ucts and/or serv faction. This ha uction processe ible and Six Sig present article p integrating an e
nvolved proces agement proces pany’s main pr osed model als run, the continu
014 The Author ction and peer-r
words: Lean Mana
Corresponding aut
E-mail address: ab
Proce
he Authors. Publis view under respon
ix Sigma
A
ade de Ciências e
b
UNIDEMI, Me
crisis raises th reason, more a vice characteris ave been attemp es in which, L gma on the cont
proposes a Lea enlarged and ad sses. The propo sses system are roject managem so permitted to uous improvem
rs. Published by review under re
agement, Six Sigm
thor. Tel.: +35121 [email protected]
dia - Social and B
shed by Elsevier nsibility of the IP
27
a (LSS)
Alexandra T
e Tecnologia (FC echanical and Ind
he constant dem and more comp stics, perfect the pted through Le Lean focus mai
trol and process an Six Sigma (L dapted set of st
osed model wa e based on Pro ment problems a systematically ment of the proje
y Elsevier Ltd. esponsibility of
ma tools, Lean Si
12948300; fax: +
Behavioral Scienc
Ltd. PMA.
7
thIPMA W
project m
Tenera
a,b* ,
CT), da Universida dustrial Engineeri
mand for prof panies search fo eir processes, d ean Managemen
nly on the was ses variability r LSS) project ma atistical tools, g as tested in a P oject Managem and associated address the ac ect managemen
f the IPMA.
ix Sigma, DMAIC
+351212948546.
ces 00 (2014) 000
World Congr
managem
, Luis Carn
dade Nova de Lisb ing Departament
fitable solution or management decrease costs, i nt and Six Sigm ste elimination reduction, using anagement imp given the natur Portuguese tele ment Institute (P
causes and the ctions and solut nt processes in t
C, Project Manag 0–000
ress
ment imp
neiro Pinto
boa (UNL), Capa t, Caparica, 2829
s that allow o methodologies improve the cap ma integrated ap n, using simple g statistical tool
rovement mode re of the project communication PMI) standards selection of th tions to be imp the organization
gement
www.elsevier.
proveme
oª
rica, 2829-516, P 9-516, Portugal
rganizations to s that allow the pital’s profitabil
pproaches in th and visual tec ls for this purpo el supported by t management m n company con s. The model a he causes to be plemented in or
n.
com/locate/proce
ent mode
Portugal
o gain competi em to improve t lity and costum heir managerial chniques when ose.
y the DMAIC c main variables ntext which pro allowed identify first attended. rder to keep, in
1.Introduction
Lean Six Sigma (LSS) has been seen as a business improvement methodology (Pamfilie, Petcu and Draghici, 2012) integrating two distinctive management philosophies: Lean and Six-sigma (Pepper and Spedding, 2010) complementing each other in order to improve enterprises processes and results. This integration has been achieved blending their methods and principles (George, 2003) using the DMAIC (define, measure, analyze, improve, control) cycle as the conjoint continuous improvement framework (Cheng and Chang, 2012) and conjointly making efforts to reduce production defects and process variability along with process simplification and standardization and waste reduction (Qu, Ma and Zhang, 2011).
Some attempts to enlarge the DMAIC cycle to project management practices and process improvement have already been proposed. For example Puga, Soler, Maximiano and Wagner (2005) argue that Six Sigma initiatives are projects carried out to create a single result, such as the project management, whereas there is a great potential for integration between the DMAIC and project management practices, in which DMAIC will focused on finding solutions to problems and opportunities based on data sustained decisions and project management standards will provide the formal procedure for the implementation of these solutions. Also for Rever (2010) the incorporation of DMAIC steps in each project should help project managers to become not only more effective but also to achieve innovative results, arguing that Six Sigma can be add to project management providing:
Suitable statistical process knowledge to better understand and improve future results; A set of solid step and tools for process improvement;
Variability knowledge in order to reduce instinctive reactions; Based decisions on facts and concrete quantitative analysis.
From the lean perspective Williams and Gerber (2009) argue that in project management there is usually bottlenecks and conflicts to be attended, making necessary powertrain an integration in project management. The author suggests an ID value stream map (VSM) corresponding to the project stream, identifying the existence of losses and trouble spots and the root causes of these problems. Once understood the current value stream map, a future value stream mapping can be designed, with the improvements already defined, being adjusted in real time to the project management.
Nevertheless the existing integration already proposed still little efforts have been developed to address the LSS–DMAIC based approach to the improvement of project management processes which should support continuous results and business process improvement.
2.A LSS model to project management improvement
According to the project management process nature, the main steps of each DMAIC phase are sequential and the determination of each step’s output is supported by specific tools and methods chosen according to the processes which are shown in figure 1.
The define phase is the beginning of a classical DMAIC approach, which defines the main problem detected, as well as the initial targets, based on knowledge and in organizational historical of the problem linked including the Customer view of it and also identifying the related main process team structure and project main charter to be implemented to resolve the identified problem. So, like in project management practices, which begin the project with the creation of the project charter, the final output in the first phase of a DMAIC Project is the Project Charter which contains all the information needed to the next phase, defining the Critical-to-Quality specifications (CTQs), the actual process mapping as well as the problem and goals description.
six sigma parametric tools must switch or integrate non-parametric descriptive and inference alternative approaches, like the one presented in figure 2. Analysis
Fig. 1. The Lean Six Sigma project management approach improvement main steps.
One of the most important steps of the LSS project aims to detect the Critical-to-Quality process factors (CTQs), considering the Customers opinion. In fact, the focus on the customers is a priority of the LSS philosophy. So, their opinions and needs must be reflected in the final product or service to be produced. In Project Management practices is usual to implement customer satisfaction surveys in the closing phase of every project managed. This common practice of Project Management can then be used to detect the main requirements of the Client, in order to detect the Voice of the Customer (VOC) on the DMAIC approach.
Another common survey tool option is the inclusion of free-response questions on costumers surveys which can be systematically and objectively analyzed with data/text mining approaches (see for example Witten, Frank & Hall, 2011) in order to discover what, from the client perspective, will be the main improvement variables to be proceed.
In the Process Mapping phase is necessary to focus on the process and their main stakeholders that will be later relevant to the improvement target that should be directly related to the identified CTQs. To get a better view, on a high level process understanding, the SIPOC (Supplier, Input, Process, Output and Customer) diagram can be very useful, for detailing the involved stakeholders as well as the main project activities to be addressed.
In the second phase, the Measure phase, as shown in figure 1, all steps are focused on measuring the process performance (sigma level), as well as updating consequently the goals which were defined in the phase before.
The third phase is particularly important and aims to analyses in detail the process, supported by a large group of tools and methods: Lean tools like i) Value Stream Mapping to obtain a closed looked of the improvement process opportunities and ii) Root cause identification and analysis, using Affinity diagrams which are important LSS available tools to support Ishikawa diagrams development.
The root-causes defined in the previous phase needs now to be treated. So, the Improve phase aims to identify potential solutions as well as doing their prioritization, by the use of six sigma tools such as: Prioritization Root-causes matrix (Pereira & Requeijo 2008) and Pugh matrix for root-Root-causes tiering.
In the last phase of the LSS proposed approached proceedings and control tools should be implemented in order to obtain systematical improvement results in a continuous base.
3.Testing the proposed LSS proposed model
To test the proposed LSS model an instrumental case study was developed in a private telecommunications Portuguese company with an approximately 65 million customers worldwide, covering several areas of activity, like fixed and mobile communication, multimedia data and business solutions (Pinto & Tenera, 2013). The company uses formal project management processes based on PMI (2008) standards. The research study was based on a project sample of data available on 33 different projects from different enterprise sectors, which were developed and concluded between 2006 and 2010. For the enterprise point of view the main study objective was to analyze and improve their current project management processes practices and results.
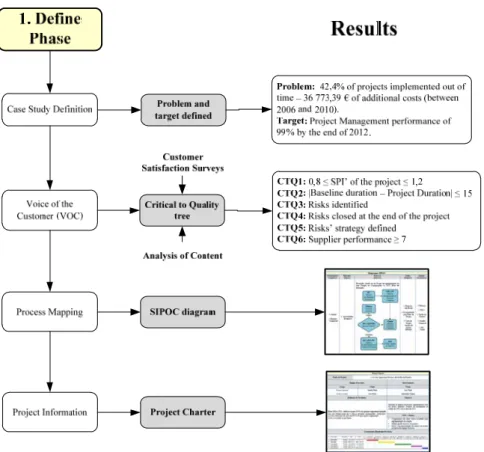
3.1.Define phase implementation
As exposed in figure 3, project performance classical indicators like, the difference between Project Duration and Baseline Duration, shown that in 42,4% (14 projects) of the projects, actual durations exceeded 15 days of the baseline durations, resulting in additional wasted costs of about 36 773,39 € which the organization would like to reduce and achieve a performance level of 99% on future project durations, to be developed inside of the enterprise defined deadlines set, meaning in less than 15 days of the project baseline duration.
The three different question groups of the survey used to detect the Voice of the Customer (VOC) costumer survey are shown in table 1, which also shows the respective analysis type, as well as the answers rating scale.
problems indicated by the customers namely ‘failure of the key-dates scheduled for the implementation’ and ‘risk management issues’.
Fig. 3. Case study main outputs and results: Define phase
Table 1. Customer Satisfaction Survey
Group Question Analysis Method Rating Scale Group1- Project Manager Performance Statistical Analysis 0 up to 10 Group2- Project Implementation evaluation Statistical Analysis 0 up to 10 Group3- Project Management Improving factors Content Analysis Free-responses
From the third group of the Customer Satisfaction Survey questionnaire a text mining approach to the open-response questions about the key project management factors to improve project results indicated that, from the client perspective, the major improvement would be on ‘a greater involvement and awareness of the deadlines and project goals by the technical teams”. From this VOC results the main critical quality factors of process (CTQs) were defined. The VOC factors were than deployed into requirements, which were then translated into CTQ specifications that can be measured (see table 2).
Table 2. Critical to Quality (CTQ) specifications
Project Duration Project Risk Management Technical Implementation
CTQ1: 0,8 ≤ SPI’ ≤1,2 CTQ3: Identified risks CTQ6: Suppliers’ evaluation ≥ 7 CTQ2:|Baseline duration – Project duration| ≤ 15 CTQ4: Closed risks in the end of the project
After the CTQs identification is now necessary to focus on the directly related processes that will be improved. This process comprises different stakeholders involved to the project management processes. In this case, because of the enterprise project management system based standards, the SIPOC (Supplier, Input, Process, Output, and Customer) diagram was developed considering the project cycle phases: initiation, planning, execution and also control and closing phase, detailing the key involved stakeholders as well as their main activities.
According to the findings, the LSS project team was then defined, as well as an initial planning, which describes the most important project details to pursue namely: i) the problem, ii) the target to achieve, iii) the VOC results, and iv) the project team and timings to be achieved.
3.2.Measure phase
Based on CTQs and data gathering a plan partially synthetized in table 3 was settled and the project sample sigma levels were calculated (see table 4) indicating that technical execution was the CTQ who presented the lowest sigma level followed by the project duration indicating that they would be the major variables to be improved.
Table 3. Data Collecting partial plan and Results
CTQs Metrics Sample
used
Measure Source
Process Phase
Defect Description
Defect results CTQ1 SPI’ value 33 Project Schedule Project Closing
Phase At least one requirement is not verified 16 CTQ2 |Baseline duration – Project
duration| ≤ 15
33 Project Schedule Project Closing Phase CTQ3 Number of identified risks 33 Project Plan Planning Phase
At least one requirement is not verified 2 CTQ4 Number of closed risks in the
end of the project
33 Sharepoint® Platform
Closing Phase
CTQ5 Number of risks with defined risk strategy
33 Project Plan Planning Phase CTQ6 Accomplish date from external
supplier (FSE) ≥ 7
21 Enterprise FSE’s surveys
Closing Phase When the requirement is not verified
8
According to the nature of each metric variable the minimum representative sample size (n) was controlled following classical six sigma equations (1) and (2) for continuous and discrete data, respectively (George, Rowlands, Price & Maxey, 2005) where α and σ represent the chosen significance level and the standard deviation of the metric respectively. For the discrete data p represent metrics proportion in concern.
z/2
n (1)
) 1 (
2 2
/ p p
z
n
(2)
6
10
NU NO
DR
DPMO (3)
(DPMO) ln
2,221 29,37 0,8406
level
Sigma (4)
Table 4. Evaluation of sample sigma levels CTQs
categories
Defect results (DR)
Number of opportunities (NO)
Number of Units (NU)
DPMO Sigma Level
Process performance
(%)
Project Duration 16 3 33 161616,16 2,49 83,84
Project Risk
Management 2 3 33 20202,02 3,55 97,98
Technical
Implementation 8 1 21 380952,38 1,75 61,90
3.3.Analyses phase
Based on the actual sigma level characterization results and on the defined organizational targets a more detailed process performance analysis were developed on the project duration variable behavior during the project development and implementation, which results are presented in table 5.
Table 5. Project cycle durations by main phases
Phase Sample Means
(days)
Sample Standard Deviation (days)
n tα/2, n-1 LI LS Outside LI-LS Post-adjudication phase:
Nomination of the project management (GPG)
195,95 285,92 21 2,086 65,80 326,10 2-6
Post-adjudication phase: Formal Contract signature (DPA)
76,11 116,54 9 2,306 - 13,50 165,70 1
Project Planning 81,10 282,90 17 2,120 -64,40 226,60 1
Project execution and closing 215,90 155,90 33 2,037 160,60 271,10 12-15
As exposed in table 5, because of the reduced sample size available, instead of the classical z-test, the t-test was used to establish what project phase had more project durations outside the duration confidence interval, characterized by a considered significance level (α), e.g. how many project in each phase were faster or exceed their expected statistical durations. The obtained results indicated that the project execution and closing phase was where many project didn’t reached the expected Lower Limit (LL) and also exceeded their Upper limit (UL), which causes should be address critically to reduce project duration variability and improve targeting durations.
between causes and the CTQs addressed using root-causes matrix evaluation with results were later prioritized by a Pareto analysis.
3.4.Improving and control phases
Because most of the technical work done was proven to be outsource supported, the identified solutions ranged from several project management areas mostly from: scope, communication, integration, schedule management and product and management project risks.
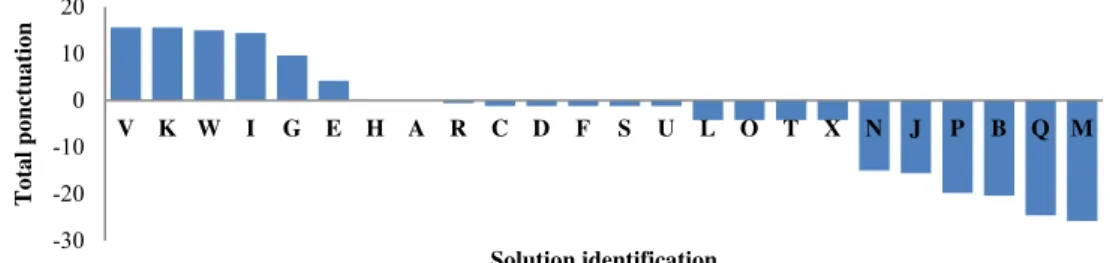
Based on the obtained results 24 improvement actions (from A to X) were identified that could be implemented, that were later tiered by a Pugh Matrix considering 4 main importance criteria: i) lower implementation cost; ii) implementation quickness iii) problem resolution impact level; iv) implementation risk, which results are summarized on figure 4.
Fig. 4. Tiering solutions: Pugh matrix results.
As presented in figure 4 and giving each improvement action cost solution, solutions within the most positive values were than proposed to be implemented. As a result of the last phase of the LSS proposed project management improvement approach, control and monitoring methods of the involved process considering the proposed solutions were suggested based mainly on internal audits, training actions, manuals updating and periodic measurement of the processes sigma levels.
4. Main conclusion
The present article presented a Lean Six Sigma (LSS) project management process improvement model and a case study test developed in a real enterprise environment which has a formal and established project management system PMI based. The LSS proposed approach is a DMAIC cycle-based proposal.
Given the nature of the project management available data, some classical six sigma tools have been tested and also adapted during the implementation of the DMAIC cycle-based proposal, including the integration of non-parametric tools on the classical statistical six sigma analyses and that new tools like text mining can be useful to support factual data treatment.
The study results shown that through the LSS proposed approach, processes improvement on project management stable practices can be reached through a continuous identification and evaluation of improvement opportunities in project management processes and decisions, enabling organizational results and process waste reduction.
The study also indicates that classical LSS tools can be used and adapted to formally and continuously improve project management processes and practices on organizations, if stable project management systems are in use.
-30 -20 -10 0 10 20
V K W I G E H A R C D F S U L O T X N J P B Q M
Total ponctuation
Acknowledgements
The authors gratefully acknowledge Portugal Telecom and Ministério da Ciência, Tecnologia e Ensino Superior, FCT, Portugal, under grants PEst-OEEME/UI0667/2011, for their support on this study.
References
Breyfogle III, F. (2003). Implementing Six Sigma: Smarter Solutions Using Statistical Methods (2nd ed.). New Jersey: John Wiley & Sons. Brook, Q. (2010). Lean six sigma and minitab: The complete toolbox guide for all lean six sigma practitioners (3rd ed.).
Hampshire: Opex Resources.
Cheng, C-Y & Chang, P-Y (2012). Implementation of the Lean Six Sigma framework in non-profit organizations: A case study. Total Quality Management & Business Excellence , 23, 431-447.
George, M. (2003). Lean Six Sigma for Services. New York: McGraw-Hill
George, M., Rowlands, D., Price, M., & Maxey, J. (2005). The Lean Six Sigma Pocket Toolbook: A Quick Reference Guide to 100 Tools for Improving Quality and Speed. New York: McGraw-Hill
Mehrjerdi, Y. (2011). Six-Sigma: methodology, tools and its future. Assembly Automation, 31, 79-88.
Pamfilie, R., Petcu, A. & Draghici, M. (2012). The importance of leadership in driving a strategic Lean Six Sigma management. 8th International Strategic Management Conference, Procedia Social and Behavioral Sciences, 58, 187-196.
Pepper, M., & Spedding, T. (2010). The evolution of lean Six Sigma. International Journal of Quality & Reliability Management, 27, 138-155. Pereira, Z., & Requeijo, J. (2008). Qualidade: Planeamento e Controlo Estatístico de Processos. Lisboa: Prefácio.
Pinto, L. Tenera A. (2013). The DMAIC cycle applied to project management. IRF’03- Integrity, Reliability and Failure International Conference- IRF’03, Madeira Portugal. Paper#4745.
PMI-Project Management Institute (2008). A Guide to the Project Management Body of Knowledge (4th ed.). Newtown Square: Project Management Institute Inc.
Puga, R., Soler, A., Maximiano, A., & Wagner, J. A. (2005). Gerenciamento de Projetos Seis Sigma. V Seminário Internacional de Gestão de Projetos PMI São Paulo: Brasil Chapter, 1-8. (available at http://pt.scribd.com/doc/4673068/Trabalho-Gerenciamento-de-Projetos-Seis-Sig-DOC-final)
Qu, L., Ma, M., & Zhang, G. (2011). Waste Analysis of Lean Service. International Conference on Management and Service Science (MASS 2011), 1-4.
Rever, H. (2010). Six Sigma Can Help Project Managers Improve Results. International Institute for Learning, Inc. 1-5. (retrieved at http://www.microsoft.com/project/en/gb/six-sigma.aspx)
Williams, H., & Gerber, J. (2009). IT Project Management: The Role of Lean. PMI Virtual Library, 1-4.(available at http://www.pmi.org/Knowledge-Center/Knowledge-Shelf/Information-Technology-Projects.aspx