1
Universidade Federal de Viçosa, Centro de Ciências Biológicas, Departamento de Nutrição e Saúde. Av. PH Rolfs, s/n., 36571-000, Viçosa, MG, Brasil. Correspondência para/Correspondence to: KJ SEGHETO. E-mail: <[email protected]>. 2
Universidade Federal do Oeste da Bahia, Centro das Ciências Biológicas e da Saúde, Curso de Graduação em Nutrição. Barreiras, Bahia, Brasil.
3
Escola Preparatória de Cadetes do Ar, Seção de Educação Física. Barbacena, MG, Brasil.
Support: Fundação de Amparo à Pesquisa do Minas Gerais (FAPEMIG) (Processo nºAPQ-00296-12). Conselho Nacional de Desenvolvimento Científi co e Tecnológico (Processo nº481418/2011-3).
Como citar este artigo/How to cite this article
Segheto KJ, Silva DCG, Ferreira FG, Carvalho MR, Longo GZ. Excessive abdominal adiposity and body fat are associated with lower serum vitamin D levels: A population-based study. Rev Nutr. 2018;31(6):523-33. http://dx.doi.org/10.1590/1678-98 652018000600002
Excessive abdominal adiposity and body
fat are associated with lower serum
vitamin D levels: A population-based study
Excesso de adiposidade abdominal e de gordura
corporal se associa à menor concentração sérica
de vitamina D
:
um estudo de base populacional
Kátia Josiany SEGHETO1 0000-0003-4605-0823
Danielle Cristina Guimarães da SILVA2 0000-0001-5456-0853 Fabrícia Geralda FERREIRA3 0000-0001-9836-4176
Mariana Rinaldi CARVALHO1 0000-0002-6409-2579 Giana Zarbato LONGO1 0000-0001-7666-5007
A B S T R A C T
Objective
To estimate the prevalence of 25-hydroxyvitamin D defi ciency and to analyze factors associated with lower serum vitamin levels in Brazilian adults.
Methods
Results
The prevalence of 25-hydroxyvitamin D deficiency was 14.4% and the prevalence was 42.0%. Excess abdominal fat was higher in subjects with 25-hydroxyvitamin D sufficiency. The serum level of 25-hydroxyvitamin D was 30.34±9.85ng/ml. Body adiposity was higher in men with vitamin insufficiency. Negative associations were observed between serum 25-hydroxyvitamin D levels and age, educational level, body adiposity (p=0.028) and abdominal adiposity (p=0.023).
Conclusion
Our results showed that excess body and abdominal adiposity are strong predictors of alterations in the serum vitamin D levels, thus public policies for prevention and treatment in this population are essential.
Keywords: Adiposity. Adult. Nutritional Epidemiology. Vitamin D.
R E S U M O
Objetivo
Estimar a prevalência de deficiência de 25 hidroxivitamina D e analisar fatores associados à menor concentração sérica da vitamina em adultos brasileiros.
Métodos
Estudo transversal, de base populacional, realizado com 626 indivíduos adultos, de ambos os sexos, residentes na área urbana do município de Viçosa, Minas Gerais. A variável dependente utilizada foi a concentração sérica de 25 hidroxivitamina D e as independentes foram variáveis sociodemográficas, antropométricas e de composição corporal. As associações entre as variáveis foram verificadas utilizando-se modelos de regressão linear simples e múltipla, considerando alfa menor que 0,05 para a entrada no modelo final.
Resultados
A prevalência de deficiência de 25 hidroxivitamina D foi de 14,4% e a insuficiência de 42,0%. O excesso de gordura abdominal foi maior em indivíduos com suficiência de 25 hidroxivitamina D. A concentração sérica de 25 hidroxivitamina D foi de 30,34±9,85 ng/ml. A adiposidade corporal foi maior em homens com insuficiência. Foram verificadas associações negativas entre a concentração sérica de 25 hidroxivitamina D e a idade, a escolaridade, a adiposidade corporal (p=0,028) e a adiposidade abdominal (p=0,023).
Conclusão
Nossos resultados mostraram que o excesso de adiposidade corporal e abdominal são fortes preditores de alterações na concentração sérica de vitamina D, por isso, é importante que condutas públicas de prevenção e tratamento sejam estabelecidas nesta população.
Palavras-chave: Adiposidade. Adultos. Epidemiologia nutricional. Vitamina D.
I N T R O D U C T I O N
It has long been believed that vitamin D played a role in bone mineral metabolism. Currently, it can be considered a steroid hormone that acts on metabolism and cell proliferation [1]. Vitamin D deficiency has also been associated with some diseases, including cardiovascular diseases [2], obesity and diabetes [3-6], which are related to low bone mass (osteopenia and osteoporosis) and related factors (bone fractures) [7].
Different factors, such as age, sex, ethnicity, diet and sun exposure, may promote changes in serum vitamin D levels [8], contributing individually or collectively to the deficiency of this nutrient. Thus, adequate attention should be given to each of these factors to promote appropriate interventions.
policies for several years [9,10]. Concomitantly, an increase in the prevalence of overweight/ obesity suggests that changes in 25(OH)D levels may be related to body fat. Many theories have emerged with the purpose of explaining such an association, but all of them require further investigation as there are still many controversies to be addressed.
In the literature, some studies have shown an inverse association between serum 25(OH)D levels and body composition [11,12], whereas there is also a report of non-association [13]. Thus, careful analysis of the methodological procedures used in the existing studies can help explain the different results, as well as the possible biases.
In the specific case of Brazil, although it is a tropical country with a year-round incidence of solar radiation, a significant prevalence of 25(OH)D deficiency has also observed [14,15]. Recent evidence confirms similar findings in other populations around the world [16,17] that rekindles the question of which factors could be associated with a lower serum 25(OH)D levels in the adult population.
The growing concern regarding the lack of vitamin D as a universal problem, which is often not recognized and adequately treated [18,19], had led to an increase in the literature addressing the issue over the last decade. However, in Brazil, population-based studies using the adult population that aim to show the relationship between vitamin D and excess weight are scarce, as well as studies that point out mechanisms that may best explain this association [20,21]. Given this shortcoming, our study aims to estimate the prevalence of 25(OH) D deficiency and analyze the factors associated with the low serum vitamin D levels in Brazilian adults.
M E T H O D S
Data from this cross-sectional population-based study were obtained from the Health and
Food Study (HFS) conducted between 2012 and
2014 in the city of Viçosa, Minas Gerais, Brazil.
The study population consisted of adults, aged 20-59 years, of both sexes, living in the urban area of the city. The sample calculation was determined by using the formula for prevalence estimates, considering the total number of individuals aged 20-59 years living in the urban
area of Viçosa (43,431 people) [22], estimated
prevalence of 77.4% [21], 95.0% confidence level, sample error of 5.0%, and estimated deff (design effect, cluster sampling) of 1.9. There was an increase of 10.0% for losses and refusals and 10.0% for controlling for confounding factors [23]. With the aid of public domain program Epi Info, version 3.5.2 (Centers for Disease Control and Prevention, Atlanta, Georgia, United States) [24], calculations indicated a minimum sample size (n) of 617 participants.
Data collection occurred between 2012-2014 and a double-stage cluster sampling was carried out. The first step of the research established the census area and the second step determined the households. The research consisted of the following steps: household visits to apply a structured questionnaire, laboratory blood collection carried out by a trained professional nurse, and assessment of anthropometric measures [23].
The following individuals were excluded from the study: pregnant women, postpartum women, bedridden individuals or those whose measurements could not be obtained, individuals with cognitive/intellectual difficulties, and those who had difficulty answering the questionnaire.
The dependent variable was the serum 25(OH)D level (ng/ml), which was evaluated by chemiluminescence [25] using the Architect
25(OH)D kit and Architect/Abbott (São Paulo,
Brazil) equipment. Blood samples were collected using a vacuum-assisted blood collection system and disposable material after 12 hours of fasting. The status of 25(OH)D was determined according to the following reference values:
29.9ng/ml) and deficient (≤20.9ng/ml) [14,26]. The season of the year when blood collection was performed was also evaluated and categorized as: winter, autumn, spring and summer.
The sociodemographic variables were as follows: sex (categorized as men and women), age (completed years and classified in ten-year periods [20 to 29, 30 to 39, 40 to 49 and 50 to 59 years]), educational level (full years of
schooling, classified as 0-4, 5-8, 9-11 and ≥12
years of study), and marital status classified as unmarried (single/divorced/separated/widowed) or with a partner (married/with a partner).
The excess of abdominal adiposity was evaluated by measuring the abdominal circumference using an inelastic 2-meter
measuring tape (Sanny®, São Paulo, Brazil).
The measurement was performed at the midpoint between the iliac crest and the last rib. Measurements were performed in triplicate by a single examiner and the measurement means were used in the analyses. The cut-off point used to determine the prevalence of excess abdominal adiposity was based on abdominal circumference (AC) according to the following
reference values: men CA≥90cm and women
CA≥80cm [27].
Body fat mass was determined using bioimpedance (A-310, Biodynamics Corporation, Shoreline, Washington, United States). To carry out the examination, all the participants of the study were instructed to follow these procedures: fast before examination; no consumption of alcoholic beverages or practice of vigorous exercises 24 hours prior to the examination; urinate at least 30 minutes before the test [28]. The measurements were performed with the individual in the supine position, wearing light clothing and free of any metal objects. Four electrodes were placed on the right side, two on the hands and two on the feet. Excess body fat mass was established in accordance with
Lohman’s proposal for adult individuals [29].
Descriptive analysis of variables was
analyzed by means of relative frequency. Student’s
t-test and one-way Analysis of Variance
(ANOVA) were used to analyze the difference between the mean 25(OH)D levels (ng/ml) and sociodemographic variables. Linear regression models were used to verify the association between the independent variables and serum 25(OH)D levels. The variables that presented
p<0.20 in the bivariate analysis were included in
the multiple model and only variables at p<0.05
remained in the model. The Stata software (Stata Corportation, College Station, Texas, United States) program, version 13.1, was used.
The study was approved by the Research
Ethics Committee of the Universidade Federal de
Viçosa (UVF, Federal University of Viçosa) under report No 008/2012/CEPH. The interviewers read consent term to the interviewees who consented to participate in the study.
R E S U L T S
Of the 626 participants in the survey, most were women (56.21%), 39.23% of those surveyed were between the ages of 20-29 years, 52.07% reported more than twelve years of schooling, and most self-reported being non-white (58.70%). As for the nutritional status, 55.92% presented excess abdominal fat and 43.43% presented excess body fat (Table 1).
Vitamin D (25(OH)D) deficiency (<20ng/ ml) was present in 14.4% of the participants and 42.0% of adults had 25(OH)D insufficiency (20-29ng/ml). Excess abdominal fat was higher in participants with 25(OH)D sufficiency (Figura 1). Body fat was higher in men with vitamin D insufficiency (Figure 2).
Mean serum 25(OH)D level was 30.34ng/ ml and standard deviation was 9.85ng/ml, which
were higher in males (p<0.001), among younger
individuals (p=0.002), individuals who reported
higher schooling (p=0.016), individuals whose
Table 1. Sociodemographic and anthropometric characteristics of adults (N=626). Health and Food Study (HFS). Viçosa (MG), Brazil, 2012-2014.
Variables Frequency (%)
Sex
Men 43.79
Women 56.21
Age (years)
20–29 39.23
30–39 22.68
40–49 17.69
50–59 20.40
Educational level (years)
0–4 9.70
5–8 15.98
9–11 22.25
≥12 52.07
Skin color
White 41.30
Non-white 58.70
Excess abdominal adiposity
No 44.08
Yes 55.92
Excess body fat
No 56.57
Yes 43.43
Figure 1. Mean values of abdominal adiposity and vitamin D status according to sex in adults. Health and Food Study (HFS). Viçosa
(MG), Brazil, 2012-2014.
100
90
80
70
60
50
40
30
20
10
0
Abdominal Adiposity (cm)
(%)
Figure 2. Mean values of body adiposity and Vitamin D status according to sex in adults. Health and Food Study (HFS). Viçosa (MG), Brazil, 2012-2014.
40
35
30
25
20
15
10
5
0
Men Women
Body Adiposity (%)
and in adults without excess abdominal or body
adiposity (p<0.001) (Table 2).
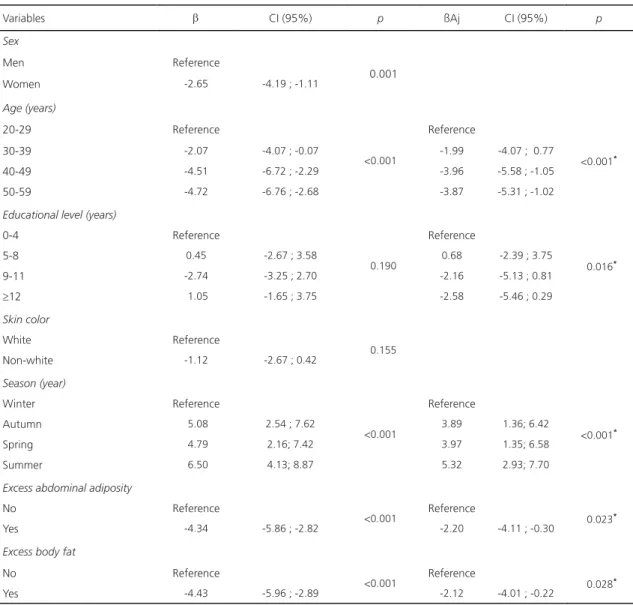
Table 3 shows the association between explanatory variables and serum 25(OH)D levels. Negative associations were found between serum 25(OH)D level and age, showing that the older the age group, the lower the serum vitamin
D level (p<0.001). Increased years of schooling
also showed an inverse association with 25(OH) D level. As for the season of the year when blood was collected, this variable was positively associated with the increase in the serum vitamin level. We found that the serum 25(OH) D level was higher in individuals whose blood was collected in the summer than in individuals whose blood was collected in other seasons of the year. The serum 25(OH)D level was inversely
associated with excess body adiposity (p=0.028)
and excess abdominal adiposity (p=0.023).
D I S C U S S I O N
In our cross-sectional study with Brazilian adults, 25(OH)D insufficiency was high as it was present in 42% of the participants. According to Holick [30] and James [31], vitamin D deficiency is a public health problem in many
countries, affecting approximately 1 billion people worldwide. In several regions of Brazil there is a high prevalence of vitamin deficiency in different age groups and both sexes [32]; however, we do not yet have a national study that describes the real scenario. In addition, the mean serum 25(OH)D level was higher among men, younger individuals who reported a higher educational level, and among individuals with a higher socioeconomic status.
Several risk factors are associated with hypovitaminosis D in developing countries such as Brazil [30]. Among these factors, women have been described in epidemiological studies. Recent research has also shown that both intake and vitamin D synthesis are greater in men than in women [33-35]. In addition, women spend less time exposed to the sun, practice less physical activity and have greater body adiposity.
Hypovitaminosis D is also observed in older individuals; thus, younger individuals have
higher 25(OH)D levels. A study conducted in São
Paulo with 591 volunteers of both sexes showed
that the younger the research participant, the higher the serum vitamin D level [36]. Unger
et al. [37] identified this same association in
Table 2. Mean vitamin D levels (ng/ml) and sociodemographic and anthropometric variables (N=626). Health and Food Study (HFS). Viçosa (MG), Brazil, 2012-2014.
Variables
Mean 25(OH)D levels (ng/ml)
p
Mean ± SD
Sex
Men 31.71 ± 9.75
<0.001*
Women 29.14 ± 9.70
Age (years)
20-29 32.56 ± 10.50
<0.001*
30-39 30.48 ± 10.00
40-49 27.90 ± 9.00
50-59 27.90 ± 7.80
Educational level (years)
0-4 29.78 ± 9.40
0.637
5-8 30.24 ± 9.60
9-12 29.51 ± 8.30
≥13 30.72 ± 10.50
Skin color
White 30.96 ± 9.67
0.155
Non-white 29.83 ± 9.88
Season
Winter 25.39 ± 7.40
<0.001*
Autumn 30.48 ± 9.50
Spring 30.18 ± 10.50
Summer 31.89 ± 10.00
Excess abdominal adiposity
No 32.62 ± 10.81
<0.001*
Yes 28.35 ± 8.45
Excess body fat
No 32.22 ± 10.26
<0.001*
Yes 27.95 ± 8.54
Note: *p<0.05.
25(OH)D: 25-Hydroxyvitamin D; SD: Standard Deviation.
of a Brazilian capital. The possible explanation for these results may be the pattern of different vitamin D intake according to the age groups [38] as well as non-supplementation or food fortification that are necessary for older individuals. In addition to this association, we can infer that older individuals spend less time exposed to the sun, which consequently leads to vitamin D deficiency, since sun exposure is the essential for vitamin D synthesis [35].
Lower educational levels may also be associated with hypovitaminosis D, which may be related to the poor access to information and good health behaviors, such as sun exposure and nutrition. These results corroborate a study by
Daly et al. [39] who identified that a higher level
Table 3. Univariate and multivariate analysis of factors associated with serum vitamin D levels (ng/ml) in adults. Health and Food Study (HFS). Viçosa (MG), Brazil, 2012-2014.
Variables b CI (95%) p ßAj CI (95%) p
Sex
Men Reference
0.001
Women -2.65 -4.19 ; -1.11
Age (years)
20-29 Reference
<0.001
Reference
<0.001*
30-39 -2.07 -4.07 ; -0.07 -1.99 -4.07 ; 0.77
40-49 -4.51 -6.72 ; -2.29 -3.96 -5.58 ; -1.05
50-59 -4.72 -6.76 ; -2.68 -3.87 -5.31 ; -1.02
Educational level (years)
0-4 Reference
0.190
Reference
0.016*
5-8 0.45 -2.67 ; 3.58 0.68 -2.39 ; 3.75
9-11 -2.74 -3.25 ; 2.70 -2.16 -5.13 ; 0.81
≥12 1.05 -1.65 ; 3.75 -2.58 -5.46 ; 0.29
Skin color
White Reference
0.155
Non-white -1.12 -2.67 ; 0.42
Season (year)
Winter Reference
<0.001
Reference
<0.001*
Autumn 5.08 2.54 ; 7.62 3.89 1.36; 6.42
Spring 4.79 2.16; 7.42 3.97 1.35; 6.58
Summer 6.50 4.13; 8.87 5.32 2.93; 7.70
Excess abdominal adiposity
No Reference
<0.001 Reference 0.023*
Yes -4.34 -5.86 ; -2.82 -2.20 -4.11 ; -0.30
Excess body fat
No Reference
<0.001 Reference 0.028*
Yes -4.43 -5.96 ; -2.89 -2.12 -4.01 ; -0.22 Note: *p-value: Multiple linear regression at a significance of p<0.05.
CI(95%): 95% Confidence Interval; ß: value of ß for simple linear regression; ßAj: value of ß Adjusted to covariables. Adjusted variables for final model: age; educational level; season; excess abdominal adiposity; excess body fat.
Regarding serum vitamin D levels, according to the season the blood samples were collected, we found that individuals whose blood was collected in the summer presented higher vitamin D levels when compared with the individuals whose blood was collected in other
seasons of the year. According to Webb et al.
[40], solar radiation reaching the Earth, especially the UVB spectrum, significantly influences cutaneous vitamin D synthesis, so vitamin D synthesis is affected during the seasons of the
year when sunlight exposure is lower, which leads to hypovitaminosis.
body fat through reactions that inhibit lipolysis and stimulate lipogenesis [41,42]. According
to Wortsman et al. [43] and Silva et al. [44],
evidence has suggested that the presence of receptors in adipose tissues results in vitamin D retention in adipocytes and thus the vitamin
bioavailability in the tissues is reduced. Khan et
al. [45] investigated the association between
serum vitamin D level and adiposity in 3020 adult Afro-American subjects and suggests that Vitamin D Receptor (VDR) polymorphisms increase susceptibility to excess body and abdominal adiposity. In addition, hypovitaminosis D in obese individuals may be related to less physical activity in open-air settings and, consequently, these individuals spend less time exposed to the sun [46].
Although this is a cross-sectional study and since these associations cannot be interpreted as a causal relationship, the results may contribute to a better understanding of vitamin D metabolism in adults. In addition, the limitation of the study was that factors related to sun exposure, such as professional activity, and use of sunscreen were not investigated. The positive factor is that it is a population-based study that associates vitamin D with sociodemographic, anthropometric and body composition factors.
C O N C L U S I O N
Our results suggest that excess body and abdominal adiposity are strong predictors of changes in serum vitamin D levels; thus, public policies for prevention and treatment are essential. In addition, large clinical studies should be conducted to determine the major risk factors for hypovitaminosis D.
C O N T R I B U T O R S
KJ SEGHETO, DCG SILVA, FG FERREIRA and GZ LONGO collaborated with design, analysis and interpretation of data, revision and approval of the
final version of the manuscript. MR CARVALHO contributed with revision and approval of the final version of the manuscript.
A C K N O W L E G E M E N T S
The authors thank all the volunteers of the study and funding agencies: Conselho Nacional de Desenvolvimento Científico e Tecnológico (CNPq),
Fundação de Amparo à Pesquisa no Estado de Minas
(FAPEMIG), Laboratório da Universidade Federal de Viçosa (MG) e a Bioclin/Quibasa.
R E F E R E N C E S
1. Ramagopalan SV, Heger A, Berlanga AJ, Maugeri NJ, Lincoln MR, Burrell A, et al. A ChIP-seq defined genome-wide map of vitamin D receptor binding: Associations with disease and evolution. Genome Res. 2010;20(10):1352-60. http://dx.doi.org/10.11 01/gr.107920.110
2. Zhang R, Li B, Gao X, Tian R, Pan Y, Jiang J, et al. Serum 25-hydroxyvitamin D and the risk of cardiovascular disease: Dose-response meta-analysis of prospective studies. Am J Clin Nutr. 2017;105(4):810-9. http://dx.doi.org/10.3945/ajcn. 116.140392
3. Goldner WS, Stoner JA, Thompson J, Taylor K, Larson L, Erickson J, et al. Prevalence of vitamin D insufficiency and deficiency in morbidly obese patients: A comparison with non-obese controls. Obes Surg. 2008;18(2):145-50. http://dx.doi.org/10. 1007/s11695-007-9315-8
4. Rodriguez-Rodriguez E, Navia B, Lopez-Sobaler AM, Ortega RM. Vitamin D in overweight/ obese women and its relationship with dietetic and anthropometric variables. Obesity. 2009; 17(4):778-82. http://dx.doi.org/10.1038/oby.2008. 649
5. Tsur A, Feldman BS, Feldhammer I, Hoshen MB, Leibowitz G, Balicer RD. Decreased serum concentrations of 25-hydroxycholecalciferol are associated with increased risk of progression to impaired fasting glucose and diabetes. Diabetes Care. 2013; 36(5):1361-7. http://dx.doi. org/10.2337/dc12-1050
7. Labronici PJ, Blunck SS, Lana FR, Esteves BB, Franco JS, Fukuyama JM, et al. Vitamin D and its relation to bone mineral density in postmenopause women. Rev Bras Ortop. 2013;48(3):228-35. http://dx.doi.org/10.1016/j.rbo.2012.07.004 8. Nurbazlin M, Chee WS, Rokiah P, Tan AT, Chew
YY, Nusaibah AR, et al. Effects of sun exposure on 25(OH) vitamin D concentration in urban and rural women in Malaysia. Asia Pac J Clin Nutr. 2013;22(3):391-9. http://dx.doi.org/10.6133/apjcn. 2013.22.3.15.
9. Bandeira F, Griz L, Dreyer P, Eufrazino C, Bandeira C, Freese E. Vitamin D deficiency: A global perspective. Arq Bras Endocrinol Metabol. 2006;50(4):640-6. http://dx.doi.org/10.1590/S000 4-27302006000400009
10. Holick MF. The D-lightful vitamin D for health. J Med Biochem. 2013;32:1-10. http://dx.doi.org/10. 1177/0148607111430189
11. Ceglia L, Nelson J, Ware J, Alysandratos KD, Bray GA, Garganta C, et al. Association between body weight and composition and plasma 25-hydroxyvitamin D level in the diabetes prevention program. Eur J Nutr. 2017;56(1):161-70. http://dx.doi.org/10.1007/s00394-015-1066-z 12. Han SS, Kim M, Lee SM, Lee JP, Kim S, Joo KW,
et al. Association between body fat and vitamin D status in Korean adults. Asia Pac J Clin Nutr. 2014;23(1):65-75. http://dx.doi.org/10.6133/apjcn. 2014.23.1.10
13. McGill A, Stewart JM, Lithander FE, Strik CM, Poppitt SD. Relationships of low serum vitamin D3 with anthropometry and markers of the metabolic syndrome and diabetes in overweight and obesity. Nutr J. 2008;7(28):4. http://dx.doi.org/10. 1186/1475-2891-7-4
14. Rocha LM, Baldan DCS, Souza AL, Chaim EA, Pavim EJ, Alegre SM. Body composition and metabolic profile in adults with vitamin D deficiency. Rev Nutr. 2017;30(4):419-30. http://dx.doi. org/10.1590/1678-98652017000400002 15. Martini LA, Verly Jr E, Marchioni DM, Fisberg RM.
Prevalence and correlates of calcium and vitamin D status adequacy in adolescents, adults, and elderly from the Health Survey - São Paulo. Nutrition. 2013;29(6):845-50. http://dx.doi.org/10.1016/j.nut. 2012.12.009
16. Wood RJ. Vitamin D and adipogenesis: New molecular insights. Rev Nutr. 2008;66(1):40-6. http:// dx.doi.org/10.1111/j.1753-4887.2007.00004.x 17. Abboud M, Gordon-Thomson C, Hoy AJ,
Balaban S, Rybchyn MS, Cole l, et al. Uptake of 25-hydroxyvitamin D by muscle and fat cells. J Steroid Biochem Mol Biol. 2014;144:232-6. http://dx.doi.org/10.1016/j.jsbmb.2013.10.020
18. Papandreou D, Hamid Z. The role of vitamin D in diabetes and cardiovascular disease: An updated review of the literature. Dis Markers. 2015;2015:580474. http://dx.doi.org/10.1155/20 15/580474
19. Mozos I, Marginean O. Links between vitamin D deficiency and cardiovascular diseases. Bio Med Res Inter. 2015;2015:109275. http://dx.doi.org/10. 1155/2015/109275
20. Lopes VM, Lopes JR, Brasileiro JP, Oliveira I, Lacerda RP, Andrade MR, et al. Highly prevalence of vitamin D deficiency among Brazilian women of reproductive age. Arch Endocrinol Metab. 2017;61(1):21-7. http://dx.doi.org/10.1590/2359-3 997000000216
21. Pereira-Santos M, Santos JYGD, Carvalho GQ, Santos DBD, Oliveira AM. Epidemiology of vitamin D insufficiency and deficiency in a population in a sunny country: Geospatial meta-analysis in Brazil. Crit Rev Food Sci Nutr. 2018;8:1-8. http://dx.doi. org/10.1080/10408398.2018.1437711
22. Instituto Brasileiro de Geografia e Estatística. Cen-so Demográfico, 2010 [acesCen-so 2012 mar 10]. Rio de Janeiro: IBGE; 2010. Disponível em: https:// www.ibge.gov.br/
23. Segheto W, Silva DCG, Coelho FA, Reis VG, Morais SHO, Marins JCB. Body adiposity index and associated factors in adults: Method and logistics of a population-based study. Nutr Hosp. 2015;32(1):101-9. http://dx.doi.org/10.3305/ nh.2015. 32.1.8391
24. Dean AG, Dean JA, Colombier D, Brendel KA, Smith DC, Burton AH, et al. Epi Info, version 6: a word processing, database, and statistics for epidemiology on microcomputers. Atlanta: Centers for Disease Control and Prevention; 1994. 25. Alves M, Bastos M, Leitão F, Marques G, Ribeiro
G, Carrilho F. Vitamin D: Importance of laboratory evaluation. Rev Port Endocrinol Diabetes Metabol. 2013;8(1):32-9. http://dx.doi.org/10.1016/j.rpedm. 2012.12.001
26. Holick MF, Binkley NC, Bischoff-Ferrari HA, Gordon CM, Hanley DA, Heaney RP, et al. Evaluation, treatment, and prevention of vitamin D deficiency: An endocrine society clinical practice guideline. J Clin Endocrinol Metab. 2011;96(7):1911-30. http://dx.doi.org/10.1210/jc.2011-0385
Association for the Study of Obesity. Circulation. 2009;120(16):1640-5. http://dx.doi.org/10.1161/ CIRCULATIONAHA.109.192644
28. Earthman C, Traughber D, Dobratz J, Howell W. Bioimpedance spectroscopy for clinical assessment of fluid distribution and body cell mass. Nutr Clin Pract. 2007;22(4):389-405. http://dx.doi.org/10. 1177/0115426507022004389
29. Lohman TG. Advances in body composition assessment. Champaign: Human Kinetics Publishers; 1992.
30. Holick MF. Vitamin D deficiency. N Engl J Med. 2007;357(3):266-81. http://dx.doi.org/10.1056/NEJ Mra070553
31. James WPT. 22nd Marabou Symposium: the changing faces of vitamin D. Nutr Rev. 2008;66(5):286-90. http://dx.doi.org/10.1111/j.175 3-4887.2008.00116.x
32. Arabi A, El Rassi R, El-Hajj Fuleihan G. Hypovitaminosis D in developing countries-prevalence, risk factors and outcomes. Nat Rev Endocrinol. 2010;6(10):550-61. http://dx.doi.org/10.1038/nrendo.2010.146 33. Touvier M, Deschasaux M, Montourcy M, Sutton A,
Charnaux N, Kesse-Guyot E, et al. Determinants of vitamin D status in Caucasian adults: Influence of sun exposure, dietary intake, sociodemographic, lifestyle, anthropometric, and genetic factors. J Invest Dermatol. 2015;135(2):378-88. http://dx. doi.org/10.1038/jid.2014.400
34. Moore CE, Radcliffe JD, Liu Y. Vitamin D intakes of children differ by race/ethnicity, sex, age, and income in the United States, 2007 to 2010. Nutr Res. 2014;34(6):499-506. http://dx.doi.org/10.10 16/j.nutres.2014.06.002
35. Mithal A, Wahl DA, Bonjour JP, Burckhardt P, Dawson-Hughes B, Eisman JA, et al. Global vitamin D status and determinants of hypovitaminosis D. Osteoporos Int. 2009;20(11):1807-20. http://dx. doi.org/10.1007/s00198-009-0954-6
36. Maeda SS, Kunii IS, Hayashi L, Lazaretti-Castro M. The effect of sun exposure on 25-hydroxyvitamin D concentrations in young healthy subjects living in the city of São Paulo, Brazil. Braz J Med Biol Res. 2007;40(12):1653-9. http://dx.doi.org/1590/ S0100-879X2006005000162
37. Unger MD, Cuppari L, Titan SM, Magalhães MC, Sassaki AL, Reis LM, et al. Vitamin D status in a sunny country: Where has the sun gone? Clin Nutr. 2010;29(6):784-8. http://dx.doi.org/10.1016/j.clnu. 2010.06.009
38. Barja-Fernández S, Concepción AM, Martínez-Silva I, Vazquez R, Gil-Campos M, Olza J, et
al. 25-Hydroxyvitamin D levels of children are inversely related to adiposity assessed by body mass index. J Physiol Biochem. 2017;74(1):111-18. http://dx.doi.org/10.1007/s13105-017-0581-1 39. Daly RM, Gagnon C, Lu ZX, Magliano DJ, Dunstan
DW, Sikaris KA, et al. Prevalence of vitamin D deficiency and its determinants in Australian adults aged 25 years and older: A national, population-based study. Clin Endocrinol. 2012;77(1):26-35. http://dx.doi.org/10.1111/j.1365-2265.2011.043 20.x
40. Webb AR, Kline L, Holick MF. Influence of season and latitude on the cutaneous synthesis of vitamin D3: Exposure to winter sunlight in Boston and Edmonton will not promote vitamin D3 synthesis in human skin. J Clin Endocrinol Metab. 1988;67(2):373-8. http://dx.doi.org/10.1210/jcem-67-2-373
41. Schuch NJ, Garcia VC. Vitamin D and endocrine diseases. Arq Bras Endocrinol Metab. 2009;53(5):625-33. http://dx.doi.org/10.1590/S000 4-27302009000500015
42. Leão ALM, Santos LC. Micronutrient consumption and overweight: Is there a relationship? Rev Bras Epidemiol. 2012;15(1):85-95. http://dx.doi. org/10.1590/S1415-790X2012000100008 43. Wortsman J, Matsuoka LY, Chen TC, Lu Z, Holick
MF. Decreased bioavailability of vitamin D in obesity. Am J Clin Nutr. 2000;72(3):690-3. http:// dx.doi.org/10.1093/ajcn/72.3.690
44. Souza Silva J, Pereira SE, Saboya Sobrinho CJ, Ramalho A. Obesity, related diseases and their relationship with vitamin D deficiency in adolescents. Nutr Hosp. 2016;33(4):856-64. http:// dx.doi.org/10.1093/ajcn/72.3.690
45. Khan RJ, Riestra P, Gebreab SY, Wilson JG, Gaye A, Xu R, et al. Vitamin D receptor gene polymorphisms are associated with abdominal visceral adipose tissue volume and serum adipokine concentrations but not with body mass index or waist circumference in African Americans: The Jackson Heart Study. J Nutr. 2016;146(8):1476-82. http://dx.doi.org/10.3945/jn.116.229963 46. Vimaleswaran KS, Berry DJ, Lu C, Tikkanen E, Pilz
S, Hiraki LT, et al. Causal relationship between obesity and vitamin D status: Bi-directional Mendelian randomization analysis of multiple cohorts. PLos Med. 2013;10(2):e1001383. http:// dx.doi.org/10.1371/journal.pmed.1001383