ESTs and putative line-specific (broiler and layer) SNPs identified in genes
expressed in
Gallus gallus
pituitary and hypothalamus
Clarissa Sanches da Silva Cassoli
1, Erika Cirstina Jorge
1, Mateus Patrício
1, Helena Javiel Alves
1,
Erik Amazonas de Almeida
1, Mônica Corrêa Ledur
2and Luiz Lehmann Coutinho
11
Laboratório de Biotecnologia Animal, Departamento de Zootecnia,
Escola Superior de Agricultura “Luiz de Queiroz”, Universidade de São Paulo, Piracicaba, SP, Brazil.
2EMBRAPA Suínos e Aves, Concórdia, SC, Brazil.
Abstract
Brazilian poultry industry has reached a high level of development in both meat and egg production as a result of con-stant technological modernization. Further improvements can be achieved through genomics, but before this can be accomplished, a better understanding of gene expression profiles and nucleotide polymorphisms is necessary. Since animal physiology is directly or indirectly controlled by the pituitary and hypothalamus, the aim of the present work was to identify and analyze genes expressed in these tissues in chicken lines with different growth potential. Two pituitary and hypothalamus cDNA libraries from 21 day broiler (TT) and layer (CC) chickens lines were con-structed and allowed identification of 3,074 unique sequences and 77 single nucleotide polymorphisms (SNPs). The collection of expressed sequence tags (ESTs) and SNPs identified in this study represents an important resource for future studies aimed at identifying genes responsible for growth in chicken.
Key words:pituitary, hypothalamus, EST, SNP, chicken. Received: February 1, 2007; Accepted: November 20, 2007.
Introduction
Over the last decades, the poultry industry has experi-enced a substantial increase in production efficiency. For example, there has been a threefold increase in egg produc-tion per chicken/year and a substantial decrease in the time necessary for broilers to reach 1.5 kg of live weight (Burt, 2002). Classic selection greatly contributed to this prog-ress, since selected broiler lines grow 3 to 4 times more rap-idly than their non-selected ancestor, red jungle fowl (Bulfield, 2004). Nevertheless, several phenotypic traits are difficult to improve through traditional breeding, such as those that are difficult or expensive to measure (carcass quality and composition, behavior and welfare) or have low heritability (reproduction and fitness) (Bulfield, 2004). In addition, unwanted characteristics can be indirectly se-lected with classic breeding (Burt, 2002). Modern genomic technologies can greatly impact selection of these difficult to target traits (Bulfield, 2004).
Important aspects of animal physiology are directly or indirectly controlled by the pituitary and hypothalamus,
but the genetic mechanisms controlling processes such as metabolism, somatic growth and reproduction in chickens still remain largely unknown (Cogburnet al., 2003). There-fore, identification and study of genes expressed in the pituitary and hypothalamus can fill existing gaps in under-standing the molecular pathways involved in several physi-ological processes, as well as provide tools for future ani-mal breeding programs.
Among the methodologies available for gene identifi-cation, analysis of expressed sequence tags (ESTs) has proven to be very efficient. This methodology consists in partially sequencing the extremities of clones obtained from cDNA libraries and establishing groups of specifi-cally expressed genes, as well as their transcription levels in determined tissue or cell types (Adamset al., 1991). This approach allows comparisons to be made between different tissues or species, and the identification of polymorphisms in intragenic regions (Adams et al., 1991; Hatey et al., 1998). Single nucleotide polymorphisms (SNPs) have emerged as a principal DNA marker class which greatly helps in developing high-density genetic maps for use in QTL identification through linkage disequilibrium analysis (Smithet al., 2002).
In previous studies, ESTs were generated from skele-tal muscle precursor tissues (somites and neural tube), www.sbg.org.br
limbs and whole embryos (Jorgeet al., 2004), and from young fowl pectoral musculature (unpublished results). The present work was developed with the scope of cata-loguing genes expressed in chicken hypothalamus and pitu-itary gland and identifying distinct features possibly associ-ated with growth.
Material and Methods
A total of about 120 eggs from broiler (TT) and layer (CC) lines supplied by Embrapa Swine and Poultry National Research Center were incubated at 37 °C in a hu-midity-controlled atmosphere. The TT line is a male line obtained from a cross ofCornish,HampshireandPlymouth Rockbreeds. This line has been selected for meat produc-tion since 1985. In the first stages of the breeding program the focus was upon weight gain and carcass traits; however, since 1992, males of this lineage have also been selected for feed conversion rate. CC line is a female line of White Leg-horn selected initially (1989) for egg production and qual-ity. After hatching, chicks were kept in a commercial broiler house at the Animal Science Department, ESALQ-USP. Chicks were initially given commercial broiler feed and waterad libitum. They were exposed to room tempera-ture and continuous luminosity until 21 days of age. At this age, the pituitary and hypothalamus were extracted surgi-cally and stored in liquid nitrogen. Total RNA was ex-tracted from each line separately according to the protocol described by Chomczynski and Sacchi (1987), followed by poly(A)+RNA isolation using the Oligotex kit (GE HealthCare).
cDNA libraries were constructed from 1-2 µg
poly(A)+ RNA using the SuperScript Plasmid System kit (Invitrogen), according to manufacturer’s protocol. Frac-tions containing cDNA larger than 500 bp were ligated into the SalI-NotI site of pSPORT1 vector (Invitrogen). Clones were sequenced from the 5’ends using the Big Dye Termi-nator Cycle Sequencing Ready Reaction kit (Applied Bio-systems) in conjunction with primer T7 (5’-TAATACGA CTCATATAGGG-3’).
Sequences were analyzed for nucleotide quality with PHRED software (Ewinget al, 1998). Sequences consid-ered valid (minimum of 150 bp with quality > 20) were grouped with the CAP3 software (Huang and Madan, 1999). Unique sequences (contigs+singletons) were com-pared to the non-redundant (nr) GenBank database (www. ncbi.nlm.nih.gov) using the Blastx algorithm (Altschulet al., 1990).
Comparative analysis of expression patterns was per-formed between the two lines and all other libraries constructed in the laboratory, according to the relative fre-quency of the ESTs. SNPs were identified analyzing nucle-otide discrepancies between ESTs from the two lines. Only those SNPs that appeared at least twice in the same
line/po-sition and showed PHRED quality equal or higher than 20 were considered as hypothetic line-specific SNPs.
Results and Discussion
Sequence analysis
A total of 5,017 ESTs were obtained from the 5’end of the inserts cloned in the two cDNA libraries. By PHRED analysis, 2,133 reads from broiler line (TT) and 2,153 of the layer line (CC) were considered valid. Sequences referring to the CC line library were deposited in dbEST division of GenBank with accession numbers ranging from CO419474 to CO421626, and those referring to the TT line library re-ceived numbers ranging from CO421627 to CO423759. After clustering and assembly (CAP3 software, Huang and Madan, 1999), the TT line library presented 1,643 unique sequences (contigs + singletons). Of these, 1,477 were sin-gletons and 656 were grouped into 166 contigs, whose se-quence number varied from 2 to 59. The CC line library represented 1,649 unique sequences, with 1,475 singletons and 678 sequences grouped into 174 contigs, with 2 to 70 sequences per contig. This clustering indicated novelty rates of 77% for the TT library and 76.6% for the CC line li-brary. Both library sequences were also clustered together, revealing 3,074 unique sequences and a novelty index of 71.1%.
Expression profile (“digital Northern”)
Relative frequency of ESTs was compared using all G. gallussequences obtained in the laboratory (a total of 13,521 ESTs), in a strategy known as “digital Northern” (Audic and Claverie, 1997). The clustering and assembly of all 13,521 ESTs resulted in 680 contigs formed by grouping TT and CC ESTs. Sequences present in 472 (69.4%) of these contigs were also identified in libraries constructed from somites, limbs (Jorgeet al., 2004) and breast muscle, suggesting that these ESTs are coordinately expressed in all the different tissues studied. Sequences present in 94 contigs (13.8%) were identified as unique to the pituitary and hypothalamus libraries in both TT and CC lines, and were called library-specific contigs. The 114 remaining contigs (16.8%) were library and line-specific, since they were only encountered in the pituitary and hypothalamus li-braries of the lines studied.
SNPs identification
Following clustering and assembly of the sequences from the pituitary and hypothalamus libraries with CAP3 software, ESTs grouped in the same contig were used to search for single nucleotide polymorphisms. Only those SNPs that appeared at least twice in the same line/position and showed PHRED quality equal or higher than 20 were considered as hypothetic line-specific SNPs.
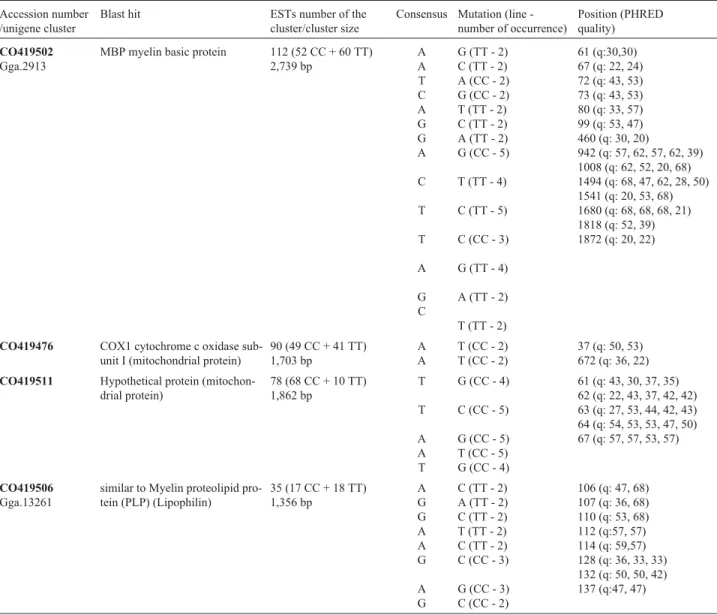
Of the 389 contigs constituted by sequences from the pituitary and hypothalamus libraries, 28 (7.2%) presented 77 line-specific SNPs, corresponding to 52 TT-specific and 25 CC-specific SNPs (Table1). Most SNPs found in ESTs were related to the mitochondrial genome, to structural pro-teins, neuronal constituents, ribosomal proteins and iron binding proteins. SNPs were also observed in hypothetical proteins (proteins still lacking a defined biological func-tion), calcium binding proteins, lipid metabolism related
proteins and ESTs lacking similarity to any sequence in the database consulted.
PHRED quality of the SNP nucleotides varied from 20 to 68, with an average value of 50.1. Among the 28 contigs, 14 presented only one SNP, six presented two SNPs, three showed three SNPs, one contig presented five SNPs, one had seven SNPs, two contigs showed eight SNPs and one presented 14 SNPs. These 28 contigs were consti-tuted by four to 112 ESTs each, presenting an average num-ber of 21.2 ESTs per contig and a mean length of 1,441 bp. Minimum length was 746 bp and maximum length was 3,006 bp. Contig SNP density varied from 0.5 to 9.1 SNPs per kb, with an average density of 1.9 SNP/kb. This result is within the estimated polymorphism range observed by Smithet al.(2002). TT-specific SNPs showed greater den-sity than the CC-specific ones. Average denden-sity values were 1.3 and 0.6, respectively. This two times higher den-sity value for TT-specific SNPs is interesting since the total
Table 1- Relation of putative line specific SNPs found in 28 contigs.
Accession number /unigene cluster
Blast hit ESTs number of the cluster/cluster size
Consensus Mutation (line -number of occurrence)
Position (PHRED quality)
CO419502
Gga.2913
MBP myelin basic protein 112 (52 CC + 60 TT) 2,739 bp
A A T C A G G A
C
T
T
A
G C
G (TT - 2) C (TT - 2) A (CC - 2) G (CC - 2) T (TT - 2) C (TT - 2) A (TT - 2) G (CC - 5)
T (TT - 4)
C (TT - 5)
C (CC - 3)
G (TT - 4)
A (TT - 2)
T (TT - 2)
61 (q:30,30) 67 (q: 22, 24) 72 (q: 43, 53) 73 (q: 43, 53) 80 (q: 33, 57) 99 (q: 53, 47) 460 (q: 30, 20)
942 (q: 57, 62, 57, 62, 39) 1008 (q: 62, 52, 20, 68) 1494 (q: 68, 47, 62, 28, 50) 1541 (q: 20, 53, 68) 1680 (q: 68, 68, 68, 21) 1818 (q: 52, 39) 1872 (q: 20, 22)
CO419476 COX1 cytochrome c oxidase sub-unit I (mitochondrial protein)
90 (49 CC + 41 TT) 1,703 bp
A A
T (CC - 2) T (CC - 2)
37 (q: 50, 53) 672 (q: 36, 22)
CO419511 Hypothetical protein (mitochon-drial protein)
78 (68 CC + 10 TT) 1,862 bp
T
T
A A T
G (CC - 4)
C (CC - 5)
G (CC - 5) T (CC - 5) G (CC - 4)
61 (q: 43, 30, 37, 35) 62 (q: 22, 43, 37, 42, 42) 63 (q: 27, 53, 44, 42, 43) 64 (q: 54, 53, 53, 47, 50) 67 (q: 57, 57, 53, 57)
CO419506
Gga.13261
similar to Myelin proteolipid pro-tein (PLP) (Lipophilin)
35 (17 CC + 18 TT) 1,356 bp
A G G A A G
A G
C (TT - 2) A (TT - 2) C (TT - 2) T (TT - 2) C (TT - 2) C (CC - 3)
G (CC - 3) C (CC - 2)
Table 1 (cont.)
Accession number /unigene cluster
Blast hit ESTs number of the cluster/cluster size
Consensus Mutation (line - num-ber of occurrence)
Position (PHRED quality)
CO419546 COX3 cytochrome c oxidase sub-unit III (mitochondrial protein)
32 (14 CC + 18 TT) 805 pb
A C
C (TT - 3) G (TT - 2)
17 (q: 47,47,42) 19 (q: 53, 47)
CO421660
Gga.13261
similar to Myelin proteolipid pro-tein (PLP) (Lipophilin)
27 (14 CC + 13 TT) 2,059 bp
A
C
G (TT - 3)
G (TT - 2)
1005 (q: 41, 68, 26) 1877 (q: 40, 46)
CO421668 CYTB cytochrome b (mitochon-drial protein)
20 (8 CC + 12 TT) 1,185 bp
A T (CC - 2) 729 (q:22, 22)
CO419634
Gga.6482
Heat shock protein HSP 90-alpha 20 (9 CC + 11 TT) 3,006 bp
G C
A (TT - 2) T (TT - 2)
119 (q: 47, 68) 365 (q: 62, 68)
CO419555 Hypothetical protein 19 (10 CC + 9 TT) 1,814 bp
T C (CC - 2) 1158 (q: 54, 68)
CO421863
Gga.35012
Tubulin, alpha 1c 17 (6 CC + 11 TT) 1,343 bp
C T (TT - 2) 238 (q: 32, 62)
CO421647 Hypothetical protein 15 (2 CC + 13 TT) 1,418 bp
G G
G A A A A
A (TT - 2) A (TT - 3)
A (CC - 2) G (TT - 2) C (TT - 2) G (TT - 2) G (TT - 2)
125 (q:68, 68) 434 (q: 68, 68, 62) 466 (2; 32, 47) 767 (q: 43, 39) 780 (q: 32, 27) 885 (q: 59, 30) 907 (q: 57, 35)
CO422016
Gga.39142
UBC ubiquitin C 14 (9 CC + 5 TT) 880 bp
T
C G T A G
G C
C (CC - 3)
T (TT - 2) A (TT - 2) C (TT - 2) C (TT - 2) A (CC - 3)
A (TT - 2) G (CC - 3)
105 (q: 35, 68, 68) 174 (q: 68, 27) 249 (q: 68, 44) 264 (q: 57, 41) 354 (q: 50, 68) 447 (q: 39, 48, 50) 477 (q: 37, 35) 537 (q: 24, 46, 37)
CO422026 ND4L NADH dehydrogenase subunit 4L
11 (2 CC + 9 TT) 1,425 bp
T C (CC - 2) 667 (2; 62, 51)
CO421775
Gga.34313
Apolipoprotein A-I 11 (4 CC + 7 TT) 1,302 bp
C G (TT - 4) 459 (q: 42,48, 50, 52)
C
T
T (TT - 4)
C (TT - 2)
516 (q: 52, 59, 68, 41) 747 (q: 22, 21)
CO422318
Gga.1383
Enolase 1, (alpha) 10 (4 CC + 6 TT) 1,667 bp
T C
G
C (TT - 2) T (TT - 4)
A (TT - 3)
283 (q: 68, 42) 289 (q: 68, 38, 26, 68) 340 (q: 68, 57, 68)
CO421930
Gga.2613
SPARC Secreted pro-tein, acidic, cysteine-rich (osteonectin)
9 (7 CC + 2 TT) 1,719 bp
C C A
T (TT - 2) T (TT - 2) G (TT - 2)
347 377 659
CO419533
Gga.26418
Calmodulin 2 (phosphorylase kinase, delta)
9 (5 CC + 4 TT) 1,560 bp
C T (TT - 2) 989
CO421674
Gga.22905
TUBB2C tubulin, beta 2C 8 (3 CC + 5 TT) 746 bp
A G (TT - 2) 47
CO421914
Gga.37995
similar to Neuron specific protein family member 2 (Protein p19) (HMP19)
7 (3 CC + 4 TT) 1,544 bp
T C (TT - 2) 967 (q: 35, 41)
CO421925
Gga.35414
Neurofilament, light polypeptide 68kDa
7 (2 CC + 5 TT) 893 bp
number of ESTs in the TT contigs was actually slightly lower than in CC (305 SNPs in ESTs from CC library ver-sus 288 ESTs in the TT). This fact suggests that the TT line is more polymorphic, presenting higher allele numbers than the CC line.
These putative line-specific SNPs were classified according to the nucleotide substitution as transitions (pu-rine→ purine or pyrimidine→ pyrimidine) or transver-sions (purine→pyrimidine→purine). Of the 77 identified
SNPs, 50 (64.9%) were classified as transitions, with 36 (46.7%) being TT-specific and 14 (18.2%) CC-specific; 27 (35.1%) were classified as transversions, with 16 (20.8%) being TT-specific SNPs and 11 (14.3%) CC-specific. This finding gives a transition/transversion ratio of 1.85:1.
The EST collection obtained in this study allowed the identification of genes expressed in the pituitary and hypo-thalamus in two commercial chicken lines, thus providing an important resource for studies of growth physiology and animal breeding. In addition, we identified a series of line-specific SNPs. The SNPs identified in genes line-specifically expressed in this major control center of animal physiology hold great potential for selection studies, since SNPs are the most frequent form of genome variation and are currently considered a new generation of molecular markers.
References
Adams MD, Kelley JM, Gocayne JD, Dubnick M, Polymero-poulos MH, Xiao H, Merril CR, Wu A, Olde B, Moreno RF,
et al.(1991) Complementary DNA sequencing: Expressed sequence tags and human genome project. Science 252:1651-1656.
Altschul SF, Gish W, Miller W, Myers EW and Lipman DJ. (1990) Basic local alignment search tool. J Mol Biol 215:403-410.
Audic S and Claverie JM (1997) The significance of digital gene expression profile. Genome Res 7:986-995.
Bulfield G (2004) Poultry breeding in the post-genomics era. Br Poult Sci 45:5-8.
Burt DW (2002) Applications of biotechnology in the poultry in-dustry. Worlds Poult Sci J 58:5-13.
Chomczynski P and Sacchi N (1987) Single step method of RNA isolation by acid guanidinium thiocyanate-phenol-chloroform extraction. Anal Biochem 162:156-159. Cogburn LA, Wang X, Carre W, Rejto L, Porter TE, Aggrey SE
and Simon J (2003) Systems-wide chicken DNA micro-arrays, gene expression profiling, and discovery of func-tional genes. Poult Sci 82:939-951.
Ewing B, Hillier L, Wendl MC and Green P (1998) Base-calling of automated sequencer traces using Phred. I. Accuracy as-sessment. Genome Res 8:175-185.
Hatey F, Tosser-Klopp G, Clouscard-Martinato C, Mulsant P and Gasser F (1998) Expressed sequence tags for genes: A re-view. Genet Select Evol 30:521-541.
Huang X and Madan A (1999) Cap3: A DNA sequence assembly program. Genome Res 9:868-877.
Jorge EC, Monteiro-Vitorello CB, Alves HJ, Silva CS, Balan RG, Patricio M and Coutinho LL (2004) EST analysis of mRNAs expressed during embryogenesis inGallus gallus. Int J Dev Biol 48:333-337.
Smith EJ, Shi L and Smith G (2002) Expressed sequence tags for the chicken genome from a normalized 10-day-old white leghorn whole-embryo cDNA library. 3. DNA sequence analysis of genetic variation in commercial chicken popula-tions. Genome 45:261-267.
Assistant Editor: Klaus Hartfelder
Table 1 (cont.)
Accession number /unigene cluster
Blast hit ESTs number of the cluster/cluster size
Consensus Mutation (line - num-ber of occurrence)
Position (PHRED quality)
CO422566
Gga.4080
Ribosomal protein L7a 7 (3 CC + 4 TT) 883 bp
T C (CC - 2) 282 (q: 62, 68)
CO419647
Gga.4827
Solute carrier family 25 (mito-chondrial carrier; adenine nucleo-tide translocator), member 6
7 (3 CC + 4 TT) 2,141 bp
C T (CC - 2) 459 (q: 68, 68)
CO422015
Gga.33759
Eukaryotic translation elongation factor 1 alpha 2
5 (1 CC + 4 TT) 866 bp
C T (TT - 2) 381 (q: 57, 62)
CO422299 5 (2 CC + 3 TT)
873 bp
A G
C (TT - 2) A (CC - 2)
540 (q: 22, 50) 566 (q: 43, 54)
CO422068
Gga.35012
Tubulin, alpha 1c 5 (2 CC + 3 TT) 1,258 bp
C T (TT - 2) 651 (q: 23, 33)
CO420128
Gga.1141
Malate dehydrogenase 1, NAD (soluble)
5 (3 CC + 2 TT) 1,428 bp
T G
C (TT - 2) A (TT - 2)
222 (q: 44, 41) 255 (q: 35, 52)
CO422266
Gga.21300
Similar to CD59 protein 4 (2 CC + 2 TT) 815 bp
A C (TT - 2) 355 (q: 57, 57)
CO419495
Gga.12910
Angiotensinogen (serpin peptidase inhibitor, clade A, member 8)
4 (1 CC + 3 TT) 1,071 bp