http://periodicos.uem.br/ojs/acta ISSN on-line: 1807-8621 Doi: 10.4025/actasciagron.v41i1.39609
BIOMETRY, MODELLING AND STATISTIC
Stevia rebaudiana
(Bert) Bertoni: regression models with mixed
effects for investigating seed germination data
Edilenia Queiroz Pereira1* , Vanderly Janeiro1, Terezinha Aparecida Guedes1 and José Walter Pedroza Carneiro2
1Departamento de Estatísitica, Universidade Estadual de Maringá, Av. Colombo, 5790, 87020-900, Maringá, Paraná, Brazil. 2Departamento de Agronomia, Universidade Estadual de Maringá, Maringá, Paraná, Brazil. *Author for correspondence. E-mail: [email protected]
ABSTRACT. We investigated regression models with mixed effects using generalized linear statistics to evaluate germination data from Stevia rebaudiana (Bert) Bertoni. Estimates and validation of statistical
parameters were conducted using the “gamlss” package in the R software. Generalized linear mixed
effects followed the binomial, the beta-binomial and the multinomial distribution with the logit link to explain data based on the following explanatory variables: seed germinator, plastic tray position on every tier of shelves, illuminance conditions (light and darkness) and seed lots. We did not find differences in proportional responses from seed germinators, but we did find differences in the illuminance conditions, plastic tray position on the tiers of shelves in the seed germinators and seed lots. The estimates of the generalized Akaike information criterion (GAIC), Akaike information criterion (AIC), global deviance (GD) and Bayesian information criterion of Schwarz (BIC) indicate similar goodness-of-fit for the binomial and beta-binomial models. All of the models indicate that the position of the germination tray on every tier of shelves and illuminance conditions affected the proportions of normal seedlings. The seed germination in the plastic tray on the uppermost position under fluorescent day light lamps had an effect on the proportion of normal seedlings of Stevia.
Keywords: binomial; beta-binomial; multinomial; gamlss; mixed effects.
Received on September 21, 2017. Accepted on January 12, 2018.
Introduction
Stevia rebaudiana (Bert) Bertoni is the scientific name of the herbaceous Paraguayan plant Ka'a he'ẽ, from
which steviol-glycosides have been extracted by sweetener industrial companies for amending food and beverages (Lemus-Mondaca, Vega-Gálvez, Zura-Bravo, & Ah-Hen, 2012). Despite the possibilities of producing bedding plants from rooting stem cuttings, this agricultural methodology is fragile because certified plants lose their meristematic region where vegetative buds differentiate stems during the crop establishment, and these bedding plants are usually infected by usual growing medium-borne diseases, thereby eliminating plants that die soon after the first crop period and growing season. Thus, seeds are still the best way to produce bedding plants to establish sustainable Stevia rebaudiana crops under field conditions.
The first step to improve our understanding about germination responses is to analyse data from controlled conditions, where the seed germinator is the first step in agricultural production lines for Stevia rebaudiana crops. In seed germinators, we can control light conditions, temperature and humidity, which are important for designing cost-effective systems of crop production. In contrast, seed lots are the foremost external factor influencing bedding plant production, and the literature about Stevia rebaudiana
still requires in-depth understanding about this random variable. The percentage of seed germination of
Acta Scientiarum. Agronomy, v. 41, e39609, 2019 treatments reduce the capability of every seed germinator, because the lower shelves cannot afford the same illuminance to trays as in the germination box method.
Seeds under germination develop botanical structures essential for the establishment of plant populations (Carneiro, 2007). The percentage of normal seedlings is usually affected by light, temperature, water and oxygen because of intrinsic factors in the seed embryos. However, environmental heterogeneity rules in glasshouses, growth chambers (Potvin, 1993) and in seed germinators despite the thermal control in the germination rooms under tropical conditions. Thus, the control of factors during seed germination and bedding plant production has been the foremost drawback faced by agronomists, seed technologists and plant growers to establish cost-effective crops of Stevia rebaudiana.
Otherwise, the literature discriminating treatments based on the germination of Stevia rebaudiana seeds suggests descriptive methods using multivariate tests (Abdullateef & Osman, 2011), the analysis of variance (Abdullateef, Osman, & Zainuddin; 2015) or the analysis of variance with the multiple Duncan test (Simlat et al., 2016; Özyğit, Uçar, & Turgut 2015; Uçar, Özyğit, & Turgut, 2016). However, all these analyses in seed technology have investigated seed lots as fixed effects, thereby making it difficult to make inferences about the estimates. Alternatively, the current statistical literature suggests regression models with generalized linear mixed models based on data, where the response variable is qualitative and the explanatory variables have fixed and random effects. Mead, Curnow, and Hasted (1993) investigated models and made inferences about proportions using the binomial distribution. These authors also suggested the use of the logit link function, where data set analysts assume similar germination probabilities from every seed in the lot. In 1972, Nelder and Wedderburn reported that methods of regression and analysis of variance could be applied to response variables with data distribution in the exponential family. This assumption allowed higher flexibility in studying functional relationships of the mean with its linear predictor (Nelder & Baker, 1972). As the generalized linear models were initially limited to fixed-effects models (Mead et al., 1993), more flexible and less restrictive models led to the method reported by Rigby and Stasinopoulos (2005), when a new class of statistical models – the generalized additive models for position, scale and shape (GAMLSS) – allowed fitting an extensive family of distributions for response variables without having to be part of the exponential family. Furthermore, this method allowed not only fixed explanatory variables in its regression structure but also the random effects with flexibility and efficacy in the statistical analysis. Currently, fitting
these GAMLSS models is possible with the package “gamlss” in the Software R (R Core Team, 2016).
The aim of the current work is to model hierarchical data from the components of the seed germination test of Stevia rebaudiana using the binomial, beta-binomial and multinomial distributions to discriminate effects from fixed and random explanatory variables. Here, the illuminance conditions and the position of plastic germination trays on every tier of shelves were fixed because they can be replicated; otherwise, seed germinator can randomly be chosen in germination rooms, and seed lots have random effects because it is impossible to replicate them in space, time, or both.
Material and methods
The data set
We harvested two seed lots under a field plot (Figure 1a) and two seed lots from pot plants developing under glasshouse conditions (Figure 1b) in the Iguatemi Research Farm, Iguatemi County, Paraná State,
Brazil at 23° 21’ SL, 51° 04’ WL and 542 m of altitude. The weather conditions during the growing season
2012/2013 produced seed lots with different physiological quality because the seeds were harvested under different periods.
and thus, the analyst can safely discriminate the components of the germination test. We also decided to investigate fruit-like seeds to avoid mechanical seed damage during the elimination of the pappus, thereby reducing other sources of the experimental error.
Figure 1. Field plot (a) where we harvested two non-vigours seed lots; and pot plants developing under glasshouse (b) where we harvested two vigour seed lots of Stevia rebaudiana. In both images, the plant rows follow the sunlight.
Every seed germinator had 24 plastic trays with 8 units on the two uppermost, 8 on the two middle, and 8 on the two lowest tiers of shelves (hereafter Pos1, Pos2 and Pos3). In every tier, we randomly replicated the position of the plastic trays. The experimental design can be seen in Figure 2.
Figure 2. Experimental design used to investigate the components of the germination test with Stevia rebaudiana seeds. Every two blocks from R1 to R4 represents the random position of the plastic tray on every two tiers of shelves (upper, middle and down).
Ten days later, we evaluated the components of the seed germination test by counting records of normal seedlings, abnormal seedlings, and the non-germinated seeds (ISTA, 2013) based on trait images from the Figure 3. The length of the normal seedlings in Figure 3a is discrepant because the time to first and last radicle protrusion ranges from the fourth to the tenth day, respectively. These responses are usual in newly domesticated species.
Generalized linear mixed models
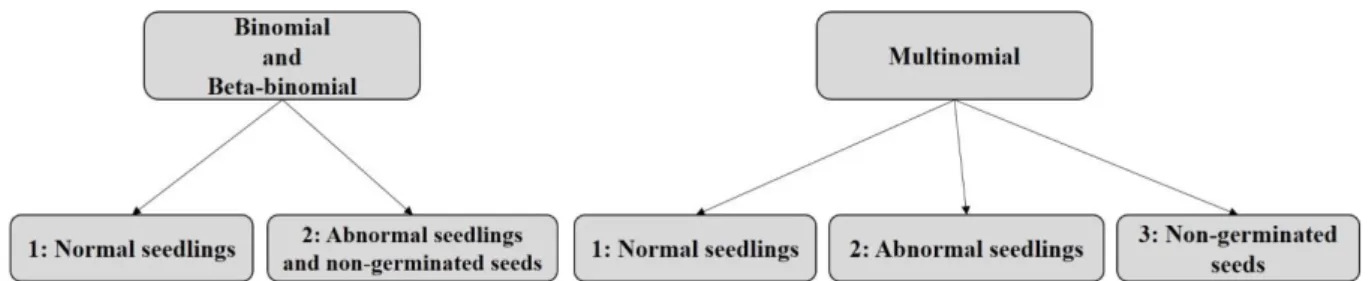
Acta Scientiarum. Agronomy, v. 41, e39609, 2019 taking into account random effects from seed germinators and seed lots. We fit the proportion of normal seedlings, and abnormal seedling in conjunction with non-germinated seeds to the distribution binomial and beta-binomial, and next, we fit the proportion of normal seedlings, abnormal seedlings, and non-germinated seeds to the multinomial distribution following the design in Figure 4.
Figure 3. The components of the seed germination test of Stevia rebaudiana: normal (a) and abnormal seedlings (b) and non-germinated seeds with the carpodium and pappus touching the hydrophilic cotton fibres at left, and an immature or an empty achene
fruit-like seed at right (c) (Carneiro, 2007).
Figure 4. Categorical components from the germination test of Stevia rebaudiana seeds fit to the distribution binomial, beta-binomial and multinomial.
Mixed Model of the Binomial Regression
We based on the random and independent sample Y1, Y2, ..., Yn from the random variable Y such as the Yn
Bin(ni, i). The regression equation for the generalized linear model with mixed effects using the link
function is as follows:
(1)
where: i is the proportion of normal seedlings in the i-th experimental unity, with the parameters 0, 1, 2, and 3, indicating the fixed effects and the parameters b1 and b2 indicating the random effects.
Mixed model of the Beta-binomial
Given Y1, Y2, ..., Yn from the independent random sample Y where Yi BB(ni, i, i), the regression model
with mixed effects has the following link function:
(2)
and
(3)
Mixed model of the multinomial regression
Given Y1, Y2, ..., Ynan independent random sample from a variable Y, such as Yi Multi(ni, 1i, 2i, 3i); the
regression model with mixed effects using the generalized linear model has the following link function:
(4)
and
(5)
where: 2 is the proportion of normal seedlings in the i-th experimental unit, with the parameters 10, 11,
12, and 13 indicating the fixed effects and the parameters b11 and b12 indicating the random effects; and 2 is the proportion of abnormal seedlings in the i-th experimental unit, with the parameters 20, 21, 22, and
23 indicating the fixed effects and the parameters b21 and b22 indicating the random effects.
Odds and odds ratio
The reasoning about regression using generalized linear mixed models is based on the odds ratio:
where the odds are as follows:
and the probability of fail is as follows:
Thus, the odds are as follows:
in which we calculated the odds (success) from Pos2 or Pos3 and Darkness. Thus, the odds ratio was the success ratio from every combination of levels in the explanatory variable. For example, the chance of success in the Position 2 in comparison with Position 1 (Pos2/Pos1) is as follows:
The reasoning in the odds ratio is as follows:
Odds ratio when there is no difference from both odds;
Odds ratio when the odds success assigned in the numerator is higher than in the denominator; Odds ratio when the odds assigned in the denominator is higher than it is in numerator.
The odds ratio is an effect-size statistic (McHugh, 2009) that indicates the explanatory variable with the best odds on the normal seedlings during the germination of Stevia rebaudiana. For more details on odds ratio, see Hosmer, Lemeshow, and Sturdivant (2013).
Generalized additive model for location, scale and shape
Acta Scientiarum. Agronomy, v. 41, e39609, 2019 Thus, GAMLSS assumes that given a vector Y = (y1, y2, ..., yn)t of n independent observations, identically
distributed by the link function gk(k), we have the following model:
(11)
in which gk(k) is the link function needed to link the parameter to the linear predictor k, with k = 1, 2, 3 or 4;
X is the n x 1 (1 + p) matrix of known values with respect to the intercept and the p covariables of fixed effects;
Z is the n x q matrix of known values from q covariables of random effects; is the p x 1 vector of parameters related to the fixed effects;
b is the q x 1 vector of parameters related to the random effects, for which we assume the multivariate distribution N(0, D), in which D is the covariance matrix of the random effects with dimension q x q;
is the n x 1 vector of random errors associated with the model with multivariate distribution N(0, R), in which R is the covariance matrix with dimension n x n.
Estimation method
The methods of estimation based on sampling information are required to estimate the true population value as accurately as possible. The parameters from the model (11) were estimated by penalized maximum likelihood. From the assumption that all the observations of the response variable are independent and identically distributed, we obtain the penalized log likelihood in the GAMLSS (11) model as follows:
(12)
where: is the log likelihood function as , is the probability density function of the response variable, is the vector of fixed hyper-parameters, are measurements representing predictions of random effects, and G is the symmetric matrix with dimension qk x qk that can be dependent on the vector of
hyper-parameters.
Rigby and Stasinopoulos (2005) proposed estimating the function (12) in R using the algorithms from Cole and Green (CG) and Rigby and Stasinopoulos (RS), because of the difficulty or impossibility of finding analytical solutions to estimate these parameters (Rigby & Stasinopoulos, 2005).
Model selection
The choice of a model is very important in statistical modelling when we can explain the responses from explanatory variables with lower error possibility. We used global deviance (GD) and the generalized Akaike information criterion (GAIC) to choose the model
Global Deviance: ,
with the log likelihood.
GAIC: a fixed penalty is added to the GD for every effective degree of freedom in the model:
,
in which df is the total effective degrees of freedom in the model. When = 2, we have the original Akaike information criterion (AIC), and when = log(n), we have the original Bayesian information criterion of Schwarz (BIC). Both criteria allow the comparison of non-nested models, where models with higher numbers of parameters are penalized.
The selected model must have the lowest GD and GAIC () as available in the literature (Rigby & Stasinopoulos, 2005).
Results and discussion
Abdullateef et al., 2015; Simlat et al., 2016; Özyğit, Esra, & Turgut, 2015) — compared to seed lots harvested under protected conditions when the pappus is eliminated (Carneiro & Guedes, 1992; Carneiro & Guedes, 1995; Takahashi, Melges, & Carneiro, 1996; Carneiro, 1996). The alternative use of plastic trays with hydrophilic cotton fibres made it necessary to investigate the germinative responses because the plastic trays reduce the illuminance in the lowest shelves. Thus, the statistical approach in the current experiment allowed us a better understanding of these effects.
Exploratory data analysis (EDA)
First, the EDA indicated the proportions 0.56 of normal seedlings, 0.13 of abnormal seedlings, and 0.32 of non-germinated seeds (Figure 5a), or 0.44 of abnormal seedlings and non-germinated seeds (Figure 5b) across all treatments. Although the proportion 0.44 seems to cast doubt upon the seed quality evaluated in the experiment, we can also see that the proportion of abnormal seedlings was only 0.13 when all the seed germination traits were discriminated during the investigation. Inconsistent quality among seed lots is suggested by the proportion of 0.32 of non-germinated seed. The explanation for this proportion rests on the use of fruit-like seeds from seed lots harvested under field conditions.
(a) (b)
Figure 5. Proportion of normal seedlings (N), abnormal seedlings (AB) and non-germinated seeds (NG) (a); normal seedlings and the sum of abnormal seedlings with non-germinated seeds (b) across all treatments.
Next, Figure 6 allowed us to quantify the proportions of normal and abnormal seedlings and of non-germinated seeds with respect to each factor influencing the components of the seed germination test. In general, seed germinators 3 and 4 seem to produce more normal seedlings than seed germinators 1 and 2. Seed lots 1 and 2 contrast with lots 3 and 4. The presence of light seems to have better responses in the same Figure 6. The lowest tray position on the seed germinator seems to reduce the proportion of normal seedlings.
However, these visual indications of responses from the data set are not sufficient to support precise conclusions about the quality of the Stevia seeds under germination, but they were useful for fitting the models.
Model fitting and considerations
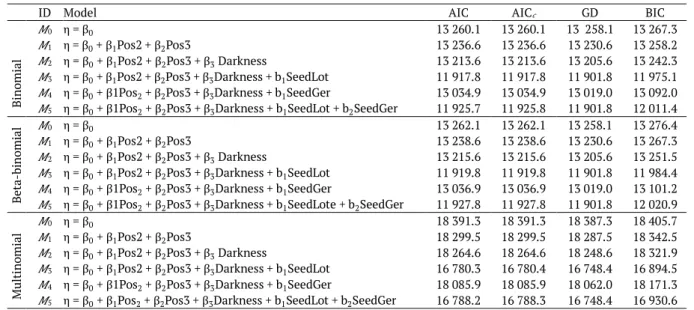
The six regression models from the binomial, beta-binomial and multinomial distributions considered the relationship between the proportion of normal seedlings of Stevia rebaudiana and explanatory variables such as tray position on the tiers of shelves, illuminance conditions and seed lots in different seed germinators. Thus, the best fit in Table 1 had the lowest value of AIC, AIC, DG and BIC estimated from the M3 model for all three distributions. These results stem from the significance of the following explanatory variables on the prevalence of normal seedlings: tray position, illuminance conditions and seed lots. As we expected, the seed germinators had no influence on the percentage of seed germination of Stevia rebaudiana.
The presence of significant effects from illuminance (light or darkness) is in agreement with other experiments where the authors (Abdullateef et al., 2015) made use of different light sources and seed lots. In the
P ro p o rt io n 0 .0 0 .1 0 .2 0 .3 0 .4 0 .5 0 .6 0 .7
N AB NG
0.56 0.13 0.32 P ro p o rt io n 0 .0 0 .1 0 .2 0 .3 0 .4 0 .5 0 .6 0 .7
N AB and NG
0.56
Acta Scientiarum. Agronomy, v. 41, e39609, 2019 current experiment, the seed lots were chosen based on agricultural expertise. Seed lots produced under field conditions have lower percentage of seed germination than seed lots harvested under glasshouse conditions (Carneiro & Guedes, 1995; Takahashi et al., 1996) when pollination was controlled by bees and where recent estimates have frequently exceeded 80%. The current estimates were in part higher than reported in the literature (Abdullateef & Osman, 2011; Abdullateef et al., 2015; Simlat et al., 2016; Özyğit et al., 2015; Uçar et al., 2016), where the influence of sources of light was studied, but lower than responses from our laboratory recorded soon after 1990, where the seeds had been produced under the protected environment of the glasshouse (Carneiro & Guedes, 1992; Carneiro, 1996). In fact, the germination of fruit-like seeds in the current experiment also explains our lower results, but they were necessary to exclude factors like physical damage to the seed embryo when the pappus is mechanically removed, although this method does not filter out seeds with immature embryos, which also reduces the estimates from the seed lots. The current estimate of 37.14% from one seed lot harvested under field conditions was expected in the context of the current experiment.
Figure 6. Quantity of normal (N) and abnormal seedlings (AB), and non-germinated seeds (NG) based on the explanatory variables: seed germinator, plastic tray position on tiers of shelves, illuminance conditions and seed lots.
Table 1. Estimates of AIC, AIC, GD and BIC for comparing and selecting the models.
ID Model AIC AIC GD BIC
B
inomial
0 0 13 260.1 13 260.1 13 258.1 13 267.3
1 0 1 os2 2 os3 13 236.6 13 236.6 13 230.6 13 258.2
2 0 1 os2 2 os3 3 arkness 13 213.6 13 213.6 13 205.6 13 242.3
3 0 1 os2 2 os3 3 arkness b1SeedLot 11 917.8 11 917.8 11 901.8 11 975.1
4 0 1 os2 2 os3 3 arkness b1SeedGer 13 034.9 13 034.9 13 019.0 13 092.0 5 0 1 os2 2 os3 3 arkness b1SeedLot b2SeedGer 11 925.7 11 925.8 11 901.8 12 011.4
B
eta
-b
in
omi
al 0 0 13 262.1 13 262.1 13 258.1 13 276.4
1 0 1 os2 2 os3 13 238.6 13 238.6 13 230.6 13 267.3
2 0 1 os2 2 os3 3 arkness 13 215.6 13 215.6 13 205.6 13 251.5
3 0 1 os2 2 os3 3 arkness b1SeedLot 11 919.8 11 919.8 11 901.8 11 984.4
4 0 1 os2 2 os3 3 arkness b1SeedGer 13 036.9 13 036.9 13 019.0 13 101.2
5 0 1 os2 2 os3 3 arkness b1SeedLote b2SeedGer 11 927.8 11 927.8 11 901.8 12 020.9
Mu
ltinomial
0 0 18 391.3 18 391.3 18 387.3 18 405.7
1 0 1 os2 2 os3 18 299.5 18 299.5 18 287.5 18 342.5
2 0 1 os2 2 os3 3 arkness 18 264.6 18 264.6 18 248.6 18 321.9
3 0 1 os2 2 os3 3 arkness b1SeedLot 16 780.3 16 780.4 16 748.4 16 894.5
4 0 1 os2 2 os3 3 arkness b1SeedGer 18 085.9 18 085.9 18 062.0 18 171.3
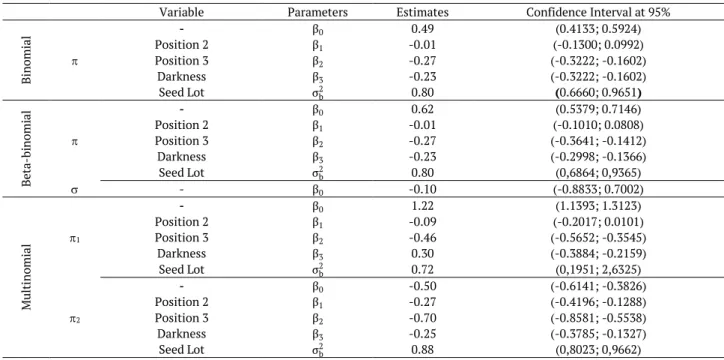
In the Table 2, the estimates of the M3 parameters in conjunction with the confidence intervals at p < 0.95 had similar for the binomial and the beta-binomial distributions but lower for both conditions when we fit the multinomial distribution for and for ). The choice of distribution to make
inferences about seed quality will depend on the researchers’ goals. In the case of Stevia rebaudiana, the multinomial distribution is much more informative because it considers all three components of the germination
test’s experimental design. As the proportion of abnormal seedlings was only 0.13 (Figure 5), we can pay more
attention to the causes of immature, empty fruit-like seeds in the seed lots, or in the seed production system. Empty fruit-like seeds are eliminated during the mechanical elimination of the pappus.
Table 2. Parameter estimates from the models M3 fit to binomial, beta-binomial and multinomial distributions.
Variable Parameters Estimates Confidence Interval at 95%
B
inomial
- 0 0.49 (0.4133; 0.5924)
Position 2 1 -0.01 (-0.1300; 0.0992)
Position 3 2 -0.27 (-0.3222; -0.1602)
Darkness 3 -0.23 (-0.3222; -0.1602)
Seed Lot b2 0.80 (0.6660; 0.9651)
B
eta
-b
in
omi
al
- 0 0.62 (0.5379; 0.7146)
Position 2 1 -0.01 (-0.1010; 0.0808)
Position 3 2 -0.27 (-0.3641; -0.1412)
Darkness 3 -0.23 (-0.2998; -0.1366)
Seed Lot b2 0.80 (0,6864; 0,9365)
- 0 -0.10 (-0.8833; 0.7002)
Mu
ltinomial
1
- 0 1.22 (1.1393; 1.3123)
Position 2 1 -0.09 (-0.2017; 0.0101)
Position 3 2 -0.46 (-0.5652; -0.3545)
Darkness 3 0.30 (-0.3884; -0.2159)
Seed Lot b2 0.72 (0,1951; 2,6325)
2
- 0 -0.50 (-0.6141; -0.3826)
Position 2 1 -0.27 (-0.4196; -0.1288)
Position 3 2 -0.70 (-0.8581; -0.5538)
Darkness 3 -0.25 (-0.3785; -0.1327)
Seed Lot b2 0.88 (0,8023; 0,9662)
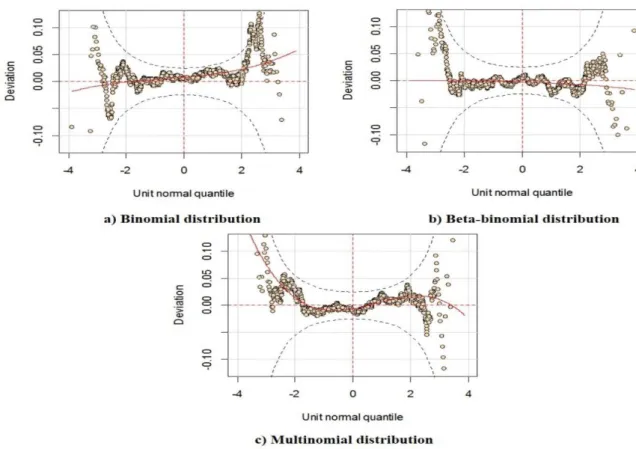
The validation of the above models based on the residual assumption using random quantile residuals is shown in Figure 7.
These worm plots indicate that the binomial, beta-binomial and multinomial distributions are all suitable to describe the components of the seed germination test of Stevia rebaudiana because their respective deviations were within the tolerance limit of 5% (Donoghoe & Marschner, 2015). The dots indicate the
residuals from the model, and the elliptical curves define the CI region at 95%. A model’s goodness of fit is
evidenced by 95% of these dots falling between the two elliptical curves. Estimates higher than 5% indicate that a model is inadequate for explaining the response variables.
Table 3 indicates similar results for the binomial and beta-binomial distributions because these data had neither under-dispersion nor over-dispersion. Thus, the conclusion from both distributions is similar odds for normal seedlings when the plastic trays are on the middle or uppermost tier of shelves. The ratio 0.77 reduced the odds for normal seedlings when the tray position is on the lowest than in the uppermost tiers, or 1.33 (1/0.77) in the uppermost position than in lowest two tiers. Illuminance conditions also influenced the proportion of normal seedlings, with odds ratio of 0.79, or 1.26 higher odds for normal seedlings under light than under darkness. These responses reinforce the determination to use light during the seed germination of Stevia rebaudiana. However, our estimates of normal seedlings under darkness are higher than reported in the literature, where the estimate of 19.4% (Simlat et al., 2016) contrasts with the value of 80.49% in the seed lot produced under protected environment.
Acta Scientiarum. Agronomy, v. 41, e39609, 2019
Figure 7. Worm plotsfrom the binomial, beta-binomial and multinomial distributions.
Next, we compared the proportion of abnormal seedlings with non-germinated seeds. The abnormal
seedlings’ odds increase 1.32 times in the uppermost tier of shelves over the middle tiers and 2.04 times
over the lowest tier. Finally, the odds of abnormal seedlings under light conditions are 1.30 times higher than under darkness. The increased odds of abnormal seedlings result from the effects of light in chemical reactions of seeds damaged by rain water and insect attacks. Therefore, light is an essential fixed factor for investigating the germination of Stevia rebaudiana seeds under controlled conditions, which corroborates the findings reported in the literature (Abdullateef & Osman, 2011; Simlat et al., 2016; Uçar et al., 2016). Random effects from seed lots, otherwise, will be significant when the next lots will detain the estimates of variability with a high probability of being found within the confidence intervals indicated in Table 2.
Table 3. Odds ratios and confidence intervals for models base on the binomial, beta-binomial and multinomial distributions.
Dist. Success Comparison Odds ratio CI (odds ratio 95%)
Binomial Normal
Position 2 / Position 1 0.99 (0.8918; 1.1019) Position 3 / Position 1 0.77 (0.6894; 0.8511) Darkness / Light 0.79 (0.6894; 0.8511)
Beta-binomial Normal
Position 2 / Position 1 0.99 (0.9055; 1.0770) Position 3 / Position 1 0.76 (0.7001; 0.8318) Darkness / Light 0.79 (0.7376; 0.8506)
Multinomial
Normal
Position 2 / Position 1 0.91 (0.8173; 1.0101) Position 3 / Position 1 0.63 (0.5682; 0.7015) Darkness / Light 0.73 (0.6782; 0.8058)
Abnormal
Position 2 / Position 1 0.76 (0.6573; 0.8791) Position 3 / Position 1 0.49 (0.4240; 0.5747) Darkness / Light 0.77 (0.6849; 0.8757)
can be addressed in the germination test by counting the seeds with symptoms of seed-borne diseases, because the current methodology of germination allows the safety discrimination of this component in the non-germinated seeds, as in Figure 3c, where the carpodium displays the initial symptoms of seed-borne disease. The responses from the current experiment allowed us to improve the seed germinator illuminance by using red LEDs on all tiers of shelves.
Conclusion
Generalized linear mixed models using binomial, beta-binomial and multinomial distributions are suitable to explain the responses from the components of the germination test of Stevia rebaudiana seeds. The binomial and beta-binomial distributions are indicated when the aim of the experiment is to understand the effects from explanatory variables only on the proportion of normal seedlings. All the models indicate that the position of the tray on the tiers of shelves and the light conditions affected the odds. The best influence of the tier of shelves on the proportion of normal seedlings of Stevia rebaudiana
under germination was in the uppermost position where we had more illuminance. Studies investigating all three components of the germination test require the use of the multinomial distribution.
Acknowledgements
Thanks to the CAPES for the financial support.
References
Abdullateef, R. A., & Osman, M. B. (2011). Effects of visible light wavelengths on seed germinability in
Stevia rebaudiana Bertoni. International Journal of Biology, 3(4), 83. DOI: 10.5539/ijb.v3n4p83 Abdullateef, R. A., Osman. M. B., & Zainuddin, Z. B. (2015). Acclimatized apparatus enhanced seed
germination in Stevia rebaudiana Bertoni. International Journal of Biology, 7(2), 28. DOI: 10.5539/ijb.v7n2p28
Carneiro, J. W. P., & Guedes, T. A. (1995). Influência do estresse térmico no desempenho germinativo de sementes de Stevia rebaudiana (Bert) Bertoni avaliado pela função de distribuição de Weibull. Revista Brasileira de Sementes, 17(2), 210-216. DOI: 10.17801/0101-3122/rbs.v17n2p210-216
Carneiro, J. W. P. (1996). Determinação do número de sementes para avaliar o desempenho germinativo de Stevia (Stevia rebaudiana (Bert) Bertoni). Revista Brasileira de Sementes, 18(1), 1–5. DOI: 10.17801/0101-3122/rbs.v18n1p1-5
Carneiro, J. W. P., & Guedes, T. (1992). Influência do contato das sementes de Stevia (Stevia rebaudiana
(Bert) Bertoni) com o substrato, avaliada pela função de Weibull. Revista Brasileira de Sementes, 4(1), 65-68. DOI: 10.17801/0101-3122/rbs.v14n1p65-68
Carneiro, J. W. P. (2007). Stevia rebaudiana (Bert) Bertoni: Stages of plant development. Canadian Journal of Plant Science, 87(4), 861-865. DOI: https://doi.org/10.4141/P06-040
Donoghoe, M. W., & Marschner, I. C. (2015). Flexible regression models for rate differences, risk differences and relative risks. The International Journal of Biostatistics, 11(1), 91-108. DOI:
https://doi.org/10.1515/ijb-2014-0044
Hosmer Jr, D. W., Lemeshow, S., & Sturdivant, R. X. (2013). Applied logistic regression. New York, NY: John Wiley & Sons. DOI: ISBN 0-471-35632-8
International Seed Testing Association. [ISTA]. (2013). International rules for seed testing. Bassersdorf, SW: International Seed Testing Association.
Lemus-Mondaca, R., Vega-Gálvez, A., Zura-Bravo, L., & Ah-Hen, K. (2012) Stevia rebaudiana Bertoni: source of a high-potency natural sweetener: A comprehensive review on the biochemical, nutritional and functional aspects. Food Chemistry, 132(3), 1121-1132. DOI:
https://doi.org/10.1016/j.foodchem.2011.11.140
McHugh, M. L. (2009). The odds ratio: calculation, usage, and interpretation. Biochemia Medica, 19(2), 120-126. DOI: http://dx.doi.org/10.11613/BM.2009.011
Acta Scientiarum. Agronomy, v. 41, e39609, 2019 London, UK: Chapman & Hall. DOI: https://doi.org/10.1198/tas.2003.s230
Nelder. J. A., & Baker. R. J. (1972). Generalized linear models. Encyclopedia of Statistical Sciences. New York, US: Wiley Online Library. DOI: 10.1002/0471667196.ess0866.pub2
Özyiğit, Y., Uçar. E., & Turgut, K. (2015). The Effect of Different Pollination Methods on Seed Yield and Germination Features in Stevia rebaudiana Bertoni. Türkiye Tarımsal Araştırmalar Dergisi, 2(2), 114-117. DOI: ISSN: 2148-2306
Potvin, C. (1993). ANOVA: Experiments in Controlled Environments. In: Scheiner, S. M. and Gurevitch, J. (Ed.), Design and analysis of ecological experiments (p. 46-68.). New York, US: Chapman & Hall. R Core Team. (2016). A language and environment for statistical computing. Vienna, AU: R Core Team.
Retrieved on Feb. 12, 2018 from https://www.R-project.org/
Rigby, R. A., & Stasinopoulos, D. M. (2005). Generalized additive models for location, scale and shape.
Journal of the Royal Statistical Society: Series C (Applied Statistics), 54(3), 507–554. DOI: 10.1111/j.1467-9876.2005.00510.x
Simlat, M., Ślęzak, P., Moś, M., Warchoł, M., Skrzypek, E., & Ptak, A. (2016). The effect of light quality on seed germination, seedling growth, and selected biochemical properties of Stevia rebaudiana Bertoni.
Scientia Horticulturae, 295-304. DOI: https://doi.org/10.1016/j.scienta.2016.09.009
Takahashi, L., Melges, E., & Carneiro J. W. P. (1996). Desempenho germinativo de sementes de Stevia rebaudiana (Bert) Bertoni sob diferentes temperaturas. Revista Brasileira de Sementes, 18(1), 6-9. DOI: http://dx.doi.org/10.17801/0101-3122/rbs.v18n1p6-9
Uçar, E., Özyiğit, Y., & Turgut, K. (2016). The Effects of light and temperature on the germination of Stevia seeds (Stevia rebaudiana Bert.).Türkiye Tarımsal Araștırmalar Dergisi, 3 (1), 37-40. DOI:
10.19159/tutad.76528