* Corresponding author: E-mail: [email protected]
Received: August 28, 2017 Approved: March 3, 2018
How to cite: Gomes JBV, Silva CA, Ferreira TLA, Ferreira MM, Inda AV, Curi N. Carbon stocks and pools in relation to the texture of kaolinitic soils from the Brazilian east coast. Rev Bras Cienc Solo. 2018;42:e0170260.
https://doi.org/10.1590/18069657rbcs20170260
Copyright: This is an open-access article distributed under the terms of the Creative Commons Attribution License, which permits unrestricted use, distribution, and reproduction in any medium, provided that the original author and source are credited.
Division - Soil Processes and Properties | Commission - Soil Chemistry
Carbon Stocks and Pools in Relation
to the Texture of Kaolinitic Soils
from the Brazilian East Coast
João Bosco Vasconcellos Gomes(1)*
, Carlos Alberto Silva(2)
, Tamara Letícia de Azevedo Ferreira(3)
, Mozart Martins Ferreira(2)
, Alberto Vasconcellos Inda(4)
and Nilton Curi(2)
(1)
Empresa Brasileira de Pesquisa Agropecuária, Embrapa Florestas, Colombo, Paraná, Brasil. (2)
Universidade Federal de Lavras, Departamento de Ciência do Solo, Lavras, Minas Gerais, Brasil. (3)
Universidade Federal de Lavras, Curso de Engenharia Florestal, Lavras, Minas Gerais, Brasil. (4)
Universidade Federal do Rio Grande do Sul, Departamento de Solos, Porto Alegre, Rio Grande do Sul, Brasil.
ABSTRACT: Extremely kaolinitic soils of Tertiary age elevations on the Brazilian east coast present a wide range of texture, which is recognized as one of the main factors controlling the soil organic matter contents. This study aimed to investigate the organic C storage of different compartments of kaolinitic soils. The studied soils had a wide particle size gradient, were under native forest vegetation, and located on Brazil’s eastern coast (Coruripe - CF, Umbaúba - UF, Nova Viçosa - VF, Sooretama - SF, and Itaboraí - IF). The forest cover of all sites allows to record soil properties reference values for a land use condition closer to that of the original sites. We determined soil organic C (SOC) content and SOC stock up to a depth of 1 m, C of topsoil (0.00-0.08 m), aggregate size classes, and dissolved organic carbon (DOC) of the soil surface horizon (A horizon). Soil C stocks at the 0.00-1.00 m depth ranged from 105 to 137 Mg ha-1 and were not regulated by soil
INTRODUCTION
Soil is the major carbon sink in the world, and the quantification of soil C pools is important in terms of C management, flux, forms, bioavailability, and balance under different terrestrial ecosystems (Debasish-Saha et al., 2014). Appropriate land use and management help to mitigate greenhouse gases and global warming (Lal, 2004) as well as influence of soil organic C (SOC) dynamics and, obviously, the sustainability of agricultural lands (Devine et al., 2014). In Brazil, weathered soils are characterized by a natural low fertility, and most nutrient reservoirs and CEC mainly rely on organic matter stored in the soils (Carvalho et al., 2014). Losses of soil organic matter (SOM) with cultivation are directly linked to the rapid degradation of soil biological, chemical, and physical properties (Madari et al., 2005). Both in natural and cultivated soils, SOM pools and stocks are important indices to infer if the soils can sustain high crop yields and nutrient retention over time.
The SOC contents, besides being influenced by land use and management, are highly regulated by particle size variations, mainly by the clay fraction and associated minerals. The clay + silt content and the mineralogy influence C stabilization via physical and chemical mechanisms (Krull et al., 2001; Plante et al., 2006), affecting the type of linkage mechanisms between mineral surfaces and organic matter. The content of clay + silt is also associated with increased soil aggregation, which influences the physical protection of organic matter, decreasing the accessibility of microorganisms and their exoenzymes (Plante et al., 2006).
Areas with extremely kaolinitic soils are strategic and quantitatively important on Brazil’s eastern coast. They are associated with Tertiary age elevations, mostly formed by Barreiras Formation sediments, and are also called “Coastal Tablelands”. They are located close to the coast and are therefore near highly populated urban areas. In most cases, they are subject to moisture regimes with sufficient rainfall quantity and distribution, allowing competitive agriculture in areas originally under forest vegetation. Considering only their less dissected relief landscapes, there are approximately 64,235 km2 covered by Coastal Tableland soils, with great predominance of Argissolos Amarelos (Ustults) and, to a lesser extent, Latossolos Amarelos (Ustoxs) (Silva et al., 1993; Jacomine, 2001). In contrast to the high clay fraction mineralogy homogeneity, the texture variations of local soils are erratic and extremely pronounced (Zangrande and Rezende, 1989; Gomes et al., 2012), and these variations represent the most intrinsic difference in these soils, influencing organic matter dynamics. Many studies in these soils have approached aspects of organic carbon dynamics in different soil pools (Silva et al., 2006; Silva et al., 2007; Costa et al., 2009; Fontana et al., 2010), but without considering the influence on C pools of the wide range of their soil textures within their experimental designs.
The aim of this study was to investigate the organic C storage of different compartments of extremely kaolinitic soils. The soils have a wide grain size gradient, are under forest native vegetation, and located on Brazil’s eastern coast. The single land use condition, forest cover, allows to record property reference values for a land use condition closer to the original sites and to understand if the wide particle size gradient influences the extremely kaolinitic soil C dynamics.
MATERIALS AND METHODS
Study sites
Four areas were selected in the Barreiras Formation landscapes and one area in the Macacu Formation landscape. Both formations are of Tertiary age, and the soil clay fractions are dominated by kaolinite minerals. All soils have cohesive character, varying in depth and the degree of expression, mainly as a function of the texture. The CF and UF soils have a subsurface fragipan horizon and are moderately well drained, taking into consideration that the presence of cemented horizons in Tertiary soils are more common in dry summer areas (Gomes et al., 2017), such as CF and UF (Table 1). The morphological differences in depth do not influence the soil surface layer, all having a moderate A horizon and lacking redoximorphic features. Differences in soil moisture regime may occur, although all areas are located in a wet tropical climate. These differences are influenced by the dry season (summer or winter, Table 1) and, to a lesser extent, by the presence of depth-cemented horizons, soil texture, and the cohesive layer depth, which in turn is significantly influenced by soil texture. Regarding the Fe oxide contents (determined by sulfuric acid digestion), although all soils have low contents, there is a narrow gradient
(a) (b)
N N
C
U
V
S
I
400 200 0 400
km
400 200 0 400 km
Atlantic Ocean
Atlantic Ocean
-64 -72
0
-10
-20
-30
-56 -48 -40
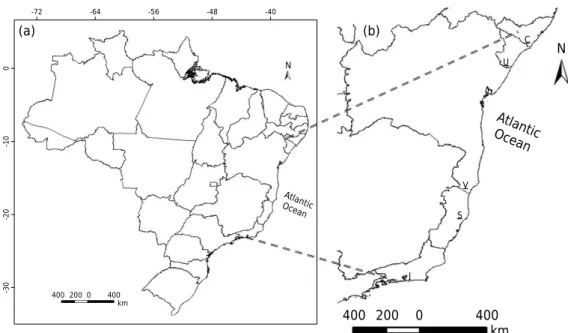
Figure 1. Map of Brazil with the states boundaries (a); in the map are highlighted the location of
the study areas: C - Coruripe (Alagoas State); U - Umbaúba (Sergipe State); V - Nova Viçosa (Bahia State); S - Sooretama (Espírito Santo State); and I - Itaboraí (Rio de Janeiro State) (b).
Table 1. Characteristics of forest sites
Area Code
Soil class
Texture(2)
Slope Chronology/Lithology Annual dry season
Conservation of forest
fragments(3) Drainage
Fe oxides(4)
SiBCS(1) Soil
Taxonomy
% %
Coruripe CF PAdx-f Ustult sandy/fine
loamy 1-2 Tertiary/Barreiras summer
moderate to good
moderately well drained 3
Umbaúba UF PAdx-f Ustult coarse loamy/fine loamy 1 Tertiary/Barreiras summer moderate moderately well drained 5
Nova Viçosa VF LVex-t Udox clayey (fine/very fine) 1 Tertiary/Barreiras (with influence of Proterozoic materials) with rainfall >60 mm)winter (driest month moderate well drained 8
Sooretama SF PAdx-t Ustult sandy/fine loamy 1-2 Tertiary/Barreiras winter good well drained 4
Itaboraí IF LAdx-t Ustox clayey (fine/very fine) 22-25 Tertiary/Macacu winter tolerable well drained 7
(1)
PA = Argissolo Amarelo; LV = Latossolo Vermelho; LA = Latossolo Amarelo; dx =Distrocoeso; ex = Eutrocoeso; f = fragipânico; t = típico. (2) Mean
of three profiles. (3) Classification based on
in loco observations and on the factors described in Machado et al. (2012), Magnago et al. (2014), and Uhlmann et al. (2014). (4)
that starts at a 3 % Fe oxide content in CF soils and reaches a 8 % Fe oxide content in VF soils (Table 1). The VF soils are influenced by granitic gneiss of the Precambrian and, as a consequence, they have a higher Fe oxide contents, are redder, and present a greater supply of nutrients. In all areas, we selected sampling sites under forest. Three replicate sites were sampled for each area, resulting in a total of 15 sampled sites. Soils were sampled in profiles up to 1 m depth at each site. The chemical and physical properties of the A and B horizons of these soil profiles are shown in table 2.
Sampling and soil analysis
For the C stock calculation, samples of the genetic horizons of each soil profile were collected. In each profile, soil was sampled up to a depth of 1 m. On average, each sampling site presented between three and six genetic horizons (three horizons in two profiles, four horizons in eleven profiles, five horizons in one profile, and six horizons in one profile). The samples were air-dried (air-dried fine earth samples - AFE) and passed through a 2-mm sieve. In the same genetic horizons, samples were also collected using a volumetric ring with a diameter of 4.175 cm and a height of 3.225 cm. These samples were oven-dried (105-110 °C) and their masses determined to calculate bulk density (BD). Soil samples for the aggregate analysis were collected at the 0.00-0.08 m layer. These samples were collected in cubes of 0.08-m edge length, which were carefully removed with spatulas from the soil profile walls and packed into cardboard boxes. The cardboard boxes with the samples were conditioned in plastic bags and stored to preserve soil moisture and the structure of the sample. Until analysis, the samples were air-dried for 48 h in the shade to avoid sharp variations in the soil moisture content. Soil aliquots (30 g) were separated into aggregate size classes (fractions) by dry sieving, adapted from the wet sieving method proposed by Haynes (2000). We used a mechanical shaker equipped with five sieves (2.0, 1.0, 0.5, 0.025, 0.105, and 0.053 mm apertures), in which the samples were shaken for 15 min at 2.5 cycles per minute (3.5 cm vertical amplitude).
Thus, the weights of four macroaggregate size classes (4-2, 2-1, 1-0.5, and 0.5-0.25 mm) and two microaggregate size classes (0.250-0.105 and 0.105-0.053 mm) were determined. In addition to the weight of the aggregate size classes, parameters expressing the aggregate size distribution were determined as follows, in equations 1 and 2:
MWD (mean weight-diameter of aggregates) = ∑i=1 xi wi
n Eq. 1
MGD (mean geometric-diameter of aggregates) = exp ∑i=1 wi logxi
n
∑i=1 wi
n Eq. 2
in which wi is the weight fraction in each aggregate class (g) and xi is the mean diameter
of each aggregate class (mm), following Kemper and Rosenau (1986)
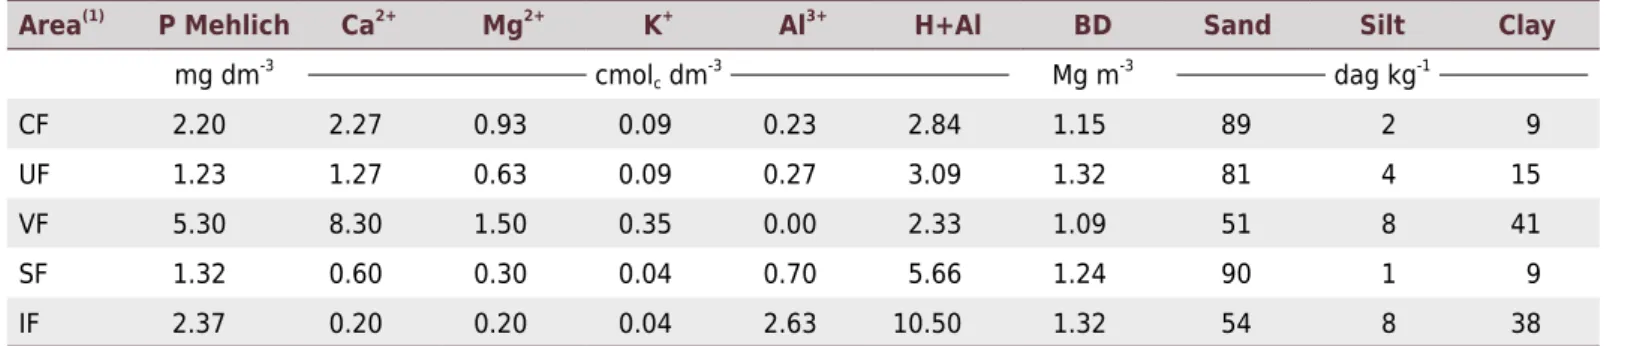
Table 2. Chemical and physical properties of the A horizon soil samples (n =3)
Area(1)
P Mehlich Ca2+
Mg2+
K+
Al3+
H+Al BD Sand Silt Clay
mg dm-3
cmolc dm
-3
Mg m-3
dag kg-1
CF 2.20 2.27 0.93 0.09 0.23 2.84 1.15 89 2 9
UF 1.23 1.27 0.63 0.09 0.27 3.09 1.32 81 4 15
VF 5.30 8.30 1.50 0.35 0.00 2.33 1.09 51 8 41
SF 1.32 0.60 0.30 0.04 0.70 5.66 1.24 90 1 9
IF 2.37 0.20 0.20 0.04 2.63 10.50 1.32 54 8 38
(1)
All under native forest: CF = Coruripe; UF = Umbaúba; VF = Nova Viçosa; SF = Sooretama; IF = Itaboraí. P was extracted by Mehlich-1 and K+ by HCl extraction (Mehlich, 1953); Ca2+
, Mg2+ , and Al3+
The DOC was determined in AFE samples of the A horizon of each Pedon. A mixture of 10 g of fine earth and 20 mL of distilled water was added to the 35-mL tubes; the water-soil mixture was stirred for 1 hour at 0.73 g. In sequence, samples were centrifuged (15 min at 1,814 g) to obtain extracts for C analysis (Scaglia and Adani, 2009). Total organic C (TOC) of the genetic horizon samples, for the different aggregate size classes, was measured via soil combustion at a high-temperature combustion chamber (950 °C), using a NDRI detector of the Elemental Analyzer (Vario TOC Cube model).
The C stock was calculated up to a depth of 1 m for each genetic horizon of each pedon, according to Veldkamp (1994), in equation 3:
C stock (Mg ha-1) = TOC (g 100 g-1) × BD (g cm-3) × soil depth (cm) Eq. 3
Soil thickness was taken into account when the soil C stocks in the profiles were compared, considering the following sampling layers: 0.00-0.17, 0.17-0.42, and 0.42-1.00 m. These values consider the average depth of the transition between the different genetic horizons of the total soils sampled (transitions of AB to BA horizons and BA to B horizons).
The TOC in the aggregate size classes (g kg-1) was calculated considering the aggregate
soil mass of each class, on an equivalent soil mass basis, in equation 4:
TOCag =
(∑i=1 wi Ci) x 1000 n
∑i=1 wi
n Eq. 4
in which wi = weight of aggregates (g) in a size class and Ci = TOC of aggregates
(g 100 g-1) in a size class.
The C proportion of each aggregate size class was also calculated on equivalent soil mass basis, in equation 5; the sum of all classes in %C is equal to 100 %:
%Cag =
(wi Ci)x 100
∑i=1 wi Ci
n Eq. 5
Statistical analyses
Analysis of variance was performed for several soil properties of genetic horizon samples up to a depth of 1 m and at the 0.00-0.08-m soil layer (distribution of aggregate size classes, MWD, MGD, TOCag, aggregate size classes C content, and aggregate size classes
% C). Significant differences between means were assessed by Duncan’s test at p<0.05. Pearson’s correlation analysis was performed to verify the association degree of the measured variables.
RESULTS AND DISCUSSION
C stock, texture, and bulk density relationships
All layers presented a high amplitude of soil clay contents (83 to 448, 119 to 613, and 281 to 649 g kg-1 at the 0.00-0.17, 0.17-0.42, and 0.42-1.00 m layers, respectively)
among the soils of the study areas (Table 3). The BD values did not significantly differ at the surface layer (0.00-0.17 m), but increased at deeper soil layers. The UF soils, at the 0.17-0.42 and 0.42-1.00 m layers, presented BD values higher than in the other areas (1.55 and 1.57 Mg m-3, respectively). These BD values, especially at the 0.42-1.00-m layer
(considering its finer texture), can already represent a degree of mechanical resistance that slows root growth (Jones et al., 2003; Reynolds et al., 2007). The BD values depend on organic matter, soil texture, particle density of sand, silt, and clay, their packing in the soil space, and the soil mass above the soil layer analyzed. All of these factors act in different combinations, determining the ample range (0.40-1.8 Mg m-3) of BD values
normally determined for soil samples, according to Périé and Ouimet (2008).
For all soil layer intervals, the only significant correlations (p<0.01) were found between C content and C stock and between clay content and silt + clay content (Table 4). Considering the high correlation between C content and C stock at the three layers (r = 0.90, 0.98, and 0.92, respectively, for the 0.00-0.17, 0.17-0.42, and 0.42-1.00 m layers), only the C stock results will be discussed (Table 5).
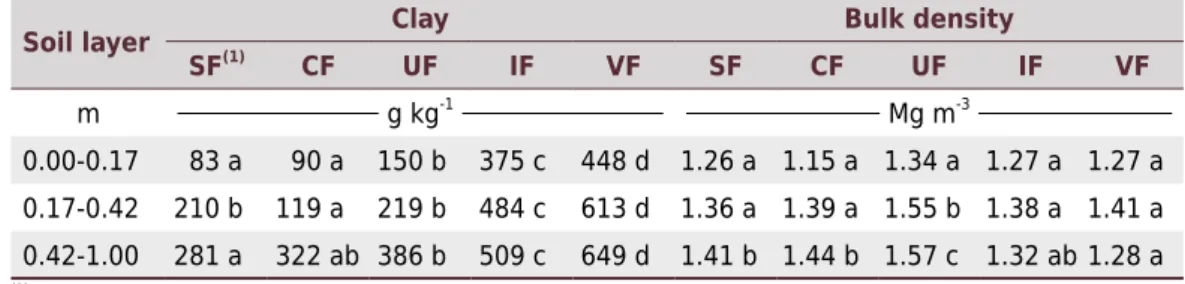
Table 3. Profile distribution of clay content and bulk density of soils from different forest areas (n = 3)
Soil layer Clay Bulk density
SF(1)
CF UF IF VF SF CF UF IF VF
m g kg-1
Mg m-3
0.00-0.17 83 a 90 a 150 b 375 c 448 d 1.26 a 1.15 a 1.34 a 1.27 a 1.27 a
0.17-0.42 210 b 119 a 219 b 484 c 613 d 1.36 a 1.39 a 1.55 b 1.38 a 1.41 a
0.42-1.00 281 a 322 ab 386 b 509 c 649 d 1.41 b 1.44 b 1.57 c 1.32 ab 1.28 a
(1)
All under native forest: CF = Coruripe; UF = Umbaúba; VF = Nova Viçosa; SF = Sooretama; IF = Itaboraí.
Means followed by different lowercase letters in a line indicate differences (p<0.05) in clay and bulk density values among different forest areas at each soil layer. Clay distribution determined by the pipette method (Gee
and Bauder, 1986) and bulk density by the mass:volume ratio in volumetric ring soil samples.
Table 4. Correlation matrix of soil C (stock and content) and some soil properties (n = 15)
C stock Organic C Clay Silt + clay
0.00-0.17 m
Organic C 0.90**
Clay 0.13 0.16
Silt + clay 0.11 0.17 0.99**
Bulk density -0.36 -0.63*
0.18 0.16
0.17-0.42 m
Organic C 0.98**
Clay -0.01 -0.02
Silt + clay 0.04 0.03 0.99**
Bulk density -0.19 -0.35 -0.06 -0.05
0.42-1.00 m
Organic C 0.92**
Clay 0.01 0.19
Silt + clay 0.10 0.28 0.98**
Bulk density -0.01 -0.39 -0.51 -0.51
*
The soil with the sandier texture (SF) had the highest C mean stock at the most superficial layer (48.2 Mg ha-1), although the differences were only significant in comparison with the
mean of the UF sites (31.9 Mg ha-1). Thus, the lowest C stock of the surface layer occurred in UF, which has an intermediate clay content (coarse loamy texture class on A horizon). In the subsequent soil layer, 0.17-0.42 m, the soils from the SF area continued to show the highest C stock value (43.5 Mg ha-1
), which was significantly different from the CF and VF carbon stock means (21.1 and 26.9 Mg ha-1, respectively). At the deepest layer (0.42-1.00
m), soils from SF presented the second highest C stock value (45.8 Mg ha-1), which did not
significantly differ from the highest value found in soils of the IF area (57.6 Mg ha-1). The
mean of the three layers confirms the highest C stocks (137.5 Mg ha-1
) for soil samples from the SF area and the lowest values for UF soil samples (104.5 Mg ha-1).
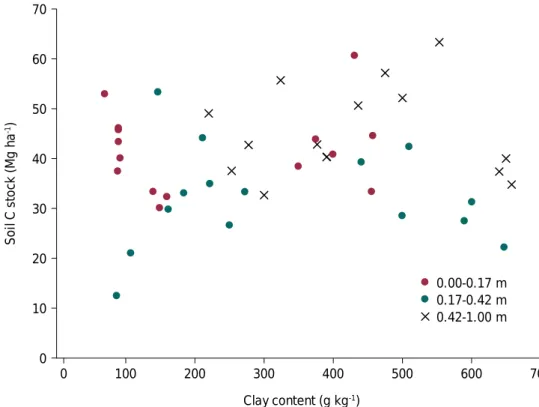
Several studies have found a positive relationship between the fine fraction content (clay or clay + silt) and the soil C stock (Gatto et al., 2010; Heywood and Turpin, 2013; Wiesmeier et al., 2013; Grüneberg et al., 2014). According to Plante et al. (2006), although clay functions as a matrix for organic C stabilization, the fine material content by itself is not necessarily a reliable index to predict soil C content and soil C stock, an assertion that is corroborated for data from all soil layers (Figure 2). Components interact with SOM compounds through different and complex mechanisms, even for specific environments, such as the low-activity clay soils studied. The importance of the relationship between texture and SOC of these soils was highlighted by Feller and Beare (1997). However, for a soil database with a high presence of oxides in the clay fraction (mainly soils associated with the Cerrado region of Brazil), they do not consider the existence of a subset of low-activity clay soils with the predominance of kaolinite, such as the soils studied here. A lack of correlation between the C and silt + clay contents was observed by Gomes et al. (2012) in a soil extremely kaolinitic and with low Fe oxide content from the Brazilian coastal plains, showing a contrast with the well-established correlations for oxidic soils of the Brazilian Cerrado (Zinn et al., 2007). Blocky structure, low porosity, and low permeability of the extremely kaolinitic soils (Ferreira et al., 1999; Resende et al., 2011) may impact the stock of OC and, subsequently, decrease the protective effect of the fine fraction (clay) and imply a physical protection in the sandy texture surface of thick horizons. This condition may change if the clay content does not increase with depth or occurs at depths as a result of a relatively drier soil moisture regime (Gomes et al., 2012). A possible effect of the higher Fe oxide content of the VF soils (Table 1) on the soil structure was not observed, with all soils presenting subsurface diagnostic horizons with a blocky structure (data not shown). Even more scarce are the data sets that show larger C stocks in sandy soils, such as observed in Spodosols, compared with finer textured soils in Denmark (Vejre et al., 2003; Ladegaard-Pedersen et al., 2005).
Another factor that may influence soil C stock results is the length of the dry season for each study area. The two areas with the lowest C stock values (in two of the three layers - 0.00-0.17 and 0.42-1.00 m - and in the total depth range) were UF and CF, although this difference is not necessarily significant to other areas, especially for C stored in the VF
Table 5. Soil organic C stock under different native forest areas
Soil layer Soil organic C stock
SF(1)
CF UF IF VF
m Mg ha-1
0.00-0.17 48.2 b 40.2 ab 31.9 a 41.0 ab 46.1 b
0.17-0.42 43.5 c 21.1 a 31.5 abc 36.7 bc 26.9 ab
0.42-1.00 45.8 ab 43.6 a 41.2 a 57.6 b 37.4 a
0.00-1.00 138 b 105 a 105 a 135 ab 111 ab
(1)
All under native forest: CF = Coruripe; UF = Umbaúba; VF = Nova Viçosa; SF = Sooretama; IF = Itaboraí.
Different lowercase letters in a line indicate differences (p<0.05) among different forest areas at each soil
soils. These two areas (UF and CF) experience the driest quarter of the year from October to December, which overlaps with the high-temperature period in the southern hemisphere (spring-summer). In the other areas, the driest quarter (June to August) overlaps with the period of milder temperatures (Silva et al., 1993; Feitoza, 1998; Gonçalves, 2014). This coincidence between the drought period and high temperatures is a stressful feature from the point of view of biomass production. Although it is not reflected in the vegetation type (forest), it may influence soil C accumulation and other factors which regulate soil C stocks, such as mean temperature, time, and residue C inputs (Stevenson, 1994).
The two areas with the highest C stocks, considering all the C stored in the soil layers (SF and IF), have a quite antagonistic conservation status (Table 1). The SF area has extremely conserved fragments, and the sites are located in the Sooretama Ecological Reserve, with more than 20,000 hectares of preserved forest area, contiguously disposed (Magnago et al., 2014). The IF area has highly altered fragments (by human action) and is in an initial regeneration stage (Uhlmann et al., 2014). Regarding the other three areas, they are in intermediate stages of conservation when compared to SF and IF forest fragments, showing that this factor (degree of forest fragment conservation) did not act in a linear way influencing the C stock in the soil profiles.
The comparison of the absolute values of C stock has, as an initial difficulty, the almost absence of studies that have soil sampling up to 1 m depth. The scarcity of these studies generates data scarcity for this soil depth (1 m), even in the northern hemisphere (Wiesmeier et al., 2013), which has far more measurements than Brazil (Jobbágy and Jackson, 2000). Regardless of the region where C stored in soil was determined, the C stock values found in this study (105 to 138 Mg ha-1) are typical for tropical soils (120 to 224 Mg ha-1),
according to an ample review published by Marques et al. (2016). In addition, many results are not based on the direct measurement of C and their conditioning factors, such as soil properties, but on the modeling of several factors linked to soil C stock calculation (Lindner and Karjalainen, 2007). Thus, in some cases, databases used for C modeling studies are built without strict environmental contextualization (Luyssaert et al., 2010).
Clay content (g kg-1)
0 100 200 300 400 500 600 700
So
il
C
st
ock
(M
g
ha
-1)
0 10 20 30 40 50 60 70
0.00-0.17 m 0.17-0.42 m 0.42-1.00 m
Figure 2. Relationship between soil organic carbon stock and clay fraction content for the native
For Brazil, with many studies analyzing soil C by the wet combustion method, this comparison is even more complicated, considering the large difference in the C contents obtained from the Walkley-Black method and through dry combustion of organic matter (Sato et al., 2014). Determination of C in automatic analyzers results in higher C amounts than those found by wet digestion, taking into account that, in the dry combustion methods, samples are burnt at 950 °C, as performed in this study, which assures the digestion of pyrogenic and recalcitrant C pools, which may be found in tropical soils. One example of this was the soil C stock mean obtained by Curcio et al. (2014) in the same area of the IF sites, which was 98 Mg ha-1 to a depth of 1 m, approximately 28 %
lower than that obtained in this study.
Aggregate size distribution - 0.00-0.08 m layer
All areas had a high proportion of macroaggregates (minimum at UF, with an average of 78.3 %). Native forest fragments, protected by a dense vegetation and free of any mechanized soil disturbance, tend to have a stable soil surface structure, which allows rapid water infiltration and prevents crusting, thus protecting the soil from rainwater erosion (Madari et al., 2005).
The proportion of larger aggregates (2-4 mm size class) followed a texture gradient between areas. As a result, the VF and IF sites (clayey surface texture) had more than a double of the 2-4 mm size class aggregates relative to other forest areas, besides higher MWD and MGD values (Table 6).
Although UF shows approximately twice the silt + clay content than SF, its >0.25 mm aggregates proportion (macroaggregates) was relatively lower, which may be related to the differential forest fragment preservation. Among the forest fragments, Umbaúba is the least preserved, while the Sooretama is the best-preserved fragment (Table 1). The other sandy surficial group, CF, showed the worst aggregation indices.
The influence of the texture on the aggregation properties was evidenced by the significant correlation (p<0.01) between silt + clay and mass proportions in different aggregate size classes (r = 0.95 for 4-2 mm class, r = -0.91 for 0.5-0.25 mm class, and r = -0.79 for 0.25-0.105 mm class), MWD (r = 0.94) and MGD (r = 0.90), although we did not consider wet stability here, which hampers a discussion about the real stability of these aggregates. Even so, it is important to stress that the stability of aggregates, in wet or dry conditions, is extremely dependent on soil texture as well as SOM (Carrizo et al., 2015), as demonstrated by Gomes et al. (2012) for kaolinitic soils of tertiary landscapes such as those studied here.
Table 6. Average values of percentage of mass by aggregate classes of soils of different areas from Brazilian East Coast, 0.00-0.08 m
soil layer
Area(1) Silt +
clay(2)
Aggregate size class
MA MWD MGD
2-4 mm 1-2 mm 0.5-1 mm 0.25-0.50 mm 0.105-0.25 mm 0.053-0.105mm
g kg-1 % mm
CF 90 20 a 26 a 14 b 18 d 15 e 7 b 78 a 1.07 a 0.87 a
SF 100 25 b 36 b 15 b 15 c 7 c 3 a 91 c 1.30 b 1.03 b
UF 190 32 b 28 ab 12 b 13 c 10 d 6 b 84 b 1.39 b 0.99 b
IF 460 62 d 31 ab 2 a 3 a 1 a 1 a 98 d 2.19 d 1.37 d
VF 490 53 c 21 a 13 b 8 b 4 b 1 a 95 d 1.94 c 1.22 c
(1)
All under native forest: CF = Coruripe; UF = Umbaúba; VF = Nova Viçosa; SF = Sooretama; IF = Itaboraí. (2)
Mean value (n = 3). MA = macroaggregates;
MWD = mean weight-diameter of aggregates; MGD = mean geometric-diameter of aggregates. Mean values followed by different letters in the same column are significantly different by Duncan’s test, p<0.05. Silt+Clay distribution was determined by the pipette method (Gee and Bauder, 1986);
Organic C content and its distribution among aggregate size classes - 0.00-0.08 m layer
The C content tended to be higher in larger aggregate classes from each site, although significant differences only occurred in CF and UF. Among the different areas, significant differences were observed only in the 0.105-0.053 mm class (Table 7). The TOCag, expressed
on an equivalent soil mass basis, did not differ among different locations.
The C distribution in each site clearly decreased from larger to smaller aggregate classes. This behavior was similar to that observed in other studies (Six et al., 2000; Castro Filho et al., 2002; Barreto et al., 2009). On sites with clayey soils (VF and IF), there was a higher percentage of carbon in the 2-4 mm size class compared to other sites.
The comparison of C content and C distribution values among aggregate size classes was influenced by the high standard deviations (highest value 75 %, C content of the 1-2 mm aggregate size class in VF). These high standard deviation values can be attributed to the great heterogeneity of the forest soils, which vary greatly in terms of quantity of roots and plant residues, depending on the plant species present (Barreto et al., 2009). Taking into account the difficulty to understand the behavior of different forest soils in relation to C properties of the aggregate size classes by univariate analysis, NMS ordination was applied (Figure 3 and Table 8). Two dimensions of the ordination explained 90 % of the data variability, 49 % on Axis 1 and 41 % on Axis 2. The distribution of sites along Axis 1 was negatively correlated with the C content variables of each aggregate class and the sum of organic C of soil aggregates (mostly p<0.01), but was not correlated with topsoil texture; it should be noted that texture (silt + clay content) was not included in the NMS analysis (Table 8). The relatively lower values of the UF sites found in these variables (Table 7), isolate this area in Axis 1, whereas the areas CF, SF, VF and IF present overlap on the left side of the same axis. On Axis 2, the distribution of sites was influenced by the C distribution properties in the different class aggregates. The % C in the 2-4 mm aggregate class was negatively correlated (p<0.01) with this axis, while the % C of other aggregate size classes was positively correlated. In addition, soil surface horizon texture also showed a strong correlation with Axis 2 (p<0.01). On Axis 2, these correlations showed a behavior gradient of the studied sites that partially followed the texture gradient among the soils of these sites (Figure 3).
Table 7. Organic C content of aggregate size classes; C distribution by aggregate size classes (%C - expressed on an equivalent soil
mass basis), and sum of organic C of soil aggregates (TOCag - expressed on an equivalent soil mass basis), in different forest areas,
0.00-0.08 m soil layer
Area(1)
Aggregate size class Sum of
classes
4-2 mm 2-1 mm 1.0-0.5 mm 0.5-0.25 mm 0.25-0.105mm 0.105-0.053 mm
Organic C content of soil aggregate size classes TOCag
g kg-1
CF 52.3 Da 49.5 CDa 47.7 CDa 43.3 BCa 32.7 Aa 40.0 Bb 44.9 a
SF 51.9 Aa 39.6 Aa 44.8 Aa 40.4 Aa 42.3 Aa 13.3 Aa 42.5 a
UF 24.2 Da 22.0 CDa 20.9 BCa 18.7 ABa 15.9 Aa 17.8 Aa 21.0 a
IF 41.6 Ba 41.3 Ba 38.6 Ba 40.9 Ba 40.4 Ba 30.9 Aab 41.2 a
VF 47.1 Aa 45.6 Aa 45.8 Aa 44.9 Aa 38.6 Aa 47.0 Ab 45.7 a
C distribution by soil aggregate size classes (%C) %
CF 23.3 CDa 28.1 Da 14.9 ABCb 16.9 BCd 10.5 ABc 6.3 Ab 100
SF 31.4 Cab 30.8 Ca 15.5 Bb 14.7 Bcd 6.8 ABb 0.8 Aa 100
UF 35.8 Db 29.1 Ca 11.5 Bb 11.5 Bbc 7.2 ABb 4.9 Ab 100
IF 61.9 Cc 31.4 Ba 1.8 Aa 2.7 Aa 1.5 Aa 0.7 Aa 100
VF 54.5 Fc 20.9 Ea 12.4 Db 7.7 Cab 3.5 Ba 1.0 Aa 100
(1) All under native forest: CF = Coruripe; UF = Umbaúba; VF = Nova Viçosa; SF = Sooretama; IF = Itaboraí, n = 3. Values followed by different capital letters in the same row and lowercase letters in the same column are significantly different by Duncan’s test (p<0.05). Organic C content of aggregate
Dissolved organic C - A horizon
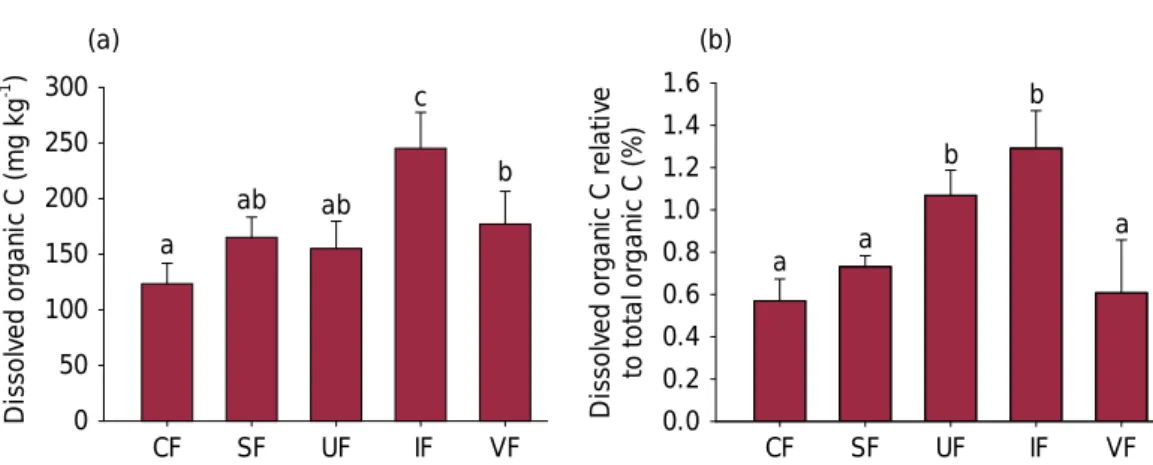
The DOC was higher in clayey soils (VF and IF, Figure 4a), and there was a significant and positive correlation between DOC and silt + clay content (r = 0.67, p<0.05). The average DOC values were below those found by Scaglia and Adani (2009) for forest soils. The significant correlation of DOC with soil texture was not repeated between the DOC proportion relative to TOC and soil texture (r = 0.29), and the DOC proportion relative to TOC was higher in UF and IF soils (average of 1.07 and 1.29 %, respectively, Figure 4b). These are the two areas where the forest fragments were less conserved, and the data
Axis (49 %)
-1.5 -1.0 -0.5 0.0 0.5 1.0 1.5
Axis 2
(41 %)
-1.5 -1.0 -0.5 0.0 0.5 1.0 1.5
C
|U|
I
S
V
Figure 3. Ordination obtained by the non-metric multidimensional scaling, representing the similarity
between forest areas, according to the variation in 13 C aggregate size classes properties (C content aggregate size classes; C distribution by aggregate size classes; and sum of organic C of aggregates size classes), 0.00-0.08 m soil layer. Standard deviation for each group (n = 3) along the axes 1 and 2 is scaled by the bars. C = Coruripe; U = Umbaúba; V = Nova Viçosa; S = Sooretama; I = Itaboraí.
Table 8. Pearson correlation coefficients between C aggregate size classes properties (0.00-0.08 m
soil layer) and non-metric multidimensional scaling (NMS) axes (Figure 3)
Properties Correlation coefficient (r)
Axis 1 Axis 2
Silt + clay content of A horizon(1)
-0.37 -0.78**
Organic C content of 2-4 mm aggregate size class -0.89** 0.20
Organic C content of 1-2 mm aggregate size class -0.89**
0.07
Organic C content of 0.5-1 mm aggregate size class -0.91**
0.16
Organic C content of 0.25-0.5 mm aggregate size class -0.97***
0.03
Organic C content of 0.105-0.25 mm aggregate size class -0.94** -0.09
Organic C content of 0.053-0.105 mm aggregate size class -0.69*
-0.01
Sum of organic carbon of soil aggregates -0.94**
0.05
C distribution - 2-4 mm aggregate size class -0.28 -0.88**
C distribution - 1-2 mm aggregate size class 0.04 -0.20
C distribution - 0.5-1 mm aggregate size class 0.07 0.82**
C distribution - 0.25-0.5 mm aggregate size class 0.26 0.92**
C distribution - 0.105-0.25 mm aggregate size class 0.31 0.94**
C distribution - 0.053-0.105 mm aggregate size class 0.41 0.74**
(1)
The silt + clay content of the A horizon was not included in the NMS analysis. * , **
indicated that, although the DOC content was strongly related with soil organic matter (Gregorich et al., 2000; Kalbitz et al., 2000), some factors related to land use (in the case of a forest fragment, the conservation degree) can influence this relationship. Nevertheless, the DOC values reflect their low proportions in relation to soil organic C (McGill et al., 1986; Chantigny, 2003; Marschner and Kalbitz, 2003).
ACKNOWLEGMENTS
The authors thank Capes (PROEX-AUXPE 593/2018) for the scholarships and financial support provided for this study. We also would like to thank to Fapemig and CNPq for funding this study and scholarship provided.
CONCLUSIONS
Mean C stock values in the 0.00-1.00 m layer of kaolinitic forest soils of the Brazilian east coast varied from 105 (Umbaúba and Coruripe soils) to 137 Mg ha-1 (Sooretama
soils). Variation in soil C stock is not explained by soil texture. This correlation also did not occur for the C content of all aggregate size classes and the total C of aggregate size classes at the 0.00-0.08 m soil layer.
The distribution of C in the largest aggregate class (2-4 mm) of the 0.00-0.08 m layer and the dissolved organic C from the A horizon were positively correlated with the silt + clay content of the surface horizon.
The dissolved organic C proportion relative to total organic C of the surface horizon of forest soils was higher in the less preserved forest fragments (Itaboraí and Umbaúba sites).
REFERENCES
Barreto RC, Madari BE, Maddock JEL, Machado PLOA, Torres E, Franchini J, Costa AR. The
impact of soil management on aggregation, carbon stabilization and carbon loss as CO2 in the
surface layer of a Rhodic Ferralsol in Southern Brazil. Agr Ecosyst Environ. 2009;132:243-51. https://doi.org/10.1016/j.agee.2009.04.008
Carrizo ME, Alesso CA, Cosentino D, Imhoff S. Aggregation agents and structural stability in soils with different texture and organic carbon contents. Sci Agric. 2015;72:75-82.
https://doi.org/10.1590/0103-9016-2014-0026
Carvalho AM, Marchão RL, Souza KW, Bustamante MMC. Soil fertility status, carbon and nitrogen stocks under cover crops and tillage regimes. Rev Cienc Agron. 2014;45:914-21. https://doi.org/10.1590/S1806-66902014000500007
CF SF UF IF VF
Di sso lv ed or ga ni c C (m g kg -1 ) 0 50 100 150 200 250 300 (a) (b) a ab ab c b
CF SF UF IF VF
Di sso lv ed or ga ni c C re la ti ve to to ta l or ga ni c C (% ) 0.0 0.2 0.4 0.6 0.8 1.0 1.2 1.4 1.6 a a b b a
Figure 4. Dissolved organic C (DOC) of the A horizon in different forest areas (a); DOC proportion
Castro Filho C, Lourenço A, Guimarães MF, Fonseca ICB. Aggregate stability under different soil
management systems in a red Latosol in the state of Parana, Brasil. Soil Till Res. 2002;65:45-51. https://doi.org/10.1016/S0167-1987(01)00275-6
Chantigny MH. Dissolved and water-extractable organic matter in soils: a review on
the influence of land use and management practices. Geoderma. 2003;113:357-80.
https://doi.org/10.1016/S0016-7061(02)00370-1
Costa OV, Cantarutti RB, Fontes LEF, Costa LM, Nacif PGS, Faria JC. Estoque de carbono do solo sob pastagem em área de tabuleiro costeiro no sul da Bahia. Rev Bras Cienc Solo. 2009;33:1137-45. https://doi.org/10.1590/S0100-06832009000500007
Curcio GR, Ramos MR, Dedecek RA, Gomes JBV. Imobilização de carbono nos solos. In: Prado RB, Fidalgo ECC, Bonnet A, editores. Monitoramento da revegetação do Comperj: etapa inicial. Brasília, DF: Embrapa; 2014. p. 187-206.
Debasish-Saha, Kukal SS, Bawa SS. Soil organic carbon stock and fractions in relation to land use and soil depth in the degraded Shiwaliks hills of lower Himalayas. Land Degrad Develop. 2014;25:407-16. https://doi.org/10.1002/ldr.2151
Devine S, Markewitz D, Hendrix P, Coleman D. Soil aggregates and associated organic matter under conventional tillage, no-tillage, and forest succession after three decades. PLoS ONE. 2014;9:e84988. https://doi.org/10.1371/journal.pone.0084988
Feitoza HN. The natural units database for Espírito Santo, Brazil: a GIS approach [dissertation]. Enschede/Wageningen: Wageningen Agricultural University; 1998.
Feller C, Beare MH. Physical control of soil organic matter dynamics in the tropics. Geoderma. 1997;79:69-116. https://doi.org/10.1016/S0016-7061(97)00039-6
Ferreira MM, Fernandes B, Curi N. Mineralogia da fração argila e estrutura de Latossolos da região sudeste do Brasil. Rev Bras Cienc Solo. 1999;23:507-14. https://doi.org/10.1590/S0100-06831999000300003
Fontana A, Brito RJ, Pereira MG, Loss A. Índices de agregação e a relação com as substâncias húmicas em Latossolos e Argissolos de tabuleiros costeiros, Campos dos Goytacazes, RJ. Rev Bras Cienc Agrar. 2010;5:291-7. https://doi.org/10.5039/agraria.v5i3a461
Gatto A, Barros NF, Novais RF, Silva IR, Leite HG, Leite FP, Villani EMA. Estoques de carbono no solo e na biomassa em plantações de eucalipto. Rev Bras Cien Solo. 2010;34:1069-79. https://doi.org/10.1590/S0100-06832010000400007
Gomes JBV, Fernandes MF, Barreto AC, Araújo Filho JC, Curi N. Soil attributes under
agroecosystems and forest vegetation in the coastal tablelands of northestern Brazil. Cienc Agrotec. 2012;36:649-64. https://doi.org/10.1590/S1413-70542012000600007
Gomes JBV, Araújo Filho JC, Vidal-Torrado P, Cooper M, Silva EA, Curi N. Cemented horizons and hardpans in the Coastal Tablelands of Northeastern Brazil. Rev Bras Cien Solo. 2017;41:e0150453. https://doi.org/10.1590/18069657rbcs20150453
Gonçalves AO. Caracterização climática. In: Prado RB, Fidalgo ECC, Bonnet A, editores.
Monitoramento da revegetação do Comperj: etapa inicial. Brasília, DF: Embrapa; 2014. p. 65-81.
Gregorich EG, Liang BC, Drury CF, Mackenzie AF, McGill WB. Elucidation of the source and turnover of water soluble and microbial biomass carbon in agricultural soils. Soil Biol Biochem. 2000;32:581-7. https://doi.org/10.1016/S0038-0717(99)00146-7
Grüneberg E, Ziche D, Wellbrock N. Organic carbon stocks and sequestration rates of forest soils in Germany. Glob Change Biol. 2014;20:2644-62. https://doi.org/10.1111/gcb.12558
Haynes RJ. Interactions between soil organic matter status, cropping history, method of
quantification and sample pretreatment and their effects on measured aggregate stability. Biol
Fertil Soils. 2000;30:270-5. https://doi.org/10.1007/s003740050002
Jacomine PKT. Evolução do conhecimento sobre solos coesos no Brasil. In: Cintra LFD, Anjos JL, Ivo WMPM, editores. Workshop coesão em solos dos tabuleiros costeiros; novembro de 2001; Aracaju. Aracaju, Embrapa Tabuleiros Costeiros; 2001. p. 19-46.
Jobbágy EG, Jackson RB. The vertical distribution of soil organic carbon and its relation to climate and vegetation. Ecol Appl. 2000;10:423-36. https://doi.org/10.1890/1051-0761(2000)010[0423:TVDOSO]2.0.CO;2
Jones RJA, Spoor G, Thomasson AJ. Vulnerability of subsoils in Europe to compaction: a preliminary analysis. Soil Till Res. 2003;73:131-43. https://doi.org/10.1016/S0167-1987(03)00106-5
Kalbitz K, Solinger S, Park JH, Michalzik B, Matzner E. Controls on the dynamics of dissolved organic matter in soils: a review. Soil Sci. 2000;165:277-304.
Kemper WD, Rosenau RC. Agregate stability and size distribution. In: Klute A, editor. Methods of soil analysis: physical and mineralogical methods. 2nd ed. Madison: American Society of Agronomy; 1986. Pt 1. p. 425-42.
Krull E, Baldock J, Skjemstad J. Soil texture effects on decomposition and soil carbon storage.
In: Kirschbaum MUF, Mueller R, editors. Net ecosystem exchange. Canberra: Cooperative Research Centre for Greenhouse Accounting; 2001. p. 103-10.
Ladegaard-Pedersen P, Elberling B, Vesterdal L. Soil carbon stocks, mineralization rates, and CO2 effluxes under 10 tree species on contrasting soil types. Can J Forest Res. 2005;35:1277-84.
https://doi.org/10.1139/x05-045
Lal R. Soil carbon sequestration impacts on global climate change and food security. Science. 2004;304:1623-7. https://doi.org/10.1126/science.1097396
Lindner M, Karjalainen T. Carbon inventory methods and carbon mitigation potentials of forests in Europe: a short review of recent progress. Eur J Forest Res. 2007;126:149-56. https://doi.org/10.1007/s10342-006-0161-3
Luyssaert S, Ciais P, Piao SL, Schulze E-D, Jung M, Zaehle S, Schelhaas MJ, Reichstein M, Churkina G, Papale D, Abril G, Beer C, Grace J, Loustau D, Matteucci G, Magnani F, Nabuurs GJ, Verbeeck H, Sulkava M, van der Werf GR, Janssens IA, and members of the Carboeurope-IP Synthesis Team. The European carbon balance. Part 3: forests. Glob Change Biol. 2010;16:1429-50. https://doi.org/10.1111/j.1365-2486.2009.02056.x
Machado MABL, Chaves LFC, Rosa Neto JL, Lyra-Lemos RP. Florística do estrato arbóreo de fragmentos da Mata Atlântica do Nordeste oriental, município de Coruripe, Alagoas, Brasil. Rev Ouricuri. 2012;2:55-72.
Madari B, Machado PLOA, Torres E, Andrade AG, Valencia LIO. No tillage and crop rotation
effects on soil aggregation and organic carbon in a Rhodic Ferralsol from southern Brazil. Soil
Till Res. 2005;80:185-200. https://doi.org/10.1016/j.still.2004.03.006
Magnago LFS, Edwards DP, Edwards FA, Magrach A, Martins SV, Laurance WF. Functional attributes change but functional richness is unchanged after fragmentation of Brazilian Atlantic forests. J Ecol. 2014;102:475-85. https://doi.org/10.1111/1365-2745.12206
Marques JDO, Luizão FJ, Teixeira WG, Vitel CM, Marques EMA. Soil organic carbon, carbon stock and their relationships to physical attributes under forest soils in Central Amazonia. Rev Arvore. 2016;40:197-208. https://doi.org/10.1590/0100-67622016000200002
Marschner B, Kalbitz K. Controls of biovailability and biodegradability of dissolved organic matters in soils. Geoderma. 2003;113:211-35. https://doi.org/10.1016/S0016-7061(02)00362-2
McCune B, Mefford MJ. PC-ORD. Multivariate analysis of ecological data. Version 6.04. Gleneden
Beach: MjM Software Design; 2011.
McGill WB, Cannon KR, Robertson JA, Cook FD. Dynamics of soil microbial biomass and water-soluble organic C in Breton L after 50 years of cropping to two rotations. Can J Soil Sci. 1986;66:1-19. https://doi.org/10.4141/cjss86-001
Plante AF, Conant RT, Stewart CE, Paustian K, Six J. Impact of soil texture on the distribution of soil organic matter in physical and chemical fractions. Soil Sci Soc Am J. 2006;70:287-96. https://doi.org/10.2136/sssaj2004.0363
Resende M, Curi N, Ker JC, Rezende SB. Mineralogia de solos brasileiros: interpretação e aplicações. 2. ed. Lavras: Editora UFLA; 2011.
Reynolds WD, Drury CF, Yang XM, Fox CA, Tan CS, Zhang TQ. Land management effects
on the near-surface physical quality of a clay loam soil. Soil Till Res. 2007;96:316-30. https://doi.org/10.1016/j.still.2007.07.003
Sato JH, Figueiredo CC, Marchão RL, Madari BE, Benedito LEC, Busato JG, Souza DM. Methods of soil organic carbon determination in Brazilian savannah soils. Sci Agric. 2014;71:302-8. https://doi.org/10.1590/0103-9016-2013-0306
Scaglia B, Adani F. Biodegradability of soil water soluble organic carbon extracted from seven
different soils. J Environ Sci. 2009;21:641-6. https://doi.org/10.1016/S1001-0742(08)62319-0
Silva AJN, Cabeda MSV, Carvalho FG. Matéria orgânica e propriedades físicas de um Argissolo Amarelo coeso sob sistemas de manejo com cana-de-açúcar. R Bras Eng Agric Ambiental. 2006;10:579-85. https://doi.org/10.1590/S1415-43662006000300007
Silva AJN, Ribeiro MR, Carvalho FG, Silva VN, Silva LESF. Impact of sugarcane cultivation on soil carbon fractions, consistence limits and aggregate stability of a Yellow Latosol in Northeast Brazil. Soil Till Res. 2007;94:420-4. https://doi.org/10.1016/j.still.2006.09.002
Silva FBR, Riché GR, Tonneau JP, Souza Neto NC, Brito LTL, Correia RC, Cavalcanti AC, Silva FHBB, Silva AB, Araújo Filho JC, Leite AP. Zoneamento agroecológico do Nordeste: diagnóstico do quadro natural e agrossocioeconômico. Petrolina: Embrapa-CPATSA/Recife: Embrapa/CNPS. 1993. (Documentos, 80).
Six J, Elliott ET, Paustian K. Soil macroaggregate turnover and microaggregate formation: a mechanism for C sequestration under no-tillage agriculture. Soil Biol Biochem. 2000;32:2099-103. https://doi.org/10.1016/S0038-0717(00)00179-6
Stevenson FJ. Humus chemistry: genesis, composition, reactions. 2nd ed. New York: John Wiley & Sons, Inc.; 1994.
Uhlmann A, Bonnet A, Curcio GR, Silva AP, Gonçalves FLA, Resende AS. A cobertura vegetal
das florestas e pastagens. In: Prado RB, Fidalgo ECC, Bonnet A, editores. Monitoramento da
revegetação do Comperj: etapa inicial. Brasília, DF: Embrapa; 2014. p. 223-44.
Vejre H, Callesen I, Vesterdal L, Raulund-Rasmussen K. Carbon and nitrogen in danish forest soils - contents and distribution determined by soil order. Soil Sci Soc Am J. 2003;67:335-43. https://doi.org/10.2136/sssaj2003.3350
Veldkamp E. Organic carbon turnover in three tropical soil sunder pasture after deforestation. Soil Sci Soc Am J. 1994;58:175-80. https://doi.org/10.2136/sssaj1994.03615995005800010025x
Wiesmeier M, Prietzel J, Barthold F, Spörlein P, Geuß U, Hangen E, Reischl A, Schilling B, von Lützow M, Kögel-Knabner I. Storage and drivers of organic carbon in forest soils of southeast Germany (Bavaria) - implications for carbon sequestration. Forest Ecol Manag. 2013;295:162-72. https://doi.org/10.1016/j.foreco.2013.01.025
Zangrande MB, Rezende SB. Características de um Podzólico Vermelho-Amarelo abrúptico dos platôs litorâneos do norte do Espírito Santo. Rev Ceres. 1989;36:147-72.