Printed version ISSN 0001-3765 / Online version ISSN 1678-2690 www.scielo.br/aabc
Non-coding RNAs in schistosomes: an unexplored world
KATIA C. OLIVEIRA1, MARIANA L.P. CARVALHO1, VINICIUS MARACAJA-COUTINHO1, JOÃO P. KITAJIMA2 and SERGIO VERJOVSKI-ALMEIDA1
1Departamento de Bioquímica, Instituto de Química, Universidade de São Paulo,
Av. Prof. Lineu Prestes, 748, 05508-000 São Paulo, SP, Brasil
2Hospital Israelita Albert Einstein, Av. Albert Einstein, 627, 05652-000 São Paulo, SP, Brasil
Manuscript received on February 5, 2011; accepted for publication on April 28, 2011
ABSTRACT
Non-coding RNAs (ncRNAs) were recently given much higher attention due to technical advances in sequencing which expanded the characterization of transcriptomes in different organisms. ncRNAs have different lengths (22 nt to>1,000 nt) and mechanisms of action that essentially comprise a sophisticated gene expression regulation network.
Recent publication of schistosome genomes and transcriptomes has increased the description and characterization of a large number of parasite genes. Here we review the number of predicted genes and the coverage of genomic bases in face of the public ESTs dataset available, including a critical appraisal of the evidence and characterization of ncRNAs in schistosomes. We show expression data for ncRNAs inSchistosoma mansoni. We analyze three different microarray experiment datasets: (1) adult worms’ large-scale expression measurements; (2) differentially expressedS. mansoni genes regulated by a human cytokine (TNF-α) in a parasite culture; and (3) a stage-specific expression of ncRNAs.
All these data point to ncRNAs involved in different biological processes and physiological responses that suggest functionality of these new players in the parasite’s biology. Exploring this world is a challenge for the scientists under a new molecular perspective of host-parasite interactions and parasite development.
Key words:Schistosoma mansoni, non-coding RNAs, gene expression profile, genome, transcriptome.
BACKGROUND
Schistosomiasis is a parasitic debilitating disease wide-spread in the world. The disease occurs in 76 countries especially in America, Africa and Asia. It is estimated that 779 million people in these countries are at risk of this infection and around 207 million people are in-fected. Three major species ofSchistosomaare respon-sible for the disease: S. mansoni(that occurs in Amer-ica and AfrAmer-ica), S. japonicum (Asia) and S. haemato-bium(Africa and eastern Mediterranean) (Steinmann et al. 2006).
S. mansoni has a complex life cycle with six dis-tinct developmental stages in two hosts: eggs, miracidia (first larval stage of free living), primary and secondary
Correspondence to: Sergio Verjovski-Almeida E-mail: [email protected]
sporocists (inside the intermediate host – a snail), cer-cariae (second larval stage of free living, that infects the definitive host), schistosomula (inside the definitive host – a mammalian) and adult worms (after 42 days of in-fection) (Gryseels et al. 2006). The adult couple starts the oviposition process and migrates to the mesenteric veins. Eggs cross the epithelial layer of veins and in-testinal wall and are eliminated in the feces, restarting the biological cycle; many eggs go through blood cir-culation and cause inflammatory processes especially in the liver and this is the main cause of the pathological process (Gryseels et al. 2006).
im-mune system, uptake nutrients for their development and differentiation (Amiri et al. 1992, De Mendonca et al. 2000, Davies et al. 2001, Escobedo et al. 2005, Han et al. 2009), and in addition the parasite has many ortholog genes to human receptors (Agboh et al. 2004, Osman et al. 2006, Khayath et al. 2007, Wu et al. 2007, Oliveira et al. 2009). It is also known that the parasite has a sophisticated alternative splicing mech-anism for genes encoding secreted proteins such as micro-exon genes (MEGs) (Demarco et al. 2010), poly-morphic mucins genes (SmPoMucs) (Roger et al. 2008) and venom allergen-like (SmVALs) genes (Chalmers et al. 2008). These mechanisms are supposed to increase the repertoire of parasite proteins (Verjovski-Almeida and Demarco 2011), possibly helping to evade the immune response. Understanding the molecular mech-anisms that are responsible for such a diverse life cycle and that promote the sophisticated parasite’s adaptation is a challenge to the research community.
OVERVIEW ABOUT THE CURRENT KNOWLEDGE ON NON-CODING RNA
In the last years with the advance of sequencing technologies, many genomes of model organisms as well as their transcriptomes have been sequenced and a huge amount of sequence information has become avail-able to the scientific community (The_C.Elegans _Se-quencing_Consortium 1998, Kaul et al. 2000, Carnin-ci et al. 2003, Begun et al. 2007, Birney et al. 2007, Church et al. 2009). As a consequence of the analy-sis of these genomes, the central dogma of molecular biology, namely that genetic information flows from DNA to RNA to protein, the final effector in the cell, has been challenged (Mattick 2003). It has been observed that the majority of the mammalian genome is pervasively transcribed and different types of RNAs without protein-coding potential have been identified (Birney et al. 2007, Nakaya et al. 2007). Because of this new finding, nowadays it is much more complicated to define a gene. A current definition of gene is: “The gene is a union of genomic sequences encoding a coher-ent set of potcoher-entially overlapping functional products” (Gerstein et al. 2007).
In general, one protein-coding gene is defined by the presence of an ORF longer than 100 amino acids.
It is estimated that up to 90% of the human genome is transcribed, however only 2% of these transcripts are protein-coding genes (Claverie 2005, Johnson et al. 2005, Birney et al. 2007). These data revealed that most of the transcripts are non-coding RNAs. In face of this scenario it has been argued that this may reflect tran-scription noise in the cell with no biological relevance (Huttenhofer et al. 2005, Werner and Berdal 2005). In the opposite scenario, important biological functions in-cluding regulatory networks that directly involve ncRNA molecules have been described in the last years (Mattick 2004, Reis et al. 2005, Dinger et al. 2009, Louro et al. 2009, St. Laurent et al. 2009, Chen et al. 2010a, De Lucia and Dean 2010, Nag and Jack 2010).
Distinct characteristics of ncRNAs lead to the pro-posal that they have important regulatory functions: (i) conservation of their promoters, splice junctions, exons, predicted structures, genomic positions and expres-sion (less than in protein-coding genes, nevertheless conserved) (Trinklein et al. 2004, Washietl et al. 2005, Louro et al. 2009, Mercer et al. 2009), (ii) their dy-namic expression and alternative splicing during differ-entiation (Rinn et al. 2007, Guttman et al. 2009), (iii) their altered expression in cancer and other diseases (Reis et al. 2004, Brito et al. 2008, Nana-Sinkam et al. 2009, Kumar et al. 2010), (iv) their association with a particular chromatin signature that is indicative of ac-tively transcribed genes (Dindot et al. 2009, Guttman et al. 2009), (v) their regulation by key morphogens and transcription factors (Cawley et al. 2004, Li et al. 2010); (vi) their tissue and cell-specific expression pattern and sub cellular localization (Louro et al. 2007, Nakaya et al. 2007, Birney et al. 2007, Mattick 2009).
molecular biology. Accumulation of large amounts of sequencing data (Core et al. 2008, Mortazavi et al. 2008, Oliver et al. 2009) and of tiling array experiments (John-son et al. 2005, Wilhelm et al. 2008) was necessary to show pervasive transcription especially in higher euka-ryotes. In consequence of these observations the num-ber of articles related with the description and study of ncRNAs has increased considerably in the last years (Mattick 2009).
Presently many types of ncRNAs have been char-acterized and described in the literature. Short
ncR-NAs are the most studied class of ncRNA in humans and model organims; they includemicroRNAs which are small RNAs (22 nt long) that regulate gene expres-sion of hundreds to thousands genes by partial comple-mentary base pairing to specific mRNAs (a post-tran-scription regulation). They direct degradation of target mRNAs through cleavage by Argonaute enzyme (pres-ent in RISC complex) (Bartel 2004); andsiRNAs, which are endogenous small RNAs with 21 nt length produced by Dicer cleavage of perfectly complementary dsRNA duplexes. They form complexes with Argonaute proteins and are involved in gene regulation, transposon control and viral defense; these RNAs can act incisor intrans
(Brosnan and Voinnet 2009).Long ncRNAs (lncRNAs) are defined as RNAs of little protein-coding potential, with a length higher than 100-200 bp (arbitrary limit). They are the least understood transcriptional unit and comprises a heterogeneous group of transcripts (Costa 2010);Intronic long ncRNAscan be the product of a splice processing or originate from an independent tran-scription (Rearick et al. 2010);Large intergenic ncR-NAsappear to be selected for conservation by evolution and are associated with epigenetic regulation (Guttman et al. 2009).
Another important concept in non-coding RNA is related toNATs: Natural Antisense Transcripts. These are generally non-protein coding transcripts, but fully processed, mRNAs that are transcribed from the oppo-site strand of protein-coding sense transcript (Werner and Swan 2010). Studies reveal a conservation of these transcripts among human, mouse and fish (Dahary et al. 2005, Zhang et al. 2006). These transcripts can act as precursor of siRNA, miRNA, gene silencing, although the roles of NATs are not completely understood.
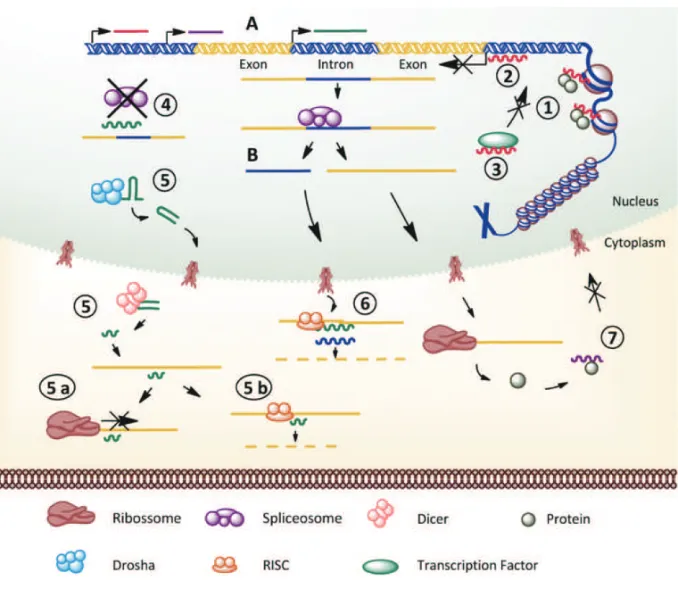
Different mechanisms are involved in the action of ncRNA; here we summarize in Figure 1 the described mechanisms in model organisms (Brosnan and Voinnet 2009, Mercer et al. 2009, Wilusz et al. 2009, Chen and Carmichael 2010).
THE GENOME AND TRANSCRIPTOME OF SCHISTOSOMES
The genome of schistosomes is organized in eight chro-mosomes, seven autosomal and one sexual. In 2003 the transcriptomes ofS. mansoni(Verjovski-Almeida et al. 2003) andS. japonicum(Hu et al. 2003) were published in Nature Genetics, giving insights and perspectives for functional genomics (Verjovski-Almeida et al. 2004). Six years later, in 2009, the genome sequences from both parasites were published in Nature (Berriman et al. 2009, Zhou et al. 2009). Additionally, the genome sequencing project of a third Schistosoma species, S. haematobium, is on the way and will provide a new collection of sequences in a not too distant future (Web-ster et al. 2010).
Table I summarizes the features ofS. mansoniand
S. japonicumpublished genomes (Berriman et al. 2009, Zhou et al. 2009) and all public EST transcripts. We can clearly see the similarities in the genome structure between these two schistosome species.
ESTvs.GENEPREDICTIONS: HOWMANYS. mansoni GENES? HOWMANYPOTENTIALNON-CODINGRNAS?
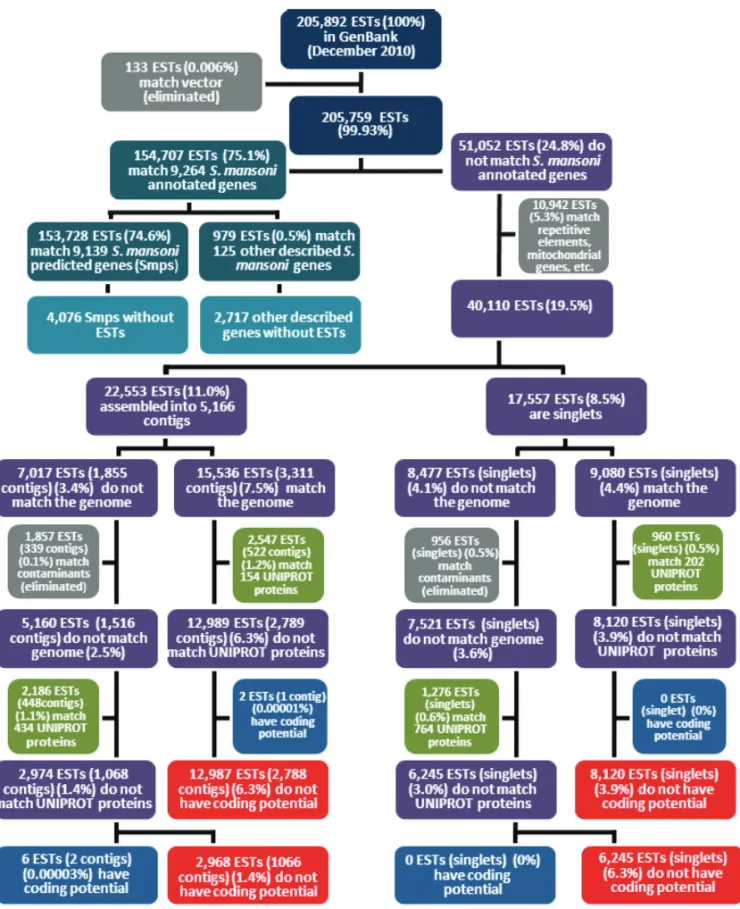
We performed a comparison between the transcriptome and genome of S. mansoni in order to determine the percentage of transcripts that may be related to poten-tially non-coding RNAs (Fig. 2). We used all 205,892 publicS. mansoniESTs and mRNAs available in Gen-Bank at the beginning of December 2010; in the first step of the analysis, we filtered out ESTs that match vectors (133 ESTs). Out of the remaining 205,759 ESTs we found that 154,707 (75.1%) (Fig. 2, upper part) could be mapped to S. mansoni annotated genes (i.e. 13,215 Smp protein-coding gene predictions (Berriman et al. 2009) plus 2,842 other described non-coding genes available at the Sanger Institute website
Fig. 1 – Main described mechanisms of ncRNA action in the cell. Pre-transcriptional mechanism: (1)ncRNAs acting on protein complexes that are involved in chromatin remodeling lead local regulation of gene expression;(2)ncRNA forms a triplex at the promoter region of genes and inhibits gene transcription;(3)ncRNA interacts with transcription factors and acts as co-repressor or co-activator of transcription (modulates protein activity). Post-transcriptional mechanism: (4)ncRNA may act at the spliceosome interfering in the splicing process;(5)ncRNA may generate miRNA (by the processing steps involving Drosha and Dicer) and either(5a)Inhibit mRNA translation, or(5b)Degrade mRNA target by RISC;(6)ncRNA may act as endogenous small-interfering RNA (siRNA) and be cleaved by RISC. Post-translation mechanism:(7)ncRNA may interact with target proteins altering protein localization and organizational role in the cell. Biosynthesis of ncRNA:(A)ncRNA may be generated by independent transcription, or(B)ncRNA may be generated from spliced introns of protein-coding genes.
From the 51,052 ESTs that do not match Smps or other described genes, we filtered out 10,942 ESTs that match repetitive elements, mitochondrial genes, etc. The remaining 40,110 ESTs (19.5%) were assembled using CAP3 with default parameters, generating 5,166 con-tigs (comprised of 22,553 ESTs, 11.0%) and 17,557 EST singlets (8.5%) (Fig. 2).
The assembled ESTs described above were found to be divided into a major set that matches the genome outside of any predicted Smp gene (15,536 ESTs (7.5%) assembled into 3,311 contigs plus 9,080 singlets (4.4%); a total of 24,616 ESTs, 11.9%) and a smaller set that
does not match the genome (7,017 ESTs assembled into 1,855 contigs plus 8,477 singlets; a total of 15,494 ESTs, 7.5%) (Fig. 2). Overall, our analysis shows that 87% of publicS. mansoniESTs match the genome and highlights the fact that a considerable fraction (11.9%) shows evidence of transcribed regions in the genome for which no Smp gene prediction was made (Berriman et al. 2009). Additionally, 4,076 Smps and 2,717 other genes were predicted in the genome withoutS. mansoni
ESTs evidence.
TABLE I
Comparison betweenS. mansoniandS. japonicumgenomes and transcriptomes.
S. mansoni S. japonicum
Length of genome (Mb) 363 398
Number of genomic scaffolds (>2kb) 5,745 13,235
Number of predicted genes 11,809 genes 13,469 13,197 transcripts
% of repetitive sequences 45 40
CG content (total) 35.3 34.1
CG content coding regions 36.3 36
CG content non-coding regions# 35.2 33.8 Average predicted gene size (bp) 11,400* 10,500
Average predicted exon size (bp) 217 n/a
Average intron size (bp) 1,692 n/a
Number of sequenced ESTs 205,892 105,765
in public databases
*Calculated by us according to information in the supplementary material not directly mentioned in the text of the genome paper (Berriman et al. 2009). #InS. japonicumthe intergenic CG content was counted and inS. mansoniit was not.
first step we looked for a match of the assembled ESTs to a curated protein dataset: UNIPROT (The_Uni-prot_Consortium 2010) available at
(http://www.uniprot.org/); in a second step, the assem-bled ESTs that did not match UNIPROT were analyzed for their protein-coding potential using Coding Potential Calculator (CPC) (Kong et al. 2007).
The ESTs that do not match Smps and match the genome (26,616 ESTs) were assembled into 3,311 con-tigs (15,536 ESTs, 7.5%) (Fig. 2) and we found that 522 of these contigs (2,547 ESTs, 1.2%) have match to 154 UNIPROT known proteins from other organisms and were not predicted in S. mansoni; one additional contig (composed of 2 ESTs, 0.00003%) that does not match UNIPROT was predicted by CPC to have a pro-tein-coding potential (Fig. 2). The remaining 2,788 contigs (12,987 ESTs, 6.3%) are potential non-coding RNAs since they do not match UNIPROT proteins and were not predicted by CPC to have protein-coding po-tential. Out of the 9,080 EST singlets (4.4%) that match the genome outside of Smps, we found that 960 ESTs (0.5%) match 202 UNIPROT known proteins; the re-maining 8,120 EST singlets (3.9%) are again potential non-coding RNAs since they do not match UNIPROT and were not predicted by CPC to have protein-coding potential.
Here we conclude that overall, 21,107 ESTs (10.3%) that match the genome have no protein-coding potential and are good candidates forS. mansoni non-coding RNAs; these ESTs point to 10,908 genomic re-gions (2,788 contigs + 8,120 EST singlets) with evidence of ncRNA transcription. These data also point to 356 known UNIPROT proteins (2,547 ESTs assembled into 522 contigs and 960 singlets that match genome) that were expressed inS. mansoni, map to the genome se-quence and were not predicted by the genome project (see Supplementary Table I).
Fig. 2 – Workflow of the genome mapping and annotation ofS. mansoniESTs available in GenBank.
From the 8,477 EST singlets that do not match the genome we found that 956 have match to sequences of potential contaminants. From the remaining 7,521 singlets, 1,276 have match 764 UNIPROT proteins and 6,245 ESTs (3.0%) do not match UNIPROT proteins and do not have protein-coding potential (Fig. 2).
In summary, among the 205,892 publicS. mansoni
ESTs a total of 30,320 ESTs (between contigs and sin-glets) (14.7%) do not have protein-coding potential; of these, 21,107 ESTs (10.2%) match the genome, while only 9,213 ESTs (4.5%) do not match the genome. The fraction of totalS. mansonitranscription comprised by non-coding RNAs probably reveals a lower level of transcriptional activity of this class of RNAs, compared to the transcriptional activity of protein-coding genes. In fact, it has been reported in humans that the long non-coding RNAs are transcribed at a much lower rate than the protein-coding genes (Kapranov et al. 2007) and the non-coding RNAs are represented by between 10 and 20% of the human EST database collection (Nakaya et al. 2007).
COVERAGE OFESTS ONTO THEGENOME ANDGENE
PREDICTIONS:ASURPRISINGTRANSCRIPTION FROM THEINTRONS?
We calculated the percentage of bases in the genome that is comprised of gene predictions and the number of bases in the genome that are covered by NCBI public ESTs. The genome ofS. mansonihas 362,876,148 bp distributed in 5,745 scaffolds>2 kbp (Berriman et al. 2009). From all these bases, 165,206,376 bp (45.5%) are loci of predicted genes. From these loci, 15,852,242 bp are exons of gene predictions (4.3% of total bases in the genome and 9.6% of gene prediction loci) and 149,354,134 bp (41% of total bases in the genome and 90.4% of gene prediction loci) are introns.
Based on the publicS. mansoniESTs that have so far been accumulated and that mapped to the sequenced part of the genome, we find that a total of 16,516,608 genomic bases were covered by at least one EST, which means that at least 4.6% of theS. mansoni genome is transcribed.
From the 16,516,608 transcribed base pairs, a total of 12,717,085 bp (77% of transcribed bases) is located in gene prediction loci (3.5% of genome bases). A total of 7.7% bases in gene prediction loci are covered; the loci include exons and introns of genes.
When looking at the exons in the genome (com-prised of 15,852,242 bp), we found that 8,652,015 bp were covered by public ESTs (42% of transcribed bases) which represents coverage of 55% of exon bases
of the predicted gene sequences (2.4% of genome bases); out of them 1,557,580 bases are in UTRs (Fig. 3). Looking at the predicted genomic introns (149,354,134 bp) we found that 4,065,070 bp were cov-ered by public ESTs (34% of total transcribed bases) corresponding to coverage of only 2.7% of predicted in-tron bases (1.1% of genomic bases). We detected that 3,799,523 transcribed bases (1% of the total genomic bases and 23% of transcribed bases) are located in in-tergenic regions. Figure 3 summarizes these numbers.
Mattick (Mattick 2004) raised the hypothesis that the complexity of an organism probably is derived from the expansion of non-coding regions in the genome, es-pecially because there is no considerable increase in the number of protein-coding genes along the evolution, whereas there is an important expansion of non-coding regions in the genomes of the more complex organisms. This expansion occurred especially in the intronic re-gions of protein-coding genes. Mattick calculated the ratio between ncDNA/total DNA for a large spectrum of organisms with diverse complexities, and found that complex organisms such as Mus musculus andHomo sapiens had a value higher than 0.9 (Mattick 2004). Nevertheless, the position of, for example, Anopheles gambiae, does not fully concord with the hypothesis. Moreover, within-clade variations can be considerable. For example in the ray-finned fishes, genome size (even allowing for polyploidy) can vary by a factor of 20-fold (Smith and Gregory 2009). Assuming that the number of coding genes is unlikely to vary much within this group, factors other than complexity may govern the amount of ncDNA in these genomes. In fact, factors such as metabolic rates, body size, effective population size are known to affect genome size (Keeling and Slamovits 2005).
Based on the genome and gene predictions (Berri-man et al. 2009), here we calculated the ncDNA/Total DNA ratio in S. mansoni and found it to be 0.96, a quite high ratio considering the parasite complexity and comparing to the ratio in the human genome. In addi-tion,S. mansonihas an unusual intron size distribution (Webster et al. 2010). It is interesting to note that an-other platyhelminth, the free-livingSchmidtea mediter-ranea has a 480 Mb genome
Fig. 3 – Analysis ofS. mansonigenomic bases.A)Distribution of bases comprising gene predic-tions. B)Distribution of bases covered by public ESTs. Percentages on the right-hand part of each figure add up to the total percentage of the corresponding sub-category in the left-hand part.
around 100 Mb bigger than S. mansoni and unlikely to have much more coding DNA, which would result in a ncDNA/Total DNA ratio even higher thanS. man-soni; these observations suggest that the expansion of ncDNA may be one of the mechanisms used by evolu-tion to achieve platyhelminth complexity and to interact with the environment. S. mansonimay have undergone genome reduction (Keeling and Slamovits 2005) in comparison toS. mediterraneadue to parasitism of the former.
So far, there is limited evidence of transcriptional activity along theS. mansonigenome; just 4.6% of all genome bases are covered by EST data, as described above. The predicted intronic regions inS. mansoniare large; they comprise 41% of total genomic bases and 90% of genomic loci of gene predictions; inS. mansoni, transcription detected in intronic regions corresponds to only 1.1% of total genomic bases although it reveals that 34% of the transcribed bases are in introns. In humans 30% of the genome is comprised of introns and a pervasive transcription has been detected (Birney et al. 2007, Kapranov et al. 2007). In humans, an
ana-lysis of the 5.3 million public ESTs pointed to the presence of at least one EST mapping to the introns of 74% of all RefSeq human genes (Nakaya et al. 2007). In fact, we re-analyzed the genome mapping of 8 mil-lion public human ESTs, and we found approximately 70,000 unique intronic loci covering nearly 42 million genomic bases (1.7% of the human genome) with evi-dence of transcription.
An intensive effort has been placed in the study of intronic transcription of a segment corresponding to 1% of the human genome by a network of laboratories under the name of ENCODE Project, using different methods such as tiling-arrays, RNA-seq and paired-end sequencing; ENCODE found that 93% of the studied 1% segment was transcribed; both the intronic and in-tergenic regions showed evidence of transcription (Bir-ney et al. 2007), and the suggestion is that this figure can be extrapolated to the entire human genome. In other higher eukaryotes such asC. elegans70% of the genome is transcribed and an ENCODE analysis is be-ing developed (Gerstein et al. 2010). InD. melanogaster
Given the above numbers, it is not surprising that that 34% of the transcribed bases in the publicS. man-soniEST database are in introns. Nevertheless, the lim-ited evidence of genomic coverage of intronic transcrip-tion inS. mansoni(only 1.1% of total genomic bases) can be explained by the fact that until now a limited num-ber of sequencing projects were executed (Franco et al. 1995, 2000, Merrick et al. 2003, Verjovski-Almeida et al. 2003); in addition, the sequencing projects inS. mansoni
were performed with poly-A transcripts, and it is known that many transcripts, especially non-coding RNAs are not poly-adenylated (Kiyosawa et al. 2005). It suggests that a big effort towards deep-sequence and tilling array approaches is warranted to obtain higher transcription coverage of theS. mansonigenome.
NON-CODING RNAS AND SCHISTOSOMES
SHORTNON-CODINGRNAS
The S. mansoni transcriptome project (Verjovski-Almeida et al. 2003) provided data for the identifica-tion of several ESTs encoding proteins related to com-ponents of the microRNA processing machinery. Vari-ous papers have been published in recent years; most of these published works are related to the identification of the RNAi/miRNA pathway as well as to individual miRNA identification, as detailed below.
The current model of RNAi processing involves two cleavage steps, each one centered on a ribonucle-ase enzyme. The precursor RNA (either a dsRNA or a miRNA primary transcript) is processed into a short in-hibitory RNA (siRNA) by RNAse III enzymes called Drosha (in the nucleus) and Dicer (in the cytoplasm), with dsRNA binding domain (dsRBD) protein acting as a cofactor. In the second step, siRNA is loaded into the effector protein complex called RNA-induced si-lencing complex (RISC). This siRNA is opened in a strand-specific manner during RISC assembly and single-stranded siRNA locates its cognate mRNA target by base pairing. Gene silencing is the result of the nuc-leolytic degradation of the RNAse H enzyme Argonau-te. If the siRNA/mRNA duplex contains mismatches at the scissile site, as is often the case of miRNAs, the mRNA target is not cleaved and gene silencing results from translational inhibition (Pratt and Macrae 2009).
The complete conserved machinery to process
mi-croRNA or siRNA has been identified in S. mansoni
andS. japonicum. In 2008 Krautz-Peterson and Skelly (Krautz-Peterson and Skelly 2008a) described the Dicer gene inS. mansoni, and observed the highest expression levels in schistosomula (15 days-old) and eggs. Later, in 2009 Gomes et al. (Gomes et al. 2009) described Dicer, Drosha and four different Argonaute proteins inS. mansoni; they also observed the highest expression level in eggs, but not in schistosomula.
In S. japonicum, two articles were published in 2010; Chen et al. (Chen et al. 2010b) described three Argonaute proteins and observed the highest expression levels in eggs and miracidia; and Luo et al. (Luo et al. 2010) described Dicer and four Argonaute proteins. They also observed that the highest expression levels of Dicer and Argonaute 1 are in eggs and miracidia.
In general these authors are in agreement in their observations and this pattern of expression suggests that the miRNA regulatory pathway might take part in the transformation and development of schistosomes. An-other hypothesis is that miRNA could be responsible for the repression of translation in eggs (Schier 2007).
The characterization of miRNA pathway genes points to the mechanism that causes RNA interference in schistosomes. The RNAi approach was already used in several areas ofS. mansonibiology (Boyle et al. 2003, Skelly et al. 2003, Correnti et al. 2005, Delcroix et al. 2006, Dinguirard and Yoshino 2006, Freitas et al. 2007, Krautz-Peterson et al. 2007, 2010, Ndegwa et al. 2007, Krautz-Peterson and Skelly 2008b, Morales et al. 2008, Pereira et al. 2008, Faghiri and Skelly 2009, Rinaldi et al. 2009, Beckmann et al. 2010) as well as inS. japonicum
(Cheng et al. 2005, Zhao et al. 2008, Kumagai et al. 2009, Zou et al. 2010). RNAi has proved itself as an im-portant tool to elucidate gene function in schistosomes, in a similar way as in other organisms.
con-tains 21 exons and potentially encodes a protein with 1018 amino acids. This SID-1 protein has been shown to be required for uptake of dsRNA inC. elegans (Win-ston et al. 2002); probably SmSID-1 may have the same function in S. mansoni. Localization of this transport protein on the parasite and its functional characterization are some interesting subjects that remain to be clarified. The first miRNAs characterized in schistosomes were described in 2008 (Xue et al. 2008). In that work the authors described 227 cloned microRNAs inS. japo-nicum. Among the cloned miRNAs, five have high level of conservation with well characterized microRNAs in more complex organisms, such as human, mouse, C. elegans,Drosophila: let-7, miR-71, miR-new1, mir-125 and bantam.
Huang et al. (Huang et al. 2009) described 176 miRNAs inS. japonicum(including let-7, miR-71, ban-tam and miR-125), among them 172 novel miRNAs. All these new miRNAs were identified and mapped to the genome by the presence of an inferred RNA hair-pin with pairing characteristics of known miRNA struc-ture. The authors also analyzed the differential expres-sion between mixed adult worms and hepatic schistoso-mula and observed that 35 out of 176 were expressed in adult worms, 60 in schistosomula and 81 in both stages. In 2010 two more publications focused on the iden-tification and characterization of short ncRNAs inS. ja-ponicum using deep-sequencing approach (Hao et al. 2010, Wang et al. 2010); this strategy has proved itself to be a powerful technique to identify small ncRNAs.
Wang et al. (Wang et al. 2010) described 20 spe-cies-conserved miRNAs and 16 schistosome-specific miRNAs. These miRNAs were validated using northern blot or stem-loop qRT-PCR approaches. The paper also described the identification of 4,858 putative endoge-nous siRNAs, 40% of them related to retrotransposons (TE-derived) (Wang et al. 2010) as expected by compar-ison to reports from other species (Golden et al. 2008).
Hao et al. (Hao et al. 2010) sequenced 5.3 and 4.2 million reads from small RNAs from adult worms and schistosomula respectively; these sequences rep-resent around 1.1 million unique clean sequences. In both stages, the majority of sequences are siRNAs, and they are Transposable-Elements-derived. The authors point to the identification of 38 unique S. japonicum
transcripts and 16 miRNAs that belong to 13 miRNA families conserved in other metazoan organisms. The amount of siRNAs was at least 4.4 times larger in schis-tosomula and 1.6 times larger in adult worms than in other stages.
More recently, Simoes et al. (Simoes et al. 2011) performed a bioinformatics homology-based analysis and identified conserved miRNA inS. mansoni. The au-thors also identified 211 novel miRNA in S. mansoni
by sequencing of small-RNA cDNA libraries from adult worms. Out of these 211 candidates, 11 miRNAs had their expression level validated by northen blot ana-lysis; three out of these miRNAs were already described inS. japonicum.
OTHERNON-CODINGRNAS
In 1998 Ferbeyre et al. (Ferbeyre et al. 1998) per-formed an in silico search for RNA structural motifs in sequence databases and have found a hammerhead ribozyme domain encoded in the satellite repetitive DNA ofS. mansoni(Ferbeyre et al. 1998). Transcripts are expressed from these repeats as long multimeric pre-cursor RNAs that cleavein vitro andin vivointo unit-length fragments. This RNA domain is able to engage in bothcisandtranscleavage typical of the hammerhead ribozyme (Ferbeyre et al. 1998).
Copeland et al. (Copeland et al. 2009) carried an extensivein silicosearch in the genome of S. mansoni
and S. japonicum and performed a homology-based annotation of the “house-keeping” ncRNAs in schisto-somes. The authors were able to identify 23 types of ncRNAs with conserved primary and secondary struc-ture; among these we mention rRNA, snRNA, SLRNA, SRP, tRNA and RNase P, and possibly MRP and 7sK RNAs. The previously described hammerhead ribozyme RNA (Ferbeyre et al. 1998) is the most diverse because it originates from repetitive DNA; tRNAs were found to be the next most diverse ncRNAs encoded in theS. mansonigenome (tRNAscan-SE predicted a total of 713 tRNAs) (Copeland et al. 2009). The authors focused on the comparison between tRNA populations in other schistosomes and in a free-living platyhelminth organ-ism (Schmidtea mediterranea); they also confirmed in
S. mansonithe first miRNAs described inS. japonicum
Until now few articles studied the expression and characterization of ncRNAs in schistosomes, as review-ed above. Specifically, nothing can be found in the liter-ature about long (>200 nt) ncRNAs.
DIFFERENTIAL EXPRESSION OF NON-CODING RNAS IN SCHISTOSOMES: OUR EXPERIENCE
AND PERSPECTIVE
DETECTION OFTRANSCRIPTION FROM BOTHGENOMIC
STRANDS IN THESAMELOCUS IN S. mansoni ADULTWORMS
Our group in 2007 studied the transcriptome of S. man-soniadult worms using a microarray platform with 44 k oligonucleotide (60-mer) probes (Verjovski-Almeida et al. 2007); we detected 156 genome loci that were rep-resented by probes on both genomic strands for which there was evidence of expression from both probes. From these, 9 loci were selected for validation using strand-specific RT-qPCR and we validated 6 loci. These 156 loci may be sources of ancestral Natural Antisense Tran-scripts (NATs) (Werner and Swan 2010), that have not been characterized so far.
The above paper (Verjovski-Almeida et al. 2007) was published before the availability ofS. mansonigene predictions to the scientific community at Schisto Gene-DB website (http://www.genedb.org/Homepage/Smansoni). Here we carefully performed a re-annotation of this ar-ray platform and mapped the oligonucleotide probes to
S. mansoni gene predictions and proteins available in GenBank (nr). This re-annotation is available as Supple-mentary Table II. With the re-annotation we found that 108 out of 156 loci with expression from both genomic strands do map to gene predictions. From these 108 loci, 18 map on protein-coding exons and therefore only one strand in the pair is an ncRNA. Another 18 of them map to the UTR region and an additional 72 map to intronic regions (2 loci in the same gene prediction). All these 108 are candidates of NAT transcription (Werner and Swan 2010). Out of the remaining 48 loci that do not matchS. mansonigene predictions, 27 match conserved proteins in GenBank and again only one strand in the pair is an ncRNA. Finally, 21 still have no match proteins either in GenBank or gene predictions.
This finding is extremely interesting because here we point to the first potential NATs in schistosomes. The
list with these 135 loci with evidence of NATs is avail-able in Supplementary Tavail-able III. From the 6 loci with expression in both genomic strands, which were vali-dated by strand-specific RT-qPCR (Verjovski-Almeida et al. 2007), we found that 4 are located in gene pre-diction loci (highlighted in Supplementary Table III). They are: Smp_174720, Smp_136110, Smp_096790 (all of them mapped to intronic regions), and Smp_194860 (mapped to an exonic region). Probes that have the same orientation of the coding message and map to intronic regions may be revealing novel non-predicted exons of that given protein-coding gene. An alternative explana-tion remains, in that these introns may be genomic loci of independent transcription or the intron spliced from the immature pre-mRNA may be processed as a precur-sor of ncRNA (i.e. miRNA). Evidence of transcription has been obtained from the opposite strand of protecoding predicted genes, which certainly points to in-dependent antisense transcriptional events. The future molecular characterization of these candidates should help in understanding the molecular mechanism of gene regulation in schistosomes.
NON-CODINGRNAS WITHEXPRESSIONCHANGES
INDUCED BYHUMANTNF-α
In December 2009 our laboratory published the ortholog gene of TNF-αreceptor inS. mansoniand characterized the effect of human TNF-αon the parasite gene expres-sion using a microarray platform of 44k oligonucleotide probes (Oliveira et al. 2009). Here, we re-annotated the 44k oligonucleotide array according to gene predictions that appear in the genome publication (Berriman et al. 2009) in order to highlight the differentially expressed probes that map to the opposite strand of known protein-coding genes (potentially ncRNAs regulated by TNF-α). Expression changes induced by treatment with hu-man TNF-α had been detected in newly transformed 3 h-old schistosomula in culture (1 h treatment). A set of 755 probes had been identified with a statistically significant (q-value<0.05) differential expression be-tween TNF-α treated and control early schistosomula (Oliveira et al. 2009); with the re-annotation we con-clude that 686 unique genes were affected.
Among these 686 genes, 564 match S. mansoni
predic-tions, 69 have match to conserved proteins in GenBank, comprising a total of 667 known coding genes, and 21 have no match. Among these 667 genes, 65 have significant changes in the expression level of the anti-sense message of the respective loci and 6 loci have significant expression changes in both sense and anti-sense messages. From the 6 loci with changes in the expression level in both strands, 3 of them have a de-creased expression of sense and anti-sense messages in response to human TNF-αwhile the other 3 have a dis-crepant expression pattern; 3 of these 6 loci have pairs of probes that map to intronic regions of predicted genes, 2 in UTR regions and one in a coding exon. All the 65 gene loci with detected expression in the anti-sense strand and the 6 loci with expression in both genomic strands are listed in Supplementary Table IV (Part A).
In adult worms treated during 1 h or 24 h with TNF-αwe had identified (Oliveira et al. 2009) two dis-tinct expression patterns in treated adult worms: genes with transient expression changes (up-regulated at 1 h treatment and down-regulated at 24 h treatment, or the opposite pattern) and genes with sustained changes (up-regulated at 1 h and 24 h treatment, or down-(up-regulated throughout).
A set of 1,594 probes revealed statistically signif-icant (q-value <0.05) transient changes in expression (Oliveira et al. 2009). With the microarray re-annota-tion we conclude that there are 1404 unique genes with transient changes induced by TNF-α; 1048 genes have match toS. mansonigene predictions, 54 matchS. japo-nicum gene predictions, 203 match conserved proteins (GenBank), comprising a total of 1305 known protein-coding genes, and 99 have no match. Among these 1305 differentially expressed known protein-coding genes we verified that 177 coding genes have significant changes in the expression level of the anti-sense message from the respective loci, and 45 loci have expression changes in both sense and anti-sense messages. In the group of genes with differential expression in both loci strands, 28 of them have the same pattern of expression change in the sense/anti-sense pair of probes, while 19 genes have an opposite pattern of expression between sense and anti-sense probes.
In consequence of the re-annotation we observed that out of the 45 gene loci that have significant changes in expression in both strands, 29 have pairs of probes that map to intronic regions of predicted genes and 3 pairs of probes map to UTRs. All 45 loci with expression in both genomic strands and 177 gene loci with anti-sense expression are listed in Supplementary Table IV (Part B).
A group of genes had been identified with sus-tained changes in expression at 1 and 24 h TNF-α treatment (Oliveira et al. 2009). A total of 626 probes had a sustained change in expression; with the present microarray re-annotation we conclude that there are 584 differentially expressed unique genes with sustained changes in the expression pattern induced by TNF-α. From these 584 genes, 471 have match toS. mansoni
gene predictions, 25 matchS. japonicumgene predic-tion, 58 genes have match to conserved proteins in Gen-Bank, comprising a total of 554 annotated genes, and 30 have no match to GenBank. Among the 554 known coding genes, 7 gene loci have evidence of transcription in both strands (4 with expression induced by TNF-αin the messages from both strands and 3 with opposite ex-pression pattern in each strand). Interestingly, in these 3 loci with opposite expression pattern between sense and anti-sense messages, the pair of probes maps to intronic regions of the protein-coding genes. We also observed in the group of 584 known protein-coding genes with sustained changes in the expression level that 3 genes have significant changes in the expression profile just in the anti-sense message of the locus; all these 10 gene loci with expression in anti-sense and in both strands are available in Supplementary Table IV (Part C).
NON-CODINGEXPRESSIONSIGNATUREAMONGLIFE
CYCLESTAGES
A number of papers already describe differences in gene expression among the developmental stages of schistosomes (Dillon et al. 2006, Vermeire et al. 2006, Jolly et al. 2007, Fitzpatrick et al. 2009, Gobert et al. 2009). Here we performed a set of experiments with 5 developmental stages (eggs, miracidia, cercariae, 7-day-old schistosomula and adult worms) using a 4k-element cDNA microarray platform that was designed to have a considerable fraction of probes for non-protein-coding genes (1133 probes); a detailed description of this plat-form is deposited in GEO under accession number GP-L3929 (Demarco et al. 2006). This is the first microar-ray analysis of gene expression profile among life cycle stages that focuses on non-protein-coding genes in S. mansoni.
We analyzed two biological replica samples of each developmental stage; 3 ug amplified RNA (Wang et al. 2000) was labeled with Cy3 or Cy5 and hybridize to the arrays essentially as previously described (Demar-co et al. 2006). The (Demar-combination of samples on an array was: eggsvs.miracidia; cercariaevs.7-day-old schisto-somula and 7-day-old schistoschisto-somula vs. adult worms. We used a dye-swap approach to correct for any bias caused by dye incorporation or by intrinsic differential fluorescence yield of the dyes (Demarco et al. 2006). Raw data of this experiment is deposited in GEO under accession number GSE27026.
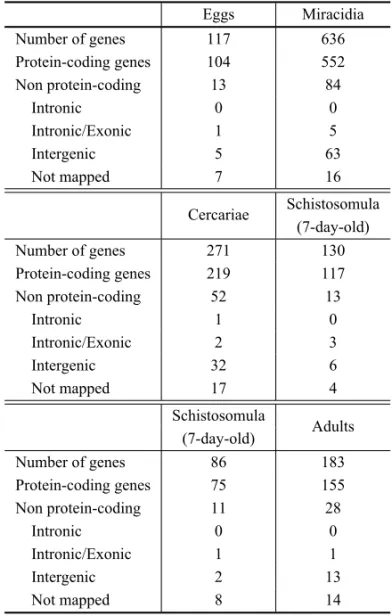
We used two different analyses approaches. In the first approach we identified differentially expressed genes between two consecutive developmental stages (eggs vs. miracidia; cercariae vs. 7-day-old schistoso-mula and 7-day-old schistososchistoso-mulavs.adult worms) us-ing SAM (Significance Analysis of Microarray) soft-ware (Tusher et al. 2001). Overall, we were able to find 1,423 differentially expressed genes between two devel-opmental stages among all previously indicated compar-isons (Table II). A detailed description follows below.
In the second approach we identified genes with increased expression levels in at least one developmen-tal stage (for example more highly expressed in cer-cariae than in all other stages) using ANOVA statisti-cal test (Churchill 2004) corrected for multiple sampling
TABLE II
Number of differentially expressed genes in the comparison of two sequential stages (FDR<0.001).
Eggs Miracidia
Number of genes 117 636
Protein-coding genes 104 552
Non protein-coding 13 84
Intronic 0 0
Intronic/Exonic 1 5
Intergenic 5 63
Not mapped 7 16
Cercariae Schistosomula (7-day-old)
Number of genes 271 130
Protein-coding genes 219 117
Non protein-coding 52 13
Intronic 1 0
Intronic/Exonic 2 3
Intergenic 32 6
Not mapped 17 4
Schistosomula
Adults (7-day-old)
Number of genes 86 183
Protein-coding genes 75 155
Non protein-coding 11 28
Intronic 0 0
Intronic/Exonic 1 1
Intergenic 2 13
Not mapped 8 14
using Bonferroni correction (Shaffer 1995). Overall, with this approach we identified 577 differentially ex-pressed genes with increased expression in at least one specific stage (Table III). A description of affected genes for each stage is given below.
TABLE III
Number of genes with enriched expression in one developmental stage (Bonferroni
adjusted p-value<0.005).
Genes with enriched expression in one stage
Number of genes 577
Protein-coding genes 473 Non protein-coding genes 104
Intronic 1
Intronic/Exonic 6
Intergenic 61
In general, all observed patterns of expression of protein-coding genes among life cycle stages that will be described here, are not inconsistent with the previ-ously published microarray results (Dillon et al. 2006, Jolly et al. 2007, Fitzpatrick et al. 2009, Gobert et al. 2009). Here we would like to especially highlight the non-coding genes that were never the focus of study before.
Differentially expressed non-coding genes identi-fied here were mapped to the genome (using SchistoDB, available at http://schistodb.net/schistodb20/) and anno-tated as mapping to Intronic, Intronic/Exonic, Intergenic regions or as “Not mapped” (in case of multiple hits or no hit to the genome) (Tables II and III). These non-coding genes were re-confirmed as having no protein-coding potential by using the CPC tool (Kong et al. 2007). In addition, some previously annotated non-cod-ing genes were now mapped to exons of predicted genes; they received an Smp re-annotation and were no longer counted as non-coding.
We are not able to assign a genomic strand for the observed expression of non-coding genes, since the probes on the 4k-microarray platform were generated by PCR amplification of selected double-stranded cDNA clones from the S. mansoni EST sequencing project (Verjovski-Almeida et al. 2003). These probes detect expression on either strand of a given locus.
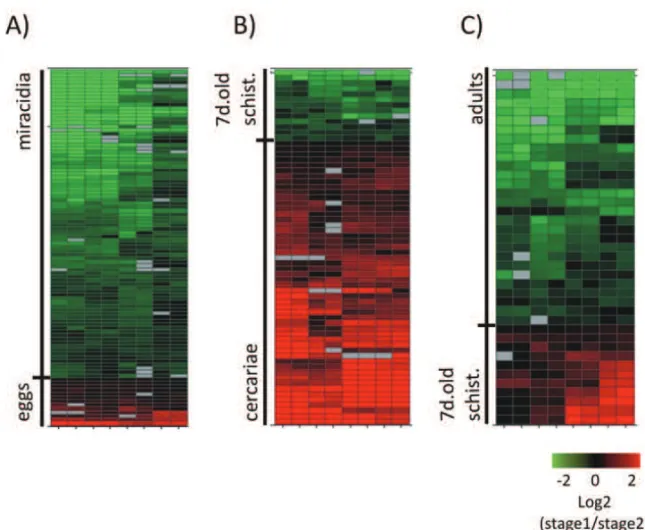
Using the first analysis approach described above, we were able to find a set of 753 differentially expressed genes between eggs and miracidia; out of them, 117 genes with higher expression in egg and 636 genes with the opposite pattern. The complete list of differentially expressed genes between eggs and miracidia are avail-able in Supplementary Tavail-able V (Part A). Among the 753 genes, there were 656 protein-coding genes (104 genes in eggs and 552 in miracidia); we highlight that there was significant enrichment (according to Gene Ontol-ogy analysis) of genes involved in amino acid and RNA metabolism in miracidia. The GO results are summa-rized in Supplementary Table V (Part B). We observed a set of 97 non-coding genes; 13 with higher expres-sion in eggs and 84 with higher expresexpres-sion in miracidia (Table II). The non-coding expression profile is repre-sented in Figure 4A. Description of genomic mapping coordinates is available in the supplementary material.
In the comparison between cercariae and 7-day-old schistosomula we found 401 differentially expressed genes; 271 in cercariae and 130 in schistosomula (Table II). From the 271 with higher expression in cercariae, 219 are protein-coding genes, and 52 are non-coding genes. Here, it is interesting to note the expression of a message that maps to the intronic region of the Smp_15-4340 gene, annotated as “nuclear factor Y transcription factor subunit B homolog, putative”. This gene has three isoforms, and the intronic transcript could eventually act incismodulating the splicing pattern of this transcript.
From the 130 genes with higher expression in 7-day-old schistosomula, 117 genes are protein-coding genes and 13 are non-protein coding (Table II). Figure 4B il-lustrates this profile. The list of all differentially ex-pressed genes between cercariae and schistosomula is in Supplementary Table V (Part C). In this compari-son we have found enriched GO categories both in cer-cariae and schistosomula; they are listed in Supplemen-tary Table V (Part D and E), respectively.
In the third comparison, 7-day-old schistosomula
vs. adults, we found 269 differentially expressed genes, 86 in schistosomula and 183 in adult worms. From the 86 genes with higher expression in schistosomula, 75 are protein-coding genes and 11 non-coding genes. In the opposite scenario, comprising the group of genes with higher expression in adult we have 155 protein-coding genes and 28 non-protein-coding genes. This non-protein-coding expression profile is represented in Figure 4C. No en-riched GO categories were found among the protein-coding genes. The list of all differentially expressed genes is in Supplementary Table V (Part F).
Here we point to a set of non-coding genes that may be involved in molecular mechanisms of transformation that occur in each step ofS. mansonidevelopment.
Fig. 4 – Heat map of differential expression of non-protein coding genes between two developmental stages.A)eggsvs.miracidia;B)cercariae vs. 7-day-old schistosomula;C)7-day-old schistosomulavs. adult worms. Each line represents a gene and each column represents a replica (4 technical replicas for each one of two biological replicas). Color is proportional to expression levels of the gene in a given stage compared to the next, according to the range indicated in the figure insert, and it is calculated as the log2 of the expression ratio in stage 1 (first in the pairwise comparison)/stage 2 (second in the pairwise comparison).
intron of Smp_014290; the Smp_014290 protein-coding gene has 3 alternatively spliced isoforms and it is possi-ble that the non-coding RNA transcribed from its intron eventually acts in alternative splicing modulation; to con-firm this hypothesis further studies are necessary.
The signature of stage-enriched expression com-prises a new set of transcripts that should receive special attention in the future. This set reveals new molecular targets of specific mechanisms involved in the biology of each stage that should be explored to understand the parasite complexity.
FINAL CONSIDERATIONS / PERSPECTIVES
This is the first review on non-coding RNAs in schis-tosomes in the literature. Very limited knowledge about schistosomes non-coding RNAs is available. A large further effort using deep-sequencing and tilling array
approaches is necessary to finish the genome, to increase the amount of transcriptome data and to identify new non-coding RNAs, especially in S. mansoni that until now has been less studied than S. japonicumwith the non-coding perspective.
Extending genome and transcriptome deep se-quencing to invertebrate species other than theC. ele-gans andD. melanogastermodel organisms may help to identify the classes of ncRNAs in the ancient species. In addition, functional studies are necessary to clarify the mechanisms involved in regulation of these ncRNA and their role in protein-coding gene expression regula-tion. Because of the peculiarities of schistosomes and the current limited ability to obtain transgenic parasites, characterization of the molecular mechanisms of ncRNA function in schistosomes will be a big challenge.
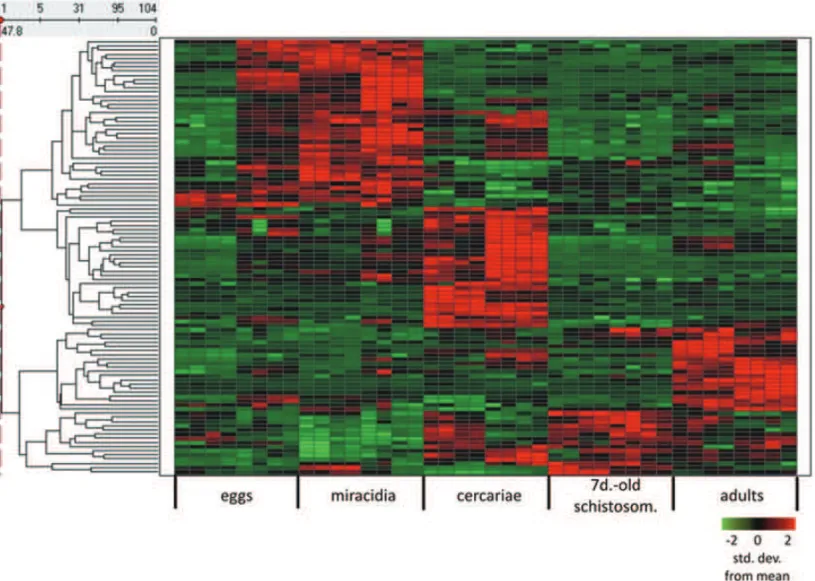
bio-Fig. 5 – Heat map of differential expression of non-protein coding genes among 5 developmental stages. Each line represents a gene and each column represents a replica (4 technical replicas for each one of two biological replicas). Color is proportional to expression levels of the gene in a given stage, according to the range shown in the figure insert, and indicates the number of standard deviations below (green) or above (red) the average expression of that gene across all stages.
logical situations: adult parasites, parasite response to TNF-α host molecule and parasite life cycle stages. These data collections are important evidence of func-tionality of these non-coding RNAs, and a detailed fur-ther characterization of the mechanisms of action is needed. Understanding of the non-coding genes as new players in the biology of schistosomes will shed light on the complexity of processes involved in host-parasite interaction and parasite development.
ACKNOWLEDGMENTS
Funded in part by grants from Fundação de Amparo à Pesquisa do Estado de São Paulo (FAPESP), from Con-selho Nacional de Desenvolvimento Científico e Tec-nológico (CNPq) and from the SEtTReND grant agree-ment number 241865 of the FP-7 European Community.
KCO and VMC received fellowships from FAPESP; MLPC received a fellowship from CAPES-Brasil, and SVA received an established investigator fellowship award from CNPq.
SUPPLEMENTARY MATERIALS
All supplementary materials are available for down-load from the following site:
http://www2.iq.usp.br/docente/verjo/downloads/oliveira_kc/2011/
RESUMO
ação que essencialmente compreendem uma sofisticada rede de regulação de expressão gênica. A publicação recente dos genomas e transcritomas dos esquistossomos aumentou a des-crição e caracterização de um grande número de genes do pa-rasita. Aqui nós revisamos o número de genes preditos e a cobertura das bases do genoma em face dos ESTs públicos disponíveis, incluindo uma avaliação crítica da evidência e ca-racterização de ncRNAs em esquistossomos. Nós mostramos dados de expressão de ncRNAs emSchistosoma mansoni. Nós analisamos três conjuntos diferentes de dados de experimentos com microarranjos: (1) medidas de expressão em larga es-cala de vermes adultos; (2) genes diferencialmente expressos deS. mansoniregulados por uma citocina humana (TNF-α)
no parasita em cultura; e (3) expressão estágio-especifica de ncRNAs. Todos estes dados apontam para ncRNAs envolvi-dos em diferentes processos biológicos e respostas fisiológi-cas que sugerem funcionalidade destes novos personagens na biologia do parasita. Explorar este mundo é um desafio para os cientistas sob uma nova perspectiva molecular da interação parasita-hospedeiro e do desenvolvimento do parasita.
Palavras-chave: Schistosoma mansoni, RNAs não-codifica-dores, perfil de expressão gênica, genoma, transcritoma.
REFERENCES
AGBOHKC, WEBBTE, EVANSRJANDENNIONSJ. 2004. Functional characterization of a P2X receptor from Schistosoma mansoni. J Biol Chem 279: 41650–41657. AMIRI P, LOCKSLEY RM, PARSLOW TG, SADICK M,
RECTOR E, RITTER D AND MCKERROW JH. 1992. Tumour necrosis factor alpha restores granulomas and induces parasite egg-laying in schistosome-infected SCID mice. Nature 356: 604–607.
BARTEL DP. 2004. MicroRNAs: Genomics, biogenesis, mechanism, and function. Cell 116: 281–297.
BECKMANNS, BUROC, DISSOUS C, HIRZMANN JAND
GREVELDING CG. 2010. The Syk kinase SmTK4 of Schistosoma mansoniis involved in the regulation of sper-matogenesis and oogenesis. PLoS Pathog 6: e1000769.
BEGUNDJET AL. 2007. Population genomics: whole-gen-ome analysis of polymorphism and divergence in Droso-phila simulans. PLoS Biol 5: e310.
BERRIMANMET AL. 2009. The genome of the blood fluke Schistosoma mansoni. Nature 460: 352–358.
BIRNEYEET AL. 2007. Identification and analysis of func-tional elements in 1% of the human genome by the ENCODE pilot project. Nature 447: 799–816.
BOYLEJP, WUXJ, SHOEMAKERCBANDYOSHINOTP. 2003. Using RNA interference to manipulate endogenous gene expression inSchistosoma mansonisporocysts. Mol Biochem Parasitol 128: 205–215.
BRITO GC, FACHEL AA, VETTORE AL, VIGNAL GM, GIMBA ER, CAMPOS FS, BARCINSKI MA, VER
-JOVSKI-ALMEIDASANDREISEM. 2008. Identification of protein-coding and intronic noncoding RNAs down-regulated in clear cell renal carcinoma. Mol Carcinog 47: 757–767.
BROSNANCA ANDVOINNETO. 2009. The long and the short of noncoding RNAs. Curr Opin Cell Biol 21: 416– 425.
CARNINCI P ET AL. 2003. Targeting a complex transcrip-tome: the construction of the mouse full-length cDNA encyclopedia. Genome Res 13: 1273–1289.
CAWLEYSET AL. 2004. Unbiased Mapping of Transcription Factor Binding Sites along Human Chromosomes 21 and 22 Points to Widespread Regulation of Noncoding RNAs. Cell 116: 499–509.
CHALMERSIW, MCARDLEAJ, COULSONRM, WAGNER
MA, SCHMID R, HIRAI H AND HOFFMANN KF. 2008. Developmentally regulated expression, alternative splicing and distinct sub-groupings in members of the Schistosoma mansonivenom allergen-like (SmVAL) gene family. BMC genomics 9: 89.
CHEND, FARWELLMAANDZHANGB. 2010a. MicroRNA as a new player in the cell cycle. J Cell Physiol 225: 296– 301.
CHEN J, YANG Y, GUO S, PENG J, LIU Z, LI J, LIN J
ANDCHENGG. 2010b. Molecular cloning and expres-sion profiles of Argonaute proteins inSchistosoma japo-nicum. Parasitol Res 107: 889–899.
CHEN L-L ANDCARMICHAEL GG. 2010. Long noncod-ing RNAs in mammalian cells: what, where, and why? WIREs RNA 1: 19.
CHENGGF, LINJJ, SHIY, JINYX, FUZQ, JINYM, ZHOU
YCANDCAIYM. 2005. Dose-dependent inhibition of gynecophoral canal protein gene expressionin vitroin the schistosome (Schistosoma japonicum) by RNA interfer-ence. Acta Biochim Biophys Sin (Shanghai) 37: 386–390. CHURCH DM ET AL. 2009. Lineage-specific biology re-vealed by a finished genome assembly of the mouse. PLoS Biol 7: e1000112.
CHURCHILL GA. 2004. Using ANOVA to analyze micro-array data. Biotechniques 37: 173–175, 177.
COPELAND CS, MARZ M, ROSE D, HERTEL J, BRIND
-LEY PJ, SANTANA CB, KEHR S, ATTOLINI CS AND
STADLERPF. 2009. Homology-based annotation of non-coding RNAs in the genomes of Schistosoma mansoni andSchistosoma japonicum. BMC Genomics 10: 464.
CORELJ, WATERFALLJJANDLISJT. 2008. Nascent RNA sequencing reveals widespread pausing and divergent ini-tiation at human promoters. Science 322: 1845–1848. CORRENTI JM, BRINDLEY PJ AND PEARCE EJ. 2005.
Long-term suppression of cathepsin B levels by RNA interference retards schistosome growth. Mol Biochem Parasitol 143: 209–215.
COSTA FF. 2010. Non-coding RNAs: Meet thy masters. Bioessays 32: 599–608.
DAHARYD, ELROY-STEINOANDSOREKR. 2005. Natu-rally occurring antisense: transcriptional leakage or real overlap? Genome Res 15: 364–368.
DAVIESSJ, GROGANJL, BLANKRB, LIMKC, LOCKSLEY
RMANDMCKERROWJH. 2001. Modulation of blood fluke development in the liver by hepatic CD4+ lympho-cytes. Science 294: 1358–1361.
DELUCIAFANDDEANC. 2010. Long non-coding RNAs and chromatin regulation. Curr Opin Plant Biol 14: 168– 173.
DEMENDONCARL, ESCRIVAH, BOUTOND, LAUDETV
AND PIERCERJ. 2000. Hormones and nuclear recep-tors in schistosome development. Parasitol Today 16: 233–240.
DELCROIXM, SAJIDM, CAFFREYCR, LIMKC, DVORAK
J, HSIEHI, BAHGATM, DISSOUSCANDMCKERROW
JH. 2006. A multienzyme network functions in intestinal protein digestion by a platyhelminth parasite. J Biol Chem 281: 39316–39329.
DEMARCOR, MATHIESONW, MANUELSJ, DILLONGP, CURWENRS, ASHTONPD, IVENSAC, BERRIMANM, VERJOVSKI-ALMEIDASANDWILSONRA. 2010. Pro-tein variation in blood-dwelling schistosome worms gen-erated by differential splicing of micro-exon gene tran-scripts. Genome Res 20: 1112–1121.
DEMARCOR, OLIVEIRAKC, VENANCIO TMANDVER
-JOVSKI-ALMEIDA S. 2006. Gender biased differential alternative splicing patterns of the transcriptional cofac-tor CA150 gene inSchistosoma mansoni. Mol Biochem Parasitol 150: 123–131.
DILLON GP, FELTWELL T, SKELTON JP, ASHTON
PD, COULSONPS, QUAILMA, NIKOLAIDOU-KATSA
-RIDOUN, WILSONRAANDIVENSAC. 2006.
Micro-array analysis identifies genes preferentially expressed in the lung schistosomulum ofSchistosoma mansoni. Int J Parasitol 36: 1–8.
DINDOT SV, PERSON R, STRIVENS M, GARCIA R AND
BEAUDETAL. 2009. Epigenetic profiling at mouse im-printed gene clusters reveals novel epigenetic and genetic features at differentially methylated regions. Genome Res 19: 1374–1383.
DINGER ME, AMARAL PP, MERCER TR ANDMATTICK
JS. 2009. Pervasive transcription of the eukaryotic genome: functional indices and conceptual implications. Brief Funct Genomic Proteomic 8: 407–423.
DINGUIRARDNANDYOSHINOTP. 2006. Potential role of a CD36-like class B scavenger receptor in the binding of modified low-density lipoprotein (acLDL) to the tegu-mental surface ofSchistosoma mansonisporocysts. Mol Biochem Parasitol 146: 219–230.
ESCOBEDO G, ROBERTSCW, CARREROJC ANDMORA
-LES-MONTOR J. 2005. Parasite regulation by host hor-mones: an old mechanism of host exploitation? Trends Parasitol 21: 588–593.
FAGHIRI ZANDSKELLYPJ. 2009. The role of tegumental aquaporin from the human parasitic worm,Schistosoma mansoni, in osmoregulation and drug uptake. FASEB J 23: 2780–2789.
FERBEYREG, SMITHJMANDCEDERGRENR. 1998. Schis-tosome satellite DNA encodes active hammerhead ribo-zymes. Mol Cell Biol 18: 3880–3888.
FITZPATRICK JM, PEAK E, PERALLYS, CHALMERSIW, BARRETTJ, YOSHINOTP, IVENSACANDHOFFMANN
KF. 2009. Anti-schistosomal intervention targets identi-fied by lifecycle transcriptomic analyses. PLoS Negl Trop Dis 3: e543.
FRANCO GR, ADAMS MD, SOARESMB, SIMPSON AJ, VENTERJCANDPENASD. 1995. Identification of new Schistosoma mansonigenes by the EST strategy using a directional cDNA library. Gene 152: 141–147.
FRANCO GR, VALADAOAF, AZEVEDO V ANDRABELO
EM. 2000. The Schistosoma gene discovery program: state of the art. Int J Parasitol 30: 453–463.
FREITAS TC, JUNGE ANDPEARCE EJ. 2007. TGF-beta signaling controls embryo development in the parasitic flatwormSchistosoma mansoni. PLoS Pathog 3: e52. GERSTEIN MB, BRUCE C, ROZOWSKY JS, ZHENG D,
GERSTEIN MB ET AL. 2010. Integrative analysis of the Caenorhabditis elegans genome by the modENCODE project. Science 330: 1775–1787.
GOBERTGN, MOERTELL, BRINDLEYPJANDMCMANUS
DP. 2009. Developmental gene expression profiles of the human pathogen Schistosoma japonicum. BMC Genomics 10: 128.
GOLDENDE, GERBASI VRANDSONTHEIMEREJ. 2008. An inside job for siRNAs. Mol Cell 31: 309–312.
GOMES MS, CABRAL FJ, JANNOTTI-PASSOS LK, CAR
-VALHO O, RODRIGUES V, BABA EH AND SA RG. 2009. Preliminary analysis of miRNA pathway in Schis-tosoma mansoni. Parasitol Int 58: 61–68.
GRAVELEYBRET AL. 2010. The developmental transcrip-tome ofDrosophila melanogaster. Nature 471: 473–479.
GRYSEELSB, POLMAN K, CLERINX JANDKESTENSL. 2006. Human schistosomiasis. Lancet 368: 1106–1118.
GUTTMANMET AL. 2009. Chromatin signature reveals over a thousand highly conserved large non-coding RNAs in mammals. Nature 458: 223–227.
HANZG, BRINDLEYPJ, WANGSYANDCHEN Z. 2009. Schistosoma genomics: new perspectives on schisto-some biology and host-parasite interaction. Annu Rev Genomics Hum Genet 10: 211–240.
HAO L, CAI P, JIANG N, WANG HANDCHEN Q. 2010. Identification and characterization of microRNAs and endogenous siRNAs in Schistosoma japonicum. BMC Genomics 11: 55.
HUANG J, HAOP, CHEN H, HU W, YANQ, LIUF AND
HAN ZG. 2009. Genome-wide identification of Schis-tosoma japonicummicroRNAs using a deep-sequencing approach. PLoS One 4: e8206.
HUWET AL. 2003. Evolutionary and biomedical implica-tions of aSchistosoma japonicumcomplementary DNA resource. Nat Genet 35: 139–147.
HUTTENHOFER A, SCHATTNER P AND POLACEK N. 2005. Non-coding RNAs: hope or hype? Trends Genet 21: 289–297.
JOHNSONJM, EDWARDSS, SHOEMAKERDANDSCHADT
EE. 2005. Dark matter in the genome: evidence of wide-spread transcription detected by microarray tiling experi-ments. Trends Genet 21: 93–102.
JOLLYER, CHINCS, MILLERS, BAHGATMM, LIMKC, DERISIJANDMCKERROWJH. 2007. Gene expression patterns during adaptation of a helminth parasite to differ-ent environmdiffer-ental niches. Genome Biol 8: R65.
KAPRANOV P ET AL. 2007. RNA maps reveal new RNA classes and a possible function for pervasive transcription. Science 316: 1484–1488.
KAULS ET AL. 2000. Analysis of the genome sequence of the flowering plant Arabidopsis thaliana. Nature 408: 796–815.
KEELINGPJANDSLAMOVITSCH. 2005. Causes and effects of nuclear genome reduction. Curr Opin Genet Dev 15: 601–608.
KHAYATHN, VICOGNEJ, AHIERA, BENYOUNESA, KON
-RAD C, TROLET J, VISCOGLIOSI E, BREHM K AND
DISSOUS C. 2007. Diversification of the insulin recep-tor family in the helminth parasiteSchistosoma mansoni. Febs J 274: 659–676.
KIYOSAWA H, MISE N, IWASE S, HAYASHIZAKIY AND
ABEK. 2005. Disclosing hidden transcripts: mouse nat-ural sense-antisense transcripts tend to be poly(A) negat-ive and nuclear localized. Genome Res 15: 463–474.
KONGL, ZHANGY, YEZQ, LIUXQ, ZHAOSQ, WEIL
ANDGAOG. 2007. CPC: assess the protein-coding po-tential of transcripts using sequence features and support vector machine. Nucleic Acids Res 35: W345–349.
KRAUTZ-PETERSONG, BHARDWAJR, FAGHIRIZ, TARA
-RAMCAANDSKELLYPJ. 2010. RNA interference in schistosomes: machinery and methodology. Parasitology 137: 485–495.
KRAUTZ-PETERSON G, RADWANSKA M, NDEGWA D, SHOEMAKER CB AND SKELLY PJ. 2007. Optimizing gene suppression in schistosomes using RNA interference. Mol Biochem Parasitol 153: 194–202.
KRAUTZ-PETERSON GANDSKELLY PJ. 2008a. Schisto-soma mansoni: the dicer gene and its expression. Exp Parasitol 118: 122–128.
KRAUTZ-PETERSON GAND SKELLYPJ. 2008b. Schisto-some asparaginyl endopeptidase (legumain) is not essen-tial for cathepsin B1 activation in vivo. Mol Biochem Parasitol 159: 54–58.
KUMAGAIT, OSADAY, OHTANANDKANAZAWAT. 2009. Peroxiredoxin-1 fromSchistosoma japonicum functions as a scavenger against hydrogen peroxide but not nitric oxide. Mol Biochem Parasitol 164: 26–31.
KUMARM, MABALIRAJANU, AGRAWALAANDGHOSH
B. 2010. Proinflammatory role of let-7 miRNAs in ex-perimental asthma? J Biol Chem 285: le19: author reply le20.
LIN, MUTHUSAMYS, LIANGR, SAROJINIHANDWANG
in rat liver during aging; and their impact on the expres-sion of Mgst1 and Sirt1. Mech Ageing Dev 132: 75–85.
LOURO R, NAKAYA HI, AMARAL PP, FESTA F, SOGA
-YARMC,DASILVAAM, VERJOVSKI-ALMEIDASAND
REISEM. 2007. Androgen responsive intronic non-cod-ing RNAs. BMC biology 5: 4.
LOURO R, SMIRNOVA AS ANDVERJOVSKI-ALMEIDAS. 2009. Long intronic noncoding RNA transcription: ex-pression noise or exex-pression choice? Genomics 93: 291– 298.
LUO R, XUE X, WANG Z, SUN J, ZOU Y ANDPAN W. 2010. Analysis and characterization of the genes encod-ing the Dicer and Argonaute proteins of Schistosoma japonicum. Parasit Vectors 3: 90.
MATTICKJS. 2003. Challenging the dogma: the hidden layer of non-protein-coding RNAs in complex organisms. Bio-essays 25: 930–939.
MATTICKJS. 2004. RNA regulation: a new genetics? Nat Rev Genet 5: 316–323.
MATTICK JS. 2009. The genetic signatures of noncoding RNAs. PLoS Genet 5: e1000459.
MERCERTR, DINGERMEANDMATTICKJS. 2009. Long non-coding RNAs: insights into functions. Nat Rev Genet 10: 155–159.
MERRICK JM, OSMAN A, TSAI J, QUACKENBUSH
J, LOVERDEPTANDLEENH. 2003. TheSchistosoma mansonigene index: gene discovery and biology by re-construction and analysis of expressed gene sequences. J Parasitol 89: 261–269.
MORALESME, RINALDIG, GOBERTGN, KINESKJ, TORT
JF AND BRINDLEY PJ. 2008. RNA interference of Schistosoma mansonicathepsin D, the apical enzyme of the hemoglobin proteolysis cascade. Mol Biochem Para-sitol 157: 160–168.
MORTAZAVI A, WILLIAMSBA, MCCUE K, SCHAEFFER
LANDWOLDB. 2008. Mapping and quantifying mam-malian transcriptomes by RNA-Seq. Nat Methods 5: 621–628.
NAGAANDJACKT. 2010. Sculpting the flower; the role of microRNAs in flower development. Curr Top Dev Biol 91: 349–378.
NAKAYAHI, AMARALPP, LOUROR, LOPES A, FACHEL
AA, MOREIRA YB, EL-JUNDI TA, DA SILVA AM, REISEMANDVERJOVSKI-ALMEIDAS. 2007. Genome mapping and expression analyses of human intronic non-coding RNAs reveal tissue-specific patterns and enrich-ment in genes related to regulation of transcription. Ge-nome Biol 8: R43.
NANA-SINKAMSP, KARSIEST, RISCILIB, EZZIEMAND
PIPERM. 2009. Lung microRNA: from development to disease. Expert Rev Respir Med 3: 373–385.
NDEGWAD, KRAUTZ-PETERSONGANDSKELLYPJ. 2007. Protocols for gene silencing in schistosomes. Exp Para-sitol 117: 284–291.
OLIVEIRA KC, CARVALHO ML, VENANCIO TM, MIYA
-SATOPA, KAWANOT, DEMARCORANDVERJOVSKI -ALMEIDA S. 2009. Identification of the Schistosoma mansoniTNF-alpha receptor gene and the effect of hu-man TNF-alpha on the parasite gene expression profile. PLoS Negl Trop Dis 3: e556.
OLIVERHF, ORSIRH, PONNALAL, KEICHU, WANGW, SUNQ, CARTINHOUR SW, FILIATRAULT MJ, WIED
-MANNMANDBOORKJ. 2009. Deep RNA sequencing of L. monocytogenes reveals overlapping and extensive stationary phase and sigma B-dependent transcriptomes, including multiple highly transcribed noncoding RNAs. BMC Genomics 10: 641.
OSMANA, NILESEG, VERJOVSKI-ALMEIDASANDLO
-VERDE PT. 2006. Schistosoma mansoni TGF-beta re-ceptor II: role in host ligand-induced regulation of a schistosome target gene. PLoS Pathog 2: e54.
PEREIRATC, PASCOALVD, MARCHESINIRB, MAIAIG, MAGALHAES LA, ZANOTTI-MAGALHAES EM AND
LOPES-CENDES I. 2008. Schistosoma mansoni: eval-uation of an RNAi-based treatment targeting HGPRTase gene. Exp Parasitol 118: 619–623.
PRATTAJANDMACRAEIJ. 2009. The RNA-induced si-lencing complex: a versatile gene-sisi-lencing machine. J Biol Chem 284: 17897–17901.
REARICKD, PRAKASH A, MCSWEENY A, SHEPARDSS, FEDOROVA L ANDFEDOROV A. 2010. Critical asso-ciation of ncRNA with introns. Nucleic Acids Res 39: 2357–2366.
REIS EM, LOUROR, NAKAYA HIAND VERJOVSKI-AL
-MEIDAS. 2005. As antisense RNA gets intronic. Omics 9: 2–12.
REISEMET AL. 2004. Antisense intronic non-coding RNA levels correlate to the degree of tumor differentiation in prostate cancer. Oncogene 23: 6684–6692.
RINALDIG, MORALESME, ALREFAEIYN, CANCELAM, CASTILLO E, DALTON JP, TORT JF AND BRINDLEY
PJ. 2009. RNA interference targeting leucine amino-peptidase blocks hatching ofSchistosoma mansonieggs. Mol Biochem Parasitol 167: 118–126.