http://periodicos.uem.br/ojs/acta ISSN on-line: 1807-8621
Doi: 10.4025/actasciagron.v40i1.35216 CROP PRODUCTION
Acta Scientiarum. Agronomy, v. 40, e35216, 2018
Gherkin cultivation in saline medium using seeds treated with a
biostimulant
Maria Lilia de Souza Neta, Francisco de Assis de Oliveira, Salvador Barros Torres*, Antonia Adailha Torres Souza, Dennis Darkyan Almeida da Silva and Sandy Thomaz dos Santos
Centro de Ciências Agrárias, Universidade Federal Rural do Semi-Árido, Av. Francisco Mota, 572, 59625-900, Mossoró, Rio Grande do Norte, Brazil. *Author for correspondence. E-mail: [email protected]
ABSTRACT. The objective of this study was to evaluate the effects of a biostimulant on gherkin seeds, cultivar Liso de Calcutá, under conditions of salt stress. A split-plot experimental design with five replications was used; the main plot was represented by two levels of irrigation water salinity (0.5 and 3.5
dS m-1), and the subplot was composed of five biostimulant doses applied as a seed treatment (0, 5, 10, 15,
and 20 mL kg-1). The following variables were evaluated: the number of leaves; number of branches; length
of the largest branch; leaf, stem, fruit and total dry matter; number of fruits; average fruit weight; and fruit production. The values of all analyzed variables decreased with an increase in irrigation water salinity regardless of the biostimulant dose, but in the absence of salt stress, biostimulant use led to an increase in the number of leaves and branches, the length of the largest branch and biomass accumulation. Biostimulation was not effective in reducing the effects of salinity on gherkin production, but it increased fruit production regardless of the salinity level.
Keywords:Cucumis anguria, horticulture, salt stress, bioregulator.
Cultivo de maxixeiro em meio salino a partir de sementes tratadas com bioestimulante
RESUMO. Objetivou-se avaliar o efeito da aplicação do bioestimulante em sementes de maxixeiro, cultivar Liso de Calcutá, em condições de estresse salino. Utilizou-se o delineamento experimental em parcelas subdivididas, a parcela principal representada por dois níveis de salinidade da água de irrigação (0,5
e 3,5 dS m-1) e a subparcela composta por cinco doses de bioestimulante aplicados via tratamento de
sementes (0, 5, 10, 15 e 20 mL kg-1), em cinco repetições. Avaliaram-se as seguintes variáveis: número de
folhas, número de ramos, comprimento do maior ramo, massa seca de folhas, caule, frutos e total, número de frutos, massa média de frutos e produção de frutos. A salinidade da água de irrigação reduziu todas as variáveis analisadas, independente da dose de bioestimulante; o uso de bioestimulante, na ausência do estresse salino, proporcionou aumento do número de folhas, ramos, comprimento do maior ramo e do acúmulo de biomassa. O bioestimulante não é eficiente para reduzir o efeito da salinidade sobre a produção de maxixeiro, mas aumentou a produção de frutos, independente da salinidade.
Palavras-chave:Cucumis anguria, olericultura, estresse salino, biorregulador.
Introduction
The gherkin (Cucumis anguria L.) belongs to the
Cucurbitaceae family and produces fruits that are highly appreciated in the cuisine of Brazil, especially in the Northeast Region. It is an annual and monoecious plant with an indeterminate and prostrate growth habit, lobed leaves and fruits that are highly variable in shape and in the presence or absence of spicules (Modolo & Costa, 2003).
However, the gherkin is still considered a secondary culture (Oliveira et al., 2014a), and according to Oliveira et al. (2008), it is common to find gherkin plants growing subspontaneously among other crops whose production meets the demands for domestic consumption and
international markets.
One of the main technologies that is applied to ensure satisfactory results in the cultivation of agricultural products is irrigation. However, in addition to the volume of water made available to plants, another crucial factor is water quality, especially in terms of the concentration of dissolved salts (Oliveira et al., 2014b).
Page 2 of 10 Souza Neta et al.
Several studies have been conducted to evaluate the effects of salinity on plant growth and yield, particularly in species of agronomic interest. In most cases, the results have shown deleterious effects of salinity on the growth and yield of plants, e.g., cucurbits such as pumpkin (Carmo et al., 2011) and zucchini (Strassburger, Peil, Fonseca, Aumonde, & Mauch, 2011).
With respect to gherkin, there have been few studies on the stages of germination and early seedling development. Oliveira et al. (2014b) found that an increase in the salinity of irrigation water caused a significant decrease in plant growth and yield.
In these studies, the results have indicated that gherkin is sensitive to salinity, highlighting the need to adopt technologies that mitigate the problem of salinity to promote better plant growth.
The use of synthetic biostimulants may be an alternative because such substances increase crop growth and development by stimulating cell division and increasing the absorption of water and nutrients by plants (Vieira & Castro, 2002).
Stimulate®, a product considered to be a plant
growth promoter, is partially composed of phytohormones that act to mediate physiological processes (Garcia, Gazola, Merlin, Villas Boas, & Crusciol, 2009). In the literature, the use of this biostimulant has been reported to have several positive results on the growth and yield of crops, but most of the research has focused on grains and cereals (Garcia et al., 2009; Oliveira et al., 2015).
The use of Stimulate® in vegetable production,
especially vegetable-fruit crops, has been poorly studied, but examples include research conducted by Palangana, Silva, Goto, and Ono (2012) on chili and cucumber, respectively. The results showed
beneficial effects from the application of this biostimulant on the number of fruits, the amount of fresh matter and productivity.
Thus, the present study aimed to evaluate the effects of applying this biostimulant to gherkin seeds, cultivar Liso de Calcutá, and growing them under conditions of salt stress.
Material and methods
The experiment was conducted from October 2014 to January 2015 at the experimental area of the Department of Environmental Sciences and Technology of the Federal Rural University of the Semi-Árido (UFERSA), Mossoró, Rio Grande do Norte State, Brazil (5°12'02" S, 37°19'37" W; altitude 18 m).
The climate, according to the Köppen classification, is BSwh, hot and dry; the average annual rainfall is 673.9 mm, which is distributed from February to June with a very low probability of rainfall between August and December. The temperature and the average relative humidity are 27°C and 68.9%, respectively (Carmo Filho & Oliveira, 1995).
Climatic data during the experimental period are shown in Figure 1 and. Although the experiment was developed in the open, rainfall during the study had little effect on the results since even the highest rainfall volume (8 mm) represented only a small fraction of the rainfall that may have accumulated in each pot.
Material from a soil classified as eutrophic Red-Yellow Argisol with cattle manure (10% base volume) was used as the substrate. The soil characteristics are shown in Table 1.
Figure 1. Maximum, average and minimum temperatures (A) and maximum, average and minimum humidity values (B) during the experimental period.
0 5 10 15 20 25 30 35
T
e
mp
er
at
u
re (
ºC
)
Experimental period
A. Tmin Tmax Tmed
0 10 20 30 40 50 60 70 80 90
R
e
la
ti
ve
hum
id
it
(
%
)
Experimental period
Acta Scientiarum. Agronomy, v. 40, e35216, 2018 Table 1. Chemical characteristics of the soil used in the experiment.
pH EC P K+
Na+ Ca2+
Mg2+ Al3+
(H+Al) SB T CTC V M PST
dS m-1 ----mg dm-3 ---- --- cmol c dm
-3 --- --- % --- 6.18 0.06 5.23 44.52 8.61 1.62 1.88 0.0 1.32 3.65 3.65 4.97 73 0.0 1.0
*pH, in water, ratio 1:2.5, N = total nitrogen obtained by the sum of N-NO3- and N-NH4+ contents, OM = organic matter, P, K and Na extracted using Mehlich-1, N, Ca, Mg, Al and M extracted using KCl 1N.
A split-plot experiment design was used in which the main plot was represented by two levels of
irrigation water salinity (0.5 and 3.5 dS m-1), and the
subplot included five doses of biostimulant applied via
seed treatment (0, 5, 10, 15, and 20 mL kg-1 of seeds).
The experiment was replicated five times with each replicate represented by two pots, each containing one plant.
The lowest water salinity level (0.5 dS m-1)
corresponded to that of the water supplied by
UFERSA, and the level of 3.5 dS m-1 was obtained by
the dissolution of sodium chloride (NaCl). Salinity was adjusted using a Tech-4MP conductivity bench
meter (Tecnal®).
The water used to prepare the fertigation solutions was collected from the water supply system of the central campus of UFERSA. It had the following
characteristics: pH = 8.30, EC = 0.50 dS m-1, Ca2+ =
3.10, Mg2+ = 1.10, K+ = 0.30, Na+ = 2.30, Cl- = 1.80,
HCO3 = 3.00, and CO32- = 0.20 (mmolc L-1).
Using the doses established for each treatment, gherkin seeds, cultivar Liso de Calcutá, were treated
with a biostimulant (Stimulate®), which is composed
of 0.009% kinetin, 0.005% gibberellic acid, 0.005% indolbutiric acid, and 99.981% inert ingredients (Stoller do Brasil, 1998).
The seeds were sown in pots with a capacity of 8 L, and five seeds were sown per pot. Later, plants were thinned, leaving the most vigorous individual in each pot.
The plants were grown in the open at a spacing of 1.50 x 0.75 m, resulting in a population density of 8,889 plants per hectare, and they were cultivated by staking without pruning the main branch. The culture was performed vertically using polythene strips tied to vertical trellises installed along the planting line.
Each water treatment used a separate irrigation system that comprised a PVC reservoir (300 L); a Metalcorte/Eberle EBD250076 auto-ventilated, electric circulation pump (driven by a single-phase, 210-V, 60-Hz motor, similar to that used in washing machines); 12-mm side lines; and emitters with microtubules with
an average flow rate of 2.5 L h-1. The irrigations were
performed so that one fertigation corresponded to one irrigation event using the nutrient solution recommended by Castellane and Araújo (1994) for hydroponic melon crops (Oliveira et al., 2014a).
The irrigation blade was selected to raise the moisture in the soil to its maximum water retention
capacity plus a leaching fraction of 10%. Fertigations were performed at a frequency of five events daily at two-hour intervals (8:00, 10:00, 12:00, 14:00, and 16:00 h) and were controlled by means of a model TE-2
digital timer (Decorlux®). The duration of each
irrigation was adjusted throughout the experiment to meet the water requirements of the plants. The applied water depth was defined as that necessary for minimum drainage from the pots, at which time watering was stopped.
The harvests, of which there was a total of five, began 35 days after anthesis with the picking of unripened fruits with an intense green color (Medeiros, Grangeiro, Torres, & Freitas, 2010). After each harvest, the fruits were counted and then weighed to determine the production per plant.
At the end of the experiment (110 days after sowing), plants were cut close to the soil and collected, and their development (number of leaves; number of secondary branches; length of the largest branch; and leaf, stem, fruit and total dry matter) and yield (number of fruits, average fruit weight and fruit production) were evaluated.
These variables were analyzed as follows:
a) number of leaves: determined immediately after collection and starting from the basal leaves to the last open leaf of each replicate considering only green leaves while disregarding yellow and/or dried leaves;
b) number of secondary branches: obtained by counting the number of secondary branches in each replicate;
c) length of the largest branch: plants were placed on the bench, and the length of the longest branch was determined by measuring the branch from the cutting point (close to the soil surface) to the apical meristem of the plant using a tape graduated in cm;
d) leaf, stem, fruit and total dry matter: plants were separated into three parts (leaves, stems and fruits), packaged in paper bags, dried in a forced-air ventilation oven at 65°C to a constant weight and then weighed on a precision scale (0.01 g). The total dry matter was determined as the sum of the dry leaf, stem and fruit matter;
e) number of fruits: obtained by counting the number of fruits in all samples and expressed as fruits per plant;
Page 4 of 10 Souza Neta et al.
g) fruit production: calculated as the fresh mass of the commercial-quality fruits of each plant and
expressed as yield per plant (g plant-1).
The data were subjected to analyses of variance using the F-test. The mean values of the variables for each salinity treatment were compared using Tukey’s test at the 5% level of probability. Means related to the effects of the biostimulant doses were analyzed by regression analysis, and the equations were fitted to polynomial models. The analyses were performed using Sisvar software (Ferreira, 2011).
Results and discussion
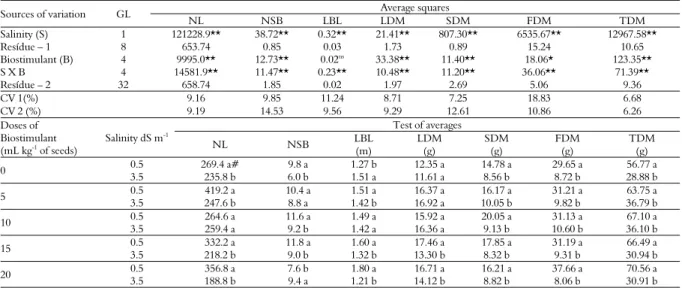
There was a significant effect of the interaction between salinity and the biostimulant, as well as salinity alone, for all variables at the 1% probability level, except for the length of the largest branch (p > 0.05) and fruit dry matter (p < 0.05). There was also a significant effect of the biostimulant, at 1% probability, on the other growth variables (Table 2).
The absence of salt stress resulted in higher values of all variables regardless of biostimulant use. With salinity, the greatest losses were observed in the number of leaves, stem dry matter, fruit dry matter and total dry matter with decreases of 29.9, 47.3, 71.7, and 49.6%, respectively (Table 2).
One of the most common effects of salinity on plants is growth limitation due to increased osmotic pressure from the medium, as well as a decrease in the volume of water available to
plants, which affects cell division and elongation. The decrease in the leaf area of plants grown under salinity conditions represents an important adaptive mechanism since, under such conditions, transpiration decreases, which is accompanied by
a decrease in the transport of Na+ and Cl- ions in
the xylem that maintains a high water potential (Taiz & Zeiger, 2009).
A decrease in gherkin growth under salt stress was also reported by Oliveira et al. (2014b), and decreases have been observed in other species of agronomic importance in the same botanical family, such as melons (Freitas, Figueirêdo, Porto Filho, Costa, & Cunha, 2014) and zucchini (Strassburger et al., 2011).
With respect to the effects of the biostimulant, there was a quadratic response in the number of leaves and the number of secondary branches regardless of the salinity level (Figure 2A and B).
The highest number of leaves occurred with
the biostimulant doses of 14.3 and 6.8 mL kg-1 of
seeds, resulting in 365.9 and 253.2 leaves in plants
subjected to the 0.5 and 3.5 dS m-1 salinity levels,
respectively (Figure 2A). The 9.0 mL kg-1 of seeds
biostimulant dose resulted in the highest number of secondary branches (12 branches) in the absence of salt stress. In plants irrigated with saline water, the highest number of secondary branches (10 branches) occurred with the dose of
14.6 mL biostimulant kg-1 of seeds, evidencing the
positive effects of the biostimulant on this variable (Figure 2B).
Table 2. Summary of the results of the analyses of variance and the mean values for the number of leaves (NL); number of secondary branches (NSB); largest branch length (LBL); leaf (LDM), stem (SDM), and fruit dry matter (FDM); and the total dry matter (TDM) of gherkin, cultivar Liso de Calcutá, using seeds treated with different doses of biostimulant and grown under conditions of salt stress.
Sources of variation GL Average squares
NL NSB LBL LDM SDM FDM TDM
Salinity (S) 1 121228.9** 38.72** 0.32** 21.41** 807.30** 6535.67** 12967.58**
Resídue – 1 8 653.74 0.85 0.03 1.73 0.89 15.24 10.65
Biostimulant (B) 4 9995.0** 12.73** 0.02ns 33.38** 11.40** 18.06* 123.35** S X B 4 14581.9** 11.47** 0.23** 10.48** 11.20** 36.06** 71.39**
Resídue – 2 32 658.74 1.85 0.02 1.97 2.69 5.06 9.36
CV 1(%) 9.16 9.85 11.24 8.71 7.25 18.83 6.68
CV 2 (%) 9.19 14.53 9.56 9.29 12.61 10.86 6.26
Doses of Biostimulant (mL kg-1
of seeds)
Salinity dS m-1
Test of averages
NL NSB LBL
(m)
LDM (g)
SDM (g)
FDM (g)
TDM (g)
0 0.5 269.4 a# 9.8 a 1.27 b 12.35 a 14.78 a 29.65 a 56.77 a 3.5 235.8 b 6.0 b 1.51 a 11.61 a 8.56 b 8.72 b 28.88 b
5 0.5 419.2 a 10.4 a 1.51 a 16.37 a 16.17 a 31.21 a 63.75 a 3.5 247.6 b 8.8 a 1.42 b 16.92 a 10.05 b 9.82 b 36.79 b
10 0.5 264.6 a 11.6 a 1.49 a 15.92 a 20.05 a 31.13 a 67.10 a 3.5 259.4 a 9.2 b 1.42 a 16.36 a 9.13 b 10.60 b 36.10 b
15 0.5 332.2 a 11.8 a 1.60 a 17.46 a 17.85 a 31.19 a 66.49 a 3.5 218.2 b 9.0 b 1.32 b 13.30 b 8.32 b 9.31 b 30.94 b
Acta Scientiarum. Agronomy, v. 40, e35216, 2018 Figure 2. Number of leaves (A); number of secondary branches (B); length of the largest branch (C); and the leaf (D), stem (E), fruit (F), and total dry matter (G) of gherkin plants, cultivar Liso de Calcutá, grown from seeds treated with different doses of biostimulant and cultivated under conditions of salt stress.
y (♦) = 266.6 + 14.77x - 0.615x2
R² = 0.821
y (□) = 235.3 + 5.269x - 0.386x2
R² = 0.930 0
100 200 300 400
0 5 10 15 20
N u m b er o f leaves
Doses of biostimulant (mL kg-1of seeds)
A 0.5 dS/m 3.5 dS/m
y (♦) = 9.325 + 0.545x - 0.030x2
R² = 0.778
y (□) = 6.308 + 0.448x - 0.015x2
R² = 0.885 0 2 4 6 8 10 12
0 5 10 15 20
N u m b er of s eco nd ar y br an ch es
Doses of biostimulant (mL kg-1of seeds)
B 0.5 dS/m 3.5 dS/m
y (♦) = 1.305 + 0.022x
R² = 0.893
y (□) = 1.513 - 0.013x
R² = 0.931
0.0 0.5 1.0 1.5 2.0
0 5 10 15 20
L ar g es t br an ch l enht g (m )
Doses of biostimulant (mL kg-1of seeds)
C 0.5 dS/m 3.5 dS/m
y (♦) = 12.62 + 0.746x - 0.027x2
R² = 0.954
y (□) = 12.01 + 0.74x - 0.035x2
R² = 0.818
0 4 8 12 16 20
0 5 10 15 20
D ry m at ter of le av es ( g pl ant -1)
Doses of biostimulant (mL kg-1of seeds)
D 0.5 dS/m 3.5 dS/m
y (♦) = 14.41 + 0.727x - 0.031x2
R² = 0.813
y (□) = 8.78
0 4 8 12 16 20
0 5 10 15 20
D ry m at ter of s tem s (g p la n t -1)
Doses of bioetimulant (mL kg-1of seeds)
E 0.5 dS/m 3.5 dS/m
y (♦) = 25.19 + 0.617x
R² = 0.960
y (□) = 8.639 + 0.622x - 0.032x2
R² = 0.925 0
10 20 30 40
0 5 10 15 20
D ry m at ter of f rui ts ( g pl ant -1)
Doses of bioesimulant (mL kg-1of seeds)
F 0.5 dS/m 3.5 dS/m
y (♦) = 55.20 + 0.904x
R² = 0.814
y (□) = 29.35 + 1.421x - 0.071x2
R² = 0.852 0 20 40 60 80 100
0 5 10 15 20
T o ta l d ry m at ter ( g pl an t -1)
Doses of biostimulante (mL kg-1of seeds)
Page 6 of 10 Souza Neta et al.
Contrary to the results of this study, different
concentrations of Stimulate® were not found to
promote significant differences in the number of leaves in watermelons when plants were sprayed with doses of 0, 0.25, 0.5, 0.75, and 1% thirteen days after sowing in a previous study (Silva, Bolfarini, Rodrigues, Ono, & Rodrigues, 2014a). This result may be related to the way the treatment was applied, i.e., based on the phenological stage of the crop. According to Taiz and Zeiger (2009), cytokinins present in the biostimulant may induce the formation of new branches.
The increase in the number of branches contributes to gherkin fruit production. Therefore, the highest concentration of female flowers and, consequently, fruits occurs on the secondary and tertiary branches (Modolo & Costa, 2003).
The length of the largest branch responded linearly to the different biostimulant doses under both levels of salinity. Thus, in plants grown without salt stress, the
length increased. No biostimulant (0 mL kg-1) resulted
in the shortest branch length (1.27 m), but as the dosage increased, this variable increased to a maximum
length of 1.80 m with the highest dose (20 mL kg-1).
Divergent results were found for plants cultivated under salt stress; the lowest dose of the biostimulant increased the length of the largest branch (1.51 m). In contrast, the application of the biostimulant at the highest dose reduced this variable by 19.6% (1.21 m) (Figure 2C).
The accumulation of biomass in response to the biostimulant varied according to the part of the plant. For leaf dry matter, a quadratic response to the two salinity conditions was observed so that the highest
values, 17.2 and 15.5 g plant-1, were estimated for the
doses of 14.5 and 10.4 mL kg-1 of seeds for plants
grown under 0.5 and 3.5 dS m-1 salinity, respectively
(Figure 2D).
These results differ from those obtained by Izidório, Lima, Vendrusculo, Ávila, and Alvarez (2015), who evaluated the effects of a foliar
application of Stimulate® while transplanting lettuce.
These authors observed a decrease in leaf dry matter with an increase in the concentration of the biostimulant; the highest dose of the product
reduced leaf dry matter by 7.0 g plant-1, representing
a 51.1% decrease relative to the control. Therefore, transplantation does not seem to be the ideal time to apply a bioregulator.
No significant effects of the biostimulant were found on the stem dry matter (Figure 2E) of plants
irrigated with saline water (3.5 dS m-1); the average
value was 8.98 g plant-1. However, in plants irrigated
with low-salinity water, there was a quadratic response. The maximum biomass accumulation in stems, 18.8 g
plant-1, was obtained at a biostimulant dose of 11.5 mL
kg-1 of seeds (Figure 2E).
Regarding the accumulation of fruit dry matter (Figure 2F), significant differences were found between the different biostimulant doses and salinity levels. For plants irrigated with low-salinity water, there was a quadratic response; the increase in dosage caused an increase in this variable. The highest value occurred at the dose of
20 mL kg-1 of seeds (35.36 g plant-1), which was
18.1% higher than that without biostimulant (0
mL kg-1 of seeds). There was also a quadratic
response under salt stress conditions with an increase in fruit dry matter until 9.1 mL
biostimulant kg-1 of seeds (10.3 g plant-1), after
which biomass decreased.
Analyzing the accumulation of total dry matter by the plants (Figure 2G), different responses were found with the evaluated doses of biostimulant at both salinity levels (absence and presence). For plants irrigated with low-salinity water, the data better fitted the increasing linear equation, in which
the lowest value (56.77 g plant-1) was obtained
without the biostimulant (0 mL kg-1 of seeds), while
the highest value (70.56 g plant-1) was obtained with
the highest dose (20 mL kg-1 of seeds),
corresponding to a 19.54% increase in the production of total dry matter.
For plants grown under conditions of salt stress, the data were better represented by the quadratic equation. Initially, there was an increase in the total dry matter, and the best results were observed at the
biostimulant dose of 9.7 mL kg-1 of seeds (35.63 g
plant-1), after which the increase in biostimulant
caused a decrease in the total dry matter (Figure 2G).
The beneficial effects of treating seeds with biostimulants were due to the effects on the plant components. Such substances increase plant growth and plant development and stimulate cell division, and they may also increase the absorption of water and nutrients (Vieira & Castro, 2002).
Acta Scientiarum. Agronomy, v. 40, e35216, 2018 Table 3. Summary of the results of the analyses of variance and the average number of fruits per plant (NF), average fruit weight (AFW) and production (PROD) of gherkin, cultivar Liso de Calcutá, grown from seeds treated with different doses of biostimulant under conditions of salt stress.
Sources of variation GL Average squares
NF AFW PROD
Salinity (S) 1 1607.45** 875.38** 1648590.24**
Resídue – 1 8 1.41 1.66 645.94
Biostimulant (B) 4 7.57** 12.49** 6668.01**
S X B 4 2.01* 14.65** 622.45n.s
Resídue – 2 32 0.64 1.69 841.24
CV 1(%) 8.08 6.11 7.60
CV 2 (%) 5.44 6.16 8.67
Doses of Biostimulant (mL kg-1
of seeds) Salinity dS m-1
Test of averages
NF AFW
(g fruit-1 )
PROD (g plant-1 )
0 0.5 19.20 a# 25.66 a 492.42 a
3.5 9.40 b 14.39 b 132.79 b
5 0.5 20.00 a 26.46 a 523.77 a
3.5 8.10 b 18.66 b 151.33 b
10 0.5 21.80 a 24.77 a 540.32 a
3.5 10.50 b 19.24 b 201.65 b
15 0.5 20.80 a 23.88 a 533.88 a
3.5 9.00 b 17.07 b 153.53 b
20 0.5 20.10 a 25.60 a 489.25 a
3.5 8.20 b 15.17 b 124.53 b
ns,** and * non significant, significant at 5 and 1% probability, by T test. # Averages followed by the same letter in columns, per salinity, did not differ by Tukey test (p < 0.05).
When the effects of the factors were disentangled, it was also observed that the absence of salt stress resulted in higher values for the plant yield variables compared to growth under salt stress conditions, as shown in Table 3. The observed decreases were 55.6, 33.1, and 70.4% for the number of fruits, average fruit mass and fruit production, respectively, when plants were grown under salt stress regardless of the biostimulant dose.
Salinity decreased the number of gherkin fruits per plant regardless of the biostimulant dose, which is consistent with the results obtained by Oliveira et al. (2014b) for the Do Norte gherkin cultivar.
A decrease in the number of fruits in response to salt stress has been reported by several authors for different species in the same botanical family as gherkin, such as muskmelon (Medeiros, Medeiros, Dias, Barbosa, & Lima, 2011; Terceiro Neto, Gheyi, Medeiros, Dias, & Campos, 2013) and pumpkin (Silva, Lima, Silva, Oliveira, & Medeiros, 2014b). According to Amor, Martinez, and Cerdá (1999), the decrease in the number of fruits in response to salinity is due to a high rate of abortions.
It is likely that the decrease in the number of fruits per plant with an increase in salinity is due to a change in osmotic potential, that is, a decrease in water consumption by plants and a consequent decrease in nutrient uptake, which may cause a decrease in the fruit fixation index. Similar results were obtained for other vegetables such as melon (Melo et al., 2011) and eggplant (Marques et al., 2012).
The decrease in production in response to salinity may be attributed to lower fixation by the fruits as well as a decrease in the translocation of
assimilates, which was also observed by Oliveira et al. (2014b) for gherkin, cv. Do Norte.
With respect to the effects of the biostimulant on production variables, the number of fruits varied depending on the salinity of the irrigation water. For plants grown without salt stress, the data best fit the quadratic polynomial equation. The highest number of fruits per plant (21.24 fruits) was promoted by the
biostimulant dose of 11.5 mL kg-1 of seeds, beyond
which there was a decrease in fruit number (Figure 3A).
In plants irrigated with saline water (3.5 dS m-1),
biostimulation had no effect on the number of fruits; the mean value was 9.04 fruits per plant (Figure 3A). These results demonstrate that the effects of the biostimulant may be modified or inhibited according to the environmental conditions, which was verified by Oliveira et al. (2015).
The significant effect of the interaction between the studied factors on average fruit mass indicates that the effects of the biostimulant depended on salt stress. For this variable, there were no differences in the effects of the applied biostimulant doses when the plants were grown in the absence of salt stress;
the mean value was 25.48 g fruit-1. For plants grown
under stress, the data best fit the polynomial equation, initially presenting an increase in average fruit weight up to the dose of 10.01 mL biostimulant
kg-1 of seeds (19.06 g. fruit-1) and then a decrease to a
20% loss in plants whose seeds were treated with a
biostimulant dose of 20 mL kg-1 of seeds (Figure
Page 8 of 10 Souza Neta et al.
Figure 3. Number of fruits per plant (A), average fruit weight (B), and fruit production (C) in gherkin, cultivar Liso de Calcutá, grown from seeds treated with different doses of biostimulant under conditions of salt stress.
At both salinity concentrations, the biostimulant doses appeared to affect fruit production, and in both cases, the quadratic equation best fit the values. Initially, there was an increase in production in response to increasing doses of biostimulant. The highest yields occurred at the doses of 9.74 and
10.87 mL kg-1 of seeds for plants grown in the
absence and presence of salt stress, respectively, obtaining maximum values of 546.84 and 180.45 g
plant-1 (Figure 3C).
In summary, the results of this study show that treating seeds with biostimulant has variable effects on the development and production of gherkin depending on the presence or absence of salt stress. These results partially refute those for soy found by Mortele, Santos, Braccini, Scapim, and Barbosa (2008), who assumed that the effectiveness of the bioregulator would be more pronounced and produce the best results under stress conditions.
On the other hand, the results corroborate reports by several authors for different cultures, such as cowpea (Oliveira et al., 2015) and cotton (Ávila, Barizão, Gomes, Fedri, & Albrecht, 2010).
These authors found that the effects of the biostimulant on plants change under stress conditions, which indicates that a set of eco-physiological factors, together or separately, may interfere with the performance of bioregulators (Albrecht, Braccini, Scapim, Ávila, & Albrecht, 2012).
However, the results of this study only potentially and not definitely confirm the hypothesis of this research that treating seeds with a biostimulant could inhibit or mitigate the effects of salinity, so further tests are needed to confirm the actual effectiveness of the use of this product under conditions of abiotic stress (Albrecht et al., 2011).
Studies are also necessary to identify possible product concentrations and other methods of applying the biostimulant that could increase gherkin crop productivity. Finally, further research is needed to verify whether this biostimulant promotes an increase in productivity and to assess the economic feasibility of its use in gherkin production.
y (♦) = 19.03 + 0.383x - 0.016x2
R² = 0.808
y (□) = 9.0
0 5 10 15 20 25
0 5 10 15 20
N
u
m
b
er
of
f
rui
ts
pe
r pl
an
t
Doses of biostimulant (mL kg-1of seeds)
A 0.5 dS/m 3.5 dS/m
y (♦) = 25.48
y (□) = 14.75 + 0.861x - 0.043x2
R² = 0.908 0
5 10 15 20 25 30
0 5 10 15 20
A
v
er
ag
e f
rui
t
w
ei
ght
(
g
f
rui
t
-1)
Doses of biostimulante (mL kg-1of seeds)
B 0.5 dS/m 3.5 dS/m
y (♦) = 462.8 + 15.44x - 0.709x2
R² = 0.973
y (□) = 127.9 + 10.77x - 0.552x2
R² = 0.751
0 100 200 300 400 500 600
0 5 10 15 20
Pr
od
uc
ti
on (
g
p
lant
-1)
Doses of biostimulant (mL kg-1of seeds)
Acta Scientiarum. Agronomy, v. 40, e35216, 2018 Conclusion
Saline irrigation water decreases the number of leaves, the number of secondary branches and the length of the largest branch as well as the accumulation of biomass and gherkin production variables regardless of the biostimulant dose.
Treating seeds with the biostimulant in the absence of salt stress increases the number of leaves and branches as well as the length of the largest branch and biomass accumulation.
Applying biostimulant to seeds is not effective at reducing the effects of salinity on gherkin production, but it promotes an increase in fruit production regardless of salinity level.
References
Albrecht, L. P., Braccini, A. L., Scapim, C. A., Ávila, M, R., & Albrecht, A. J. P. (2012). Biorregulador na composição química e na produtividade de grãos de
soja. Revista Ciência Agronômica, 43(4), 774-782.
Albrecht, L. P., Braccini, A. L., Scapim, C. A., Ávila, M. R., Albrecht, A. J. P., & Ricci, T. T. (2011). Manejo de biorregulador nos componentes de produção e
desempenho das plantas de soja. Bioscience Journal,
27(6), 865-876.
Amor, F. M. D., Martinez, V., & Cerdá, A. (1999). Salinity duration and concentration affect fruit yield and quality, and growth and mineral composition of
melon plants grown in perlite. HortScience, 34(7),
1234-1237.
Ávila, M. R., Barizão, D. A. O., Gomes, E. P., Fedri, G., & Albrecht, L. P. (2010). Cultivo de feijoeiro no outono/inverno associado à aplicação de bioestimulante e adubo foliar na presença e ausência
de irrigação. Scientia Agraria, 11(3), 221-230.
Carmo Filho, F., & Oliveira, O. F. (1995). Mossoró: um
município do semiárido nordestino, caracterização climática e aspecto florístico. Mossoró, RN: ESAM. Carmo, G. A., Oliveira, F. R. A., Medeiros, J. F., Oliveira,
F. A., Campos, M. S., & Freitas, D. C. (2011). Teores foliares, acúmulo e partição de macronutrientes na
cultura da abóbora irrigada com água salina. Revista
Brasileira de Engenharia Agrícola e Ambiental, 15(5), 512-518.
Castellane, P. D., & Araújo, J. A. C. (1994). Cultivo sem
solo: hidroponia. Jaboticabal, SP: Funep.
Ferreira, D. F. (2011). Sisvar: a computer statistical
analysis system. Ciência e Agrotecnologia, 35(6),
1039-1042.
Freitas, L. D. A., Figueirêdo, V. B., Porto Filho, F. Q., Costa, J. C., & Cunha, E. M. (2014). Crescimento e produção do meloeiro cultivado sob diferentes níveis
de salinidade e nitrogênio. Revista Brasileira de
Engenharia Agrícola e Ambiental, 18(supl.), S20-S26. Garcia, R. A., Gazola, E., Merlin, A., Villas Boas, R. L., &
Crusciol, C. A. C. (2009). Crescimento aéreo e
radicular de arroz de terras altas em função da
adubação fosfatada e bioestimulante. Bioscience Journal,
25(4), 65-72.
Izidório, T. H. C., Lima, S. F., Vendrusculo, E. P., Ávila, J., & Alvarez, R. C. F. (2015). Bioestimulante via foliar
em alface após o transplantio das mudas. Revista de
Agricultura Neotropical, 2(2), 49-56.
Marques, D. J., Broetto, F., Lobato, A. K. S., Silva, E. C., Carvalho, J. G., Ávila, F. W., & Andrade, I. P. (2012). Photosynthetic pigments, nitrogen status, and flower behavior in eggplant exposed to different sources and
levels of potassium, Scientific Research and Essays, 8(2),
67-74.
Medeiros, D. C., Medeiros, J. F., Dias, P. M. S., Barbosa, M. A. G., & Lima, K. S. (2011). Produção de melão Pele de Sapo híbrido ‘Medellín’ cultivado com
diferentes salinidades da água. Revista Ciência
Agronômica, 42(3), 628-634.
Medeiros, M. A., Grangeiro, L. C., Torres, S. B., & Freitas, A. V. L. (2010). Maturação fisiológica de
sementes de maxixe (Cucumis anguria L.). Revista
Brasileira de Sementes, 32(3), 17-24.
Melo, T. K., Medeiros, J. F., Espínola Sobrinho, E., Figueiredo, V. B., Pereira, V. C., & Campos, M. S. (2011). Evapotranspiração e produção de melão Gália irrigado com água de diferentes salinidades e adubação
nitrogenada. Revista Brasileira de Engenharia Agrícola e
Ambiental, 15(12), 1235-1242.
Modolo, V. A., & Costa, C. P. (2003). Avaliação de linhagens de maxixe paulista cultivadas em canteiros
com cobertura de polietileno. Horticultura Brasileira,
21(3), 534-538.
Mortele, L. M., Santos, R. F., Braccini, A. L., Scapim, C. A., & Barbosa, M. C. (2008). Efeito da aplicação de biorregulador no desempenho agronômico e
produtividade da soja. Acta Scientiarum. Agronomy,
30(5), 701-709.
Munns, R. (2005). Genes and salt tolerance: bringing
them together. New Phytologist, 167(3), 645-663.
Oliveira, A. P., Oliveira, A. N. P., Alves, E. U., Alves, A. U., Leonardo, F. A. P., & Santos, R. R. (2008).
Rendimento de maxixe em função de doses de P2O5
em solo arenoso. Ciência e Agrotecnologia, 32(4),
1203-1208.
Oliveira, F. A., Oliveira, M. K. T., Medeiros, J. F., Silva, O. M. P., Paiva, E. P., & Maia, P. M. E. (2014a). Produtividade do maxixeiro cultivado em substrato e
fertirrigado com soluções nutritivas. Horticultura
Brasileira,32(4), 464-467.
Oliveira, F. A., Pinto, K. S. O., Bezerra, F. M. S., Lima, L. A., Cavalcante, A. L. G., Oliveira, M. K. T., & Medeiros, J. F. (2014b). Tolerância do maxixeiro, cultivado em vasos, à salinidade da água de irrigação. Revista Ceres, 61(1), 147-154.
Oliveira, F. A., Medeiros, J. F., Alves, R. C., Lima, L. A., Santos, S. T., & Régis, L. R. L. (2015). Produção de feijão caupi em função da salinidade e regulador de
crescimento. Revista Brasileira de Engenharia Agrícola e
Page 10 of 10 Souza Neta et al.
Palangana, F. C., Silva, E. S., Goto, R., & Ono, E. O. (2012). Ação conjunta de citocinina, giberelina e auxina em pimentão enxertado e não enxertado sob
cultivo protegido. Horticultura Brasileira, 30(4),
751-755.
Silva, M. J. R., Bolfarini, A. C. B., Rodrigues, L. F. O. S., Ono, E. O., & Rodrigues, J. D. (2014a). Formação de mudas de melancia em função de diferentes concentrações e formas de aplicação de mistura de
reguladores vegetais. Revista Scientia Plena, 10(10), 1-9.
Silva, M. V. T., Lima, R. M. S., Silva, N. K. C., Oliveira, F. L., & Medeiros, J. F. (2014b). Produção de abobora sob diferentes níveis de água salina e doses de
nitrogênio. Revista Verde de Agroecologia e
Desenvolvimento Sustentável, 9(1), 287-294.
Stoller do Brasil. (1998). Stimulate® Mo em hortaliças:
informativo técnico. Cosmópolis, SP: Stoller do Brasil. Divisão Arbore.
Strassburger, A. S., Peil, R. M. N., Fonseca, L. A., Aumonde, T. Z., & Mauch, C. R. (2011). Dinâmica
do crescimento da abobrinha italiana em duas estações
de cultivo. Acta Scientiarum. Agronomy, 33(2), 283-289.
Taiz, L., & Zeiger, E. (2009). Fisiologia vegetal. Porto
Alegre, RS: Artmed.
Terceiro Neto, C. P. C., Gheyi, H. R., Medeiros, J. F., Dias, N. S., & Campos, M. S. (2013). Produtividade e qualidade de melão sob manejo com água de
salinidade crescente. Pesquisa Agropecuária Tropical,
43(4), 354-362.
Vieira, E. L., & Castro, P. R. C. (2002). Ação de stimulante
no desenvolvimento inicial de plantas de algodoeiro
(Gossypium hirsutum L.). Piracicaba, SP:
USP/Departamento de Ciências Biológicas.
Received on February 3, 2017. Accepted on April 5, 2017.