Pesquisa /
Research
brasileirabrasileira
O
verhead sprinklers are used in 63% of the greenhouse industry for ornamental production (Hodges et al.,2008). Overhead irrigation is inefficient
and leads to an increased incidence of foliar disease due to frequent leaf
wetting. Plants are often over watered to ensure that the substrate is adequately wet, resulting in runoff and leaching. The discharge of water and nutrients to the environment has the potential to contaminate soil and groundwater with
pesticides and nutrients. More efficient
irrigation systems such as recirculated subirrigation, conserve water and nutrients and increase plant salability, but are used only by 5% of the growers (Hodges et al., 2008).
FERRAREZI RS; van IERSEL MW; TESTEZLAF R. 2014. Subirrigation automated by capacitance sensors for salvia production. Horticultura Brasileira
32: 314-320. DOI - http://dx.doi.org/10.1590/S0102-05362014000300013.
Subirrigation automated by capacitance sensors for salvia production
Rhuanito S Ferrarezi1; Marc W van Iersel1; Roberto Testezlaf2
1University of Georgia, Department of Horticulture, 1111 Miller Plant Science Building, 30602 Athens-GA, USA; [email protected].
br; [email protected]; 2University of Campinas, School of Agricultural Engineering, Av. Candido Rondon 501, 13083-875 Campinas-SP,
Brasil; [email protected]
ABSTRACT
Subirrigation is typically controlled using timers to periodically irrigate plants based on a pre-determined schedule. The objective of this study was to evaluate the usefulness of capacitance-type sensors to monitor substrate water content and to control subirrigation automatically for salvia production in greenhouse. Additionally, we quantified the effect of different substrate volumetric water content (VWC) on growth of plants cultivated in 15-cm diameter × 13.75-cm height pots. Automation was performed using three EC-5 capacitance soil moisture sensors per experimental unit, connected to a system with a CR10X data logger, AM16/32 multiplexer, SDM-CD16AC relay driver and NK-2 submersible pumps. Substrate moisture readings were taken every 15 minutes, and plants were irrigated only if the readings dropped below pre-set VWC thresholds. We evaluated five levels of substrate VWC (0.1, 0.2, 0.3, 0.4 and 0.5 m3 m-3), with
two replications, in a completely randomized design. The system effectively monitored and recorded VWC, and controlled irrigation accordingly. Substrate VWC ranged from 0.1 to 0.41, 0.2 to 0.39, 0.3 to 0.41, 0.4 to 0.43 and 0.5 to 0.53 m3 m-3, in ascending order
of the treatments, with the highest values recorded after irrigation events. The number of irrigation events, total volume of nutrient solution applied, net photosynthesis, dry weight, number of branches and leaves, shoot height, leaf area, canopy light interception, and leaf chlorophyll content all increased significantly with the increase in VWC (p<0.0001). The VWC of 0.5 m3 m-3 provided the highest
plant growth (p<0.0001). Capacitance sensors can be used to both monitor soil moisture and control subirrigation for salvia production in soilless substrate, reducing the possibility of water stress caused by daily irrigation schedule using timers.
Keywords: Salvia splendens ‘Vista Red’, automation, ebb-and-flow benches, photosynthesis, plant growth.
RESUMO
Subirrigação automatizada por sensores capacitivos para produção de sálvia
Atualmente o controle da subirrigação é realizado por meio de temporizadores, usando calendário fixo para acionamento pe -riódico da irrigação. O objetivo deste trabalho foi avaliar o uso de sensores capacitivos no monitoramento da umidade do substrato e no controle automatizado da subirrigação para a produção de sálvia em ambiente protegido. Adicionalmente, quantificou-se o efeito de diferentes conteúdos volumétricos de água (CVA) do substrato no crescimento de plantas cultivadas em vasos com 15 cm de diâmetro × 13,75 cm de altura. A automação foi realizada por três sensores de umidade EC-5 por unidade experimental, conectados a um sistema constituído por sistema de aquisição de dados CR10X, multiplexador AM16/32, controlador de saídas SDM-CD16AC e bombas submer-sas NK-2. As determinações da umidade eram realizadas a cada 15 minutos, com acionamento da irrigação somente quando as leituras eram inferiores aos valores estabelecidos como tratamentos. Foram utilizados cinco CVA do substrato (0,1; 0,2; 0,3; 0,4 e 0,5 m3 m-3),
com duas repetições e em delineamento inteiramente casualizado. O sistema monitorou a umidade do substrato e controlou a subirri-gação adequadamente ao longo do tempo. A umidade do substrato variou de 0,1 a 0,41; 0,2 a 0,39; 0,3 a 0,41; 0,4 a 0,43 e 0,5 a 0,53 m3 m-3, na ordem crescente dos tratamentos, com os resultados mais
altos registrados imediatamente após as irrigações.O número de irrigações, volume total de solução nutritiva aplicado, fotossíntese líquida, massa seca, número de ramos e de folhas, altura da parte aérea, área foliar, interceptação luminosa pelo dossel e teor relativo de clorofila aumentaram significativamente com o aumento do CVA (p<0,0001). O CVA de 0,5 m3 m-3 proporcionou maior crescimento
das plantas (p<0,0001). Sensores capacitivos podem ser utilizados no monitoramento da umidade e controle da subirrigação na produção de sálvia, reduzindo a possibilidade de estresse hídrico causado por irrigações diárias usando temporizadores.
Palavras-chave: Salvia splendens ‘Vista Red’, automação, mesas de subirrigação, fotossíntese, crescimento vegetal.
Subirrigation applies water and nutrients to the bottom of the pots, allowing vertical water movement through the substrate to occur by capillary rise. This system provides plants with water and nutrients more efficiently than sprinkler or drip irrigation systems (Neal & Henley, 1992). Subirrigation also reduces or eliminates the release of environmental contaminants by zero runoff and no leaching (Dumroese et al., 2006) and uses less water (James & van Iersel, 2001) because irrigation water can be recirculated and reused. Subirrigation has other advantages over traditional irrigation systems, including increased production per unit area (Rouphael et al., 2006), more uniform plant growth (Biernbaum, 1990), shorter crop cycles (Pennisi et al., 2005), and reduced labor costs (Uva et al., 1998). Subirrigation systems can be automated (Ferrarezi & van Iersel, 2011), and facilitate easy pesticide and plant growth regulator application (Rouphael et al., 2006). However, subirrigation can more easily spread root pathogens (Oh & Son, 2008), and salts may accumulate in the upper layers of the substrate (Dole et al., 1994; Richards & Reed, 2004; Rouphael & Colla, 2005; Rouphael et al., 2006). Furthermore, these systems are expensive to install and maintain (Dumroese et al., 2006).
Subirrigation systems are typically controlled using timers, and plants are irrigated based on a pre-determined schedule. This can result in excessive drying and drought stress between irrigation events, and over-watering. Thus, the irrigation is not based on plant water requirements or the minimum substrate water content for acceptable plant growth.
An alternative for improving water management is the automation of subirrigation using capacitance-type sensors to monitor substrate volumetric water content (VWC) and control irrigation based on real time measurements (Ferrarezi & van Iersel, 2011). Capacitance sensors have a capacitor connected to three copper plates along the length of the probe, forming a parallel plate capacitor inside
the sensor body. When the voltage is applied, an electromagnetic field is generated, electrically charging the capacitor. An increase in its capacitance and the time required to charge the capacitor is observed when the sensor is inserted in a wet growing media with
high dielectric constant (water ≈80 while air ≈1). The capacitance can be
estimated by the sensor maintaining the applied voltage constant and measuring the time required to charge the capacitor (Nemali et al., 2007).
Our objective was to evaluate the use of capacitance-type sensors to monitor the substrate water content and to control subirrigation automatically for salvia production in a greenhouse.
Additionally, we quantified the effect
of different substrate VWC on salvia plant growth.
MATERIAL AND METHODS
The study was performed at the Department of Horticulture, University of Georgia, Athens, GA, United States of America, for five weeks (06/13/2011 to 07/16/2011). Greenhouse environmental conditions during the experimental period were (mean ± standard deviation): relative humidity 77.9±4.1%, temperature 25.4±1.2oC, daily light integral (DLI) 12.4±2.45 mol m-2 and vapor pressure deficit (VPD) 0.72±0.13 kPa.
Seedlings of Salvia splendens Sell ex Roem. & Schult ‘Vista Red’ were obtained from a commercial nursery (Knox Nursery, Winter Garden/FL, USA) and transplanted into circular pots (15 cm diameter × 13.75 cm
height), filled with Fafard 1P substrate
(Conrad Fafard, Agawam/MA, USA), composed of 80% peat and 20% perlite. We used a nutrient solution with an electrical conductivity of 0.59 mS cm-1. This solution contained the following nutrients (mg L-1): total N (100) [8% NH4+, 78.3% NO
3
- and 13.7% urea], P (33.3), K (100), Ca (33.3), Mg (13.3), B (0.12), Cu (0.12), Fe (0.50), Mn (0.25), Mo (0.05), and Zn (0.25). The nutrient solution was prepared using 0.67 g L-1 of soluble fertilizer 15-5-15 Cal-Mag Special (Scotts Co., Marysville/OH, USA).
We compared five substrate VWC
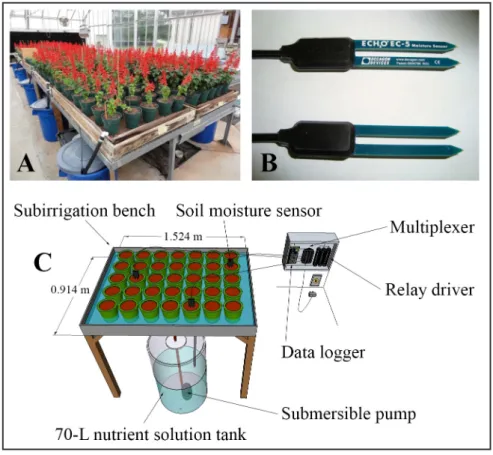
(0.1; 0.2; 0.3; 0.4 and 0.5 m3 m-3) treatments, arranged in a completely randomized design with two replications, totaling ten experimental units. Each experimental unit had 35 pots in an individual ebb-and-flow bench with 150-cm length × 90-cm width × 4-cm height (Midwest GROmaster, Maple Park/IL, USA). Each bench had a 70-L reservoir with lid (50-cm diameter × 65-cm height) Brute® (Rubbermaid, Saratoga Springs/NY) and submersible irrigation pump NK-2 (Little Giant, Bluffton/IN, USA) (Figure 1A).
T h e s y s t e m a u t o m a t i o n w a s performed using three EC-5 capacitance sensors (Decagon Devices, Pullman/ WA, USA) for each experimental unit (Figure 1B), connected to an AM16/32 multiplexer and to a CR10X data logger
(Campbell Scientific, Logan/UT, USA)
(Figure 1C). LoggerNet v.4.1 software (Campbell Scientific) was used to write the automated irrigation control program. The calibration equation used to transform the sensor voltage readings to substrate moisture was VWC (m3 m-3) = 1.8862 × voltage (V) - 0.5624 (R2= 0.9498), determined according to the manufacturer recommendations (Cobos & Chambers, 2010). The irrigation was controlled automatically, based on the sensor reading, using a SDM-CD16AC relay driver (Campbell Scientific) connected to the NK-2 submersible irrigation pump (Figure 1C). Moisture readings were taken every 15 minutes, and the data was continuously recorded every hour throughout the experimental period. The automated control program calculated the average of three sensors and compared the measurements to
Table 1. Number of irrigations and total volume of nutrient solution applied in different volumetric water content treatments for two replications (número de irrigações e volume total de solução nutritiva aplicado em razão de diferentes conteúdos volumétricos de água para duas repetições). Athens, University of Georgia, 2011.
Treatments (m3 m-3)
Number of irrigations Total volume of nutrient solution applied (L)
Rep. 1 Rep. 2 Average Rep. 1 Rep. 2 Average
0.1 4 6 5.0 d 63 71 67.0 c
0.2 9 14 11.5 cd 84 118 101.0 c
0.3 21 27 24.0 c 130 132 131.0 bc
0.4 62 69 65.5 b 223 177 200.0 ab
0.5 140 143 141.5 a 260 261 260.5 a
p-value <0.0001 0.0007
CV (%)* 7.08 12.03
Average values followed by same letters within column do not differ by Tukey test at 1% probability (valores médios seguidos de letras iguais na coluna não diferem pelo teste de Tukey a 1% de probabilidade). *CV = Coefficient of variation.
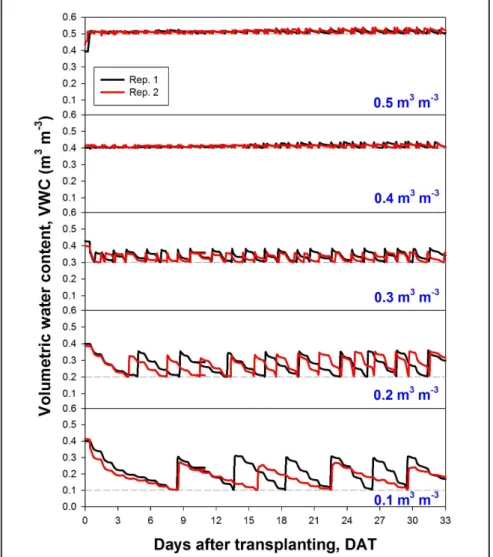
Figure 2. Substrate volumetric water content (VWC) as a function of days after transplanting for 0.1, 0.2, 0.3, 0.4, and 0.5 m3 m-3 treatments. Dotted line indicates the minimum moisture
for irrigation triggering according to the irrigation thresholds [conteúdo volumétrico de água (CVA) do substrato em função dos dias após o transplantio (DAT) para os tratamentos 0,1; 0,2; 0,3; 0,4 e 0,5 m3 m-3. A linha pontilhada indica o limite mínimo para realização das
the thresholds. If the measured value dropped below the threshold for any treatment, the irrigation was turned on for 3 minutes, followed by a complete drainage for 3 minutes, totaling a 6-minute subirrigation.
B e f o r e t h e b e g i n n i n g o f t h e experiment, we determined the shoot dry weight by drying four plants per replication in an oven with forced air
circulation at 80°C for five days and
weighing in a scale.
We e k l y, w e m e a s u r e d t h e photosynthetically active radiation, the stomatal conductance and net photosynthesis of the third fully expanded leaf of four plants, using a CIRAS-2 gas exchange system (PP Systems, Amesbury/MA, USA). Canopy light interception was measured using a ceptometer (AccuPAR LP-80, Decagon Devices), and three readings per experimental unit were recorded weekly. We determined the relative chlorophyll content in the third fully expanded leaf of three plants using a portable chlorophyll meter SPAD-502 (Minolta, Osaka, Japan). Leaf area was also determined using the third fully expanded leaf of three plants using a LAI-3100 leaf meter (LiCor Inc., Lincoln/NE, USA).
During the experiment, we quantified
the number of irrigations using a counter instruction in the automatic control program and the total volume of nutrient solution applied. To determine this variable, the weekly nutrient solution volume used by the plants or lost through evapotranspiration was replenished. The volume of nutrient solution added was totaled at the end of the study. We measured shoot height, shoot dry weight and vegetative and reproductive fractions, number of leaves and branches and total leaf area in four plants.
The results were subjected to analysis of variance, Tukey mean comparison test and polynomial regression using SAS v.9.2 (SAS Institute, Cary/NC, USA). To determine the VWC effects during the experiment (days after transplanting, DAT) in variables measured weekly (photosynthetically active radiation, stomatal conductance, net photosynthesis, light interception by the canopy, relative chlorophyll content
and leaf area), a model that included the main effects, the interaction between variables and quadratic components was used: Y = a0 + (a1 × DAT) + (a2 × VWC) + (a3 × DAT × VWC) + (a4 × DAT2) + (a
5 × VWC
2), where Y= variables listed, and a0, ..., a5= regression
coefficients. Significance levels ≤0.05 were considered statistically significant.
Non-significant components in the regression equation were eliminated using stepwise selection (Proc REG).
RESULTS AND DISCUSSION
The system effectively controlled irrigation and maintained substrate VWC near the threshold values throughout the
duration of the experiment (Figure 2). Substrate VWC ranged from 0.1 to 0.41; 0.2 to 0.39; 0.3 to 0.41; 0.4 to 0.43, and 0.5 to 0.53 m3 m-3, in the ascending order of the treatments, with the highest values immediately after irrigations (Figure 2). Similar results were reported by Burnett & van Iersel (2008), Garland et al. (2012), Kim et al. (2011) and van Iersel et al. (2011), who tested sensor-based irrigation systems with various plants in soilless substrates.
The treatments with lower VWC values (0.1, 0.2 and 0.3 m3 m-3) had a significant increase in soil moisture
after irrigations (Figure 2), which is in
accordance with the findings of Ferrarezi
& van Iersel (2011) for hibiscus ‘Panama
Red’ using the same subirrigation system. This increase occurred because subirrigation maintains a layer of water on the bench surface during the irrigation, ensuring water contact with the pots and increasing the substrate VWC close to saturation. As water
drains back to the tanks, VWC rapidly decreases. However, this was not enough to keep soil moisture levels adequate for plant growth in the treatments with low VWC threshold values. According to Kim et al. (2011), the optimum VWC for major ornamental crops production
is around 0.4 m3 m-3. This value was not maintained throughout the experiment for the lowest VWC treatments, observing a temporal change in moisture (Figure 2). The treatments with higher VWC triggered the submersible pumps more often than the ones with lower
VWC, and therefore used more energy, which may be a disadvantage in places where electrical power is expensive. Since they were controlled separately, the two replications had differences in VWC readings over time. Similar effects have been observed in other studies using sensor-based irrigation (van Iersel & Nemali, 2004; Burnett & van Iersel, 2008; Ferrarezi & van Iersel, 2011; Kim et al., 2011).
Table 1 shows the number of irrigations and the total volume of nutrient solution applied in each treatment. The number of irrigations (p<0.0001) and the volume of the nutrient solution applied (p=0.0007) increased with the increase in VWC, ranging from 5 to 141 and from 67 to 260.5 L, respectively (Table 1). Treatments with higher VWC thresholds
required a greater number of irrigations and, consequently, higher total volume of nutrient solution applied. These results are in accordance with the values of substrate VWC showed in Figure 2 and with Ferrarezi & van Iersel (2011).
T h e w e e k l y v a r i a t i o n o f photosynthetically active radiation, s t o m a t a l c o n d u c t a n c e a n d n e t photosynthesis according to each VWC treatment can be observed in Figure 3. The values of photosynthetically active radiation were similar for all treatments, with no statistical significance (Figure 3A, p>0.05). Stomatal conductance increased with an increase in VWC threshold from 0.1 to 0.4 m3 m-3, and decreased in the 0.5 m3 m-3 treatment (Figure 3B, p<0.0001). The partial r-square values were VWC = 0.2043, VWC×DAT =
0.00307, VWC2 = 0.10125 and DAT2 = 0.0479. The net photosynthesis also increased with increasing values of VWC, especially for the treatment 0.5 m3 m-3, which was superior to the others - except the DAT 16 (Figure 3C, p<0.0001). Partial r-squareanalysis indicated the importance of VWC response and also emphasizes the effect of different sampling days: VWC = 0.31884, VWC×DAT = 0.01003, VWC2 = 0.03297 and DAT2 = 0.13773. These results indicated that elevated VWC lead to higher rates of photosynthesis,
which is in accordance with the findings
of Garland et al. (2012), who evaluated
the influence of VWC and radiation on
photosynthesis, water use efficiency and morphology of alumroot (Heuchera americana ‘Dale’s Strain’). The adjusted regression equations allow the variables estimation using VWC, DAT and their interaction to produce salvia under the same environmental conditions.
The shoot dry weight at the beginning and end of the experiment (Figure 4A, p<0.0001) and vegetative and reproductive fractions (Figure 4B), number of leaves (Figure 4C, p<0.0001) and branches (Figure 4D, p<0.0001), shoot height (Figure 4E, p<0.0001) and leaf area (Figure 4F, p<0.0001) increased with an increase in VWC.
These results are similar to findings by
Burnett & van Iersel (2008), Ferrarezi & van Iersel (2011), Garland et al. (2012), Kim et al. (2011) and van Iersel & Nemali (2004), who investigated the effect of substrate VWC on plant growth of several ornamental species. These authors also showed the effectiveness of VWC drip irrigation control based on the plant water requirement or minimum substrate VWC for a proper plant growth. The greater plant growth was provided by the treatment with VWC of 0.5 m3 m-3, responsible for the largest amount of water applied. However, the treatments VWC 0.2 and 0.3 m3 m-3 showed an unexpected trend, contrary from previous studies. Therefore, the results of these treatments should be carefully interpreted, because the cause of this variation is not known.
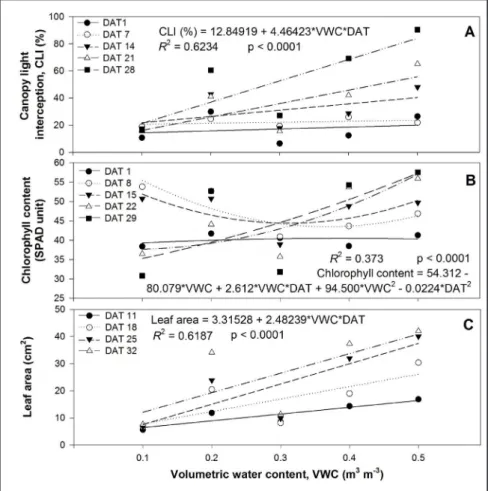
The variables shown in Figure 5 were measured weekly. They were subjected to the prediction model
flow production of petunias and begonias as affected by fertilizers with different phosphorus content. HortScience 36: 282-285. KIM J; VAN IERSEL MW; BURNETT SE. 2011. Estimating daily water use of two petunia cultivars based on plant and environmental factors. HortScience 46: 1287-1293. NEAL CA; HENLEY RW. 1992. Water use
and runoff comparisons of greenhouse irrigation systems. Proceedings of Florida State Horticultural Society 105: 191-194. NEMALI KS; MONTESANO F; DOVE SK;
VAN IERSEL MW. 2007. Calibration and performance of moisture sensors in soilless substrates: ECH2O and Theta probes. Scientia
Horticulturae 112: 227-234.
OH MM; SON JE. 2008. Phytophthora nicotianae
transmission and growth of potted kalanchoe in two recirculating subirrigation systems.
Scientia Horticulturae 119: 75-78.
PENNISI SV; VAN IERSEL MW; BURNETT SE. 2005. Photosynthetic irradiance and nutrition effects on growth of English Ivy in subirrigation systems. HortScience 40: 1740-1745.
RICHARDS DL; REED DW. 2004. New Guinea impatiens growth response and nutrient release from controlled-release fertilizer in a recirculating subirrigation and top-watering system. HortScience 39: 280-286.
ROUPHAEL Y; CARDARELLI M; REA E; BATTISTELLI AC. 2006. Comparison of the subirrigation and drip-irrigation systems for greenhouse zucchini squash production using saline and non-saline nutrient solutions.
Agricultural Water Management 82: 99-117. ROUPHAEL Y; COLLA G. 2005. Growth,
yield, fruit quality and nutrient uptake of hydroponically cultivated zucchini squash as affected by irrigation systems and growing seasons. Scientia Horticulturae 105: 177-195. UVA WL; WEILER TC; MILLIGAN RA. 1998. A survey on the planning and adoption of zero runoff subirrigation systems in greenhouse operations. HortScience 33: 193-196. VAN IERSEL MW; DOVE S; BURNETT SE.
2011. The use of soil moisture probes for improved uniformity and irrigation control in greenhouses. Acta Horticulturae 893: 1049-1056.
VAN IERSEL MW; NEMALI KS. 2004. Drought stress can produce small but not compact marigolds. HortScience 9: 1298-1301. Aparecida dos Santos Soranz for
technical collaboration and Capes Foundation (Ministry of Education,
Brazil) for scholarships to the first author
as research scholar and postdoctoral researcher at the University of Georgia (Proc. BEX 1390/10-4 and BEX 2620/13-8). Funding for this research was provided by American Floral Endowment and USDA-NIFA-SCRI (grant no. 2009-51181-05768).
REFERENCES
BIERNBAUM JA. 1990. Get ready for subirrigation. Greenhouse Grower 8: 130-133. BURNETT SE; VAN IERSEL MW. 2008.
Morphology and irrigation efficiency of
Gaura lindhiemeri grown with capacitance sensor-controlled irrigation. HortScience 43: 1555-1560.
COBOS DR; CHAMBERS C. 2012, 24 de dezembro. Calibrating ECH2O soil moisture sensors. Disponível em: http://www.decagon. com/education/calibrating-ech2o-soil-moisture-sensors-13393-04-an.
DOLE JM; COLE JC; VON BROEMBSEN SL. 1994. Growth of poinsettias, nutrient leaching,
and water-use efficiency respond to irrigation
methods. HortScience 29: 858-864.
DUMROESE RK; PINTO JR; JACOBS DF; DAVIS AS; HORIUCHI B. 2006. Subirrigation reduces water use, nitrogen loss, and moss growth in a container nursery. Native Plants Journal 7: 253-261.
FERRAREZI RS; VAN IERSEL MW. 2011. Monitoring and controlling subirrigation with soil moisture sensors: a case study w i t h h i b i s c u s . I n : S N A R E S E A R C H CONFERENCE, WATER MANAGEMENT SECTION. Proceedings… Mobile/AL: Southern Nursery Association. 56: 187-191. GARLAND KF; BURNETT SE; DAY ME; VAN
IERSELVAN IERSELIERSEL MW. 2012.
Influence of substrate water content and daily
light integral on photosynthesis, water use efficiency, and morphology of Heuchera americana. Journal of the American Society for Horticultural Science 137: 57-67. HODGES AW; HALL CR; BEHE BK; DENNIS
JH. 2008. Regional analysis of production practices and technology use in the U.S. nursery industry. HortScience 43: 1807-1812. JAMES E; VAN IERSEL MW. 2001. Ebb and based on the main effects of VWC,
DAT and their interactions. The light interception by the canopy (Figure 5A, p<0.0001) increased with the increase in VWC, result of greater leaf area provided by more water available for growth. The partial r-square was 0.6234 for the interaction VWC×DAT. The relative chlorophyll content was significant (Figure 5B, p<0.0001), however the range of the results reduced the participation of the partial r-square components: VWC = 0.0585, VWC×DAT = 0.1658, VWC2 = 0.0366 and DAT2 = 0.1124. As expected, an increase in leaf area over time due to the increase in VWC was noticed (Figure 5C, p<0.0001), due to the increase in the amount of water available for plants. This fact can be proved because this response was entirely due to the interaction VWC×DAT (R2 = 0.6187). This result is consistent with the plant growth curves showed in Figure 4, and in accordance with Ferrarezi & van Iersel (2011), which carried out a study using similar conditions in hibiscus.
The authors conclude that the use of
capacitance sensors is an efficient way
to monitor moisture and subirrigation control in substrates to cultivate salvia in greenhouses, reducing the possibility of water stress caused by daily irrigations using timers. The increase of VWC in the substrates increased the shoot dry weight and vegetative and reproductive fractions, number of leaves and branches, shoot height, leaf area, light interception by the canopy, and relative chlorophyll content. Due to the higher plant growth, the treatment 0.5 m3 m-3 showed to be the best for salvia production using subirrigation.
ACKNOWLEDGEMENTS