Spatial Modeling
Antônio José C. Rodrigues1, Tiago G. S. Carneiro1, Pedro R. Andrade2
1 TerraLAB - Earth System Modeling and Simulation Laboratory, Computer Science Department,
Federal University of Ouro Preto (UFOP), Ouro Preto - MG - Brazil [email protected], [email protected]
2 Earth System Science Center (CCST), National Institute for Space Research (INPE),
São José dos Campos - SP - Brazil [email protected]
Abstract. This article presents research results of an extensible visualization pipeline for real-time exploratory analysis of spatially explicit simulations. We identify software requirements and discuss the main conceptual and design issues. We propose a protocol for data serialization, a high performance monitoring mechanism, and graphical interfaces for visualization. Performance experiments show that combining multithreading and the Blackboard design pattern reduces the visualization response time by 80%, with no significant increase in memory consumption (less than 7%). The components presented in this article have been integrated in the TerraME modeling platform for simulation of terrestrial systems.
Categories and Subject Descriptors: D.1 [Programming Techniques]: Miscellaneous; I.6 [Simulation and Model-ing]: Miscellaneous; C.4 [Performance of Systems]: Measurement techniques
Keywords: scientific visualization pipeline, environmental modeling, high-performance, computer simulation, TerraME Observer
1. INTRODUCTION
Computer modeling of environmental and social processes has been used to carry on controlled experi-ments to simulate the effects of human actions on the environment and their feedbacks [Schreinemach-ers and Berger 2011]. In these studies, simulated scenarios analyze issues related to the prognosis of amount and location of changes, which may support decision-making or public policies. Computer models are in general dynamic and spatially explicit [Sprugel et al. 2009; Wu and David 2002], using different types of geospatial data as inputs, such as remote sensing images and digital maps.
Dynamic spatially explicit models to study nature-society interactions, hereinafter referred as envi-ronmental models, are capable of generating a huge amount of spatiotemporal data along simulations. In addition, before any experiment, the implementation of models needs to be verified in order to fix logic errors. The sooner such problems are found, the sooner the implementation can be con-cluded. Verification of the source code and interpretation of simulation results can be more efficiently performed with the support of methods and tools capable of synthesizing and analyzing simulation outputs.
Visualization components of environmental modeling platforms differ in the way they gather, se-rialize, and transmit state variable values of the simulation to graphical interfaces. Such platforms
The authors would like to thank the Postgraduate Program in Computer Science and the TerraLAB modeling and simulation laboratory of the Federal University of Ouro Preto (UFOP), in Brazil. This work was supported by the CNPq/MCT grant 560130/2010-4, CT-INFO 09/2010.
may provide high-level languages to implement models or may be delivered as libraries for model development in general purpose programming languages. In the latter situation, as in Swarm and Repast platforms, state variable values are available within the same runtime environment of graphi-cal interfaces [Minar et al. 1996; North et al. 2006], making data gathering easier and faster. In the platforms that use embedded languages, such as NetLogo and TerraME, state variables are stored in the memory space of the embedded language and need to be copied to the memory space of the graphical interfaces, which are implemented in another language [Tisue and Wilensky 2004; Carneiro 2006]. This way, once collected, data needs to be serialized and transmitted according to a given protocol. In the same way, data received by the graphical interface needs to be decoded before being handled properly. As environmental modelers are usually specialists in a given application domain (biology, ecology, etc.) and commonly do not have strong programming skills, this work focuses on modeling platforms that follow the second architecture.
As environmental simulations may deal with huge amounts of data, there might also be a significant amount of data that need to be transferred, which in turn can make the tasks of gathering, serializing, and transmitting data very time consuming. Land use change modeling studies represent geographical spaces using thousands or millions of regular cells in different resolutions, whose patterns of change need to be identified, analyzed, and understood [Moreira et al. 2009]. In these cases, the simulation could run on dedicated high-performance hardware, with its outputs displayed on remote graphical workstations. Therefore, it might be necessary to transfer data from one process in this pipeline to the next through a network.
The main hypothesis of this work is that combining software design patterns and multithreading is a good strategy to improve visualization response times of environmental models, keeping the platform simple, extensible, and modular. This work presents the architecture of a high performance pipeline for the visualization of environmental models. It includes high-level language primitives to define and update visualizations, a serialization protocol, a monitoring mechanism for data gathering and transmission, and several graphical interfaces for data visualization. This architecture has been implemented and integrated within the TerraME modeling and simulation platform [Carneiro et al. 2013].
The remainder of the article is organized as follows. TerraME modeling environment is introduced in Section 2. Related works are presented in Section 3. Section 4 describes the architecture and implementation of the visualization pipeline, while experiments results are presented and discussed in Section 5. Finally, in Section 6, we present the final remarks and future work.
2. TERRAME MODELING AND SIMULATION PLATFORM
Ter-Fig. 2. Monitoring mechanism, structured according to the Observer design pattern.
raME models directly in C++ or in Lua [Ierusalimschy et al. 1996]. TerraME provides several types of objects to describe temporal, behavioral, and spatial components of models. Cell, CellularSpace, andNeighborhood types are useful for describing the geographical space. Agent,Automaton and Tra-jectories types represent actors and processes that change spatial properties. Timer andEvent types control the simulation dynamics. During a simulation, the Lua interpreter embedded within TerraME activates the simulation services from the C++ framework whenever an operation needs to be per-formed over TerraME objects. TerraLib library is used for exchanging geospatial data with relational database management systems [Câmara et al. 2000]. The traditional way to visualize outcomes of simulations in TerraME is by using the geographical information system TerraView, built upon Ter-raLib. However, TerraView cannot monitor the progress of simulations in real-time as it only loads data already stored in a geospatial database.
3. RELATED WORK
This section compares the most popular simulation platforms according to the visualization services of simulation outcomes, including the extensibility of such interfaces. Almost all environmental model-ing platforms provide graphical interfaces for visualization. However, their visualization components work as black boxes and their architectural designs have not been published. Swarm and Repast are multi-agent modeling platforms available as libraries for general purpose programming languages [Minar et al. 1996; North et al. 2006]. They provide a set of classes for monitoring and visualization. New graphical interfaces can then be implemented by inheritance. Their monitoring mechanism peri-odically updates interfaces in an asynchronous way. The simulation runs in parallel with visualization interfaces, without needing to wait for the interface to be updated.
Fig. 3. Monitoring mechanism general architecture
programming language. Model structure and rules are translated into source code written in a general purpose programming language, which is finally compiled. Communication between simulation and graphical interfaces is also asynchronous. Graphical interfaces can be periodically updated or explicitly notified by the implementation.
4. ARCHITECTURE AND IMPLEMENTATION
This section describes the architecture of the visualization pipeline and its implementation. We start by identifying the main requirements of a visualization pipeline for environmental models.
4.1 Software Requirements
Some requirements have been considered essential to a visualization pipeline for real-time exploratory analysis of spatially explicit dynamic models. They are:
—Functional requirements: graphically present the dynamics of continuous, discrete and spatial state variables; provide visualizations to the temporal, spatial and behavioral dimensions of an environ-mental model; graphically display the co-evolution of continuous, discrete and spatial state variables so that patterns can be identified and understood.
—Non-functional requirements: present real-time changes in state variables with minimum impact on the simulation performance; enable the monitoring mechanism to be extensible so that new visualizations can be easily developed by the user; keep compatibility with models previously written without visualizations.
4.2 Monitoring Mechanism Outline
The visualization pipeline presented in this article consists of three main stages: recovery, decoding, and rendering. The recovery stage accesses the internal state of a subject in the high-level language and serializes it through the protocol described in section 4.3. The decoding stage deserializes the data. Finally, the rendering stage generates the resulting image, as shown in Figure 1.
its subject. Then, the state of the subject is serialized and transferred to the observers in order to render the graphical interface.
Graphical interfaces and state variables might potentially exist in the memory space of different processes. In TerraME, state variables are stored in Lua during the simulation, with observers being defined in the C++ simulation core, as illustrated in Figure 3. Each observer is implemented as a light process (thread), preventing interfaces from freezing due to some heavy CPU load. The Black-board software design pattern has been integrated within the monitoring mechanism to intermediate communication between subjects and observers [Buschmann et al. 1996]. Blackboard acts as acache
memory shared by observers in which the state recovered from the subjects is temporarily stored to be reused by different observers. This way, it belongs to the same processes of the observers. This strategy aims to reduce the processing time involved in gathering and serializing state variable values, as well as the communication between subjects and observers.
4.3 Serialization Protocol
Observers are loosely coupled to their subjects. The communication between them is performed through the serialization protocol, whose message format is described using the Backus-Naur formalism as follows. The Backus-Naur formalism is a metalanguage used for syntactic description of context-free languages, communication protocols, and others [Apparao et al. 2003; Fielding et al. 1999; McCracken and Reilly 2003].
< subject > ::= < subject identifier > < subject type > < number of attributes > < number of internal subjects > [* < attribute > ] [* < subject > ] < attribute > ::= < attribute name > < attribute type > < attribute value >
A subject has a unique ID, characterized by its type and an optional sequence of attributes. It is recursively defined as a container of several optional internal subjects. This protocol allows the
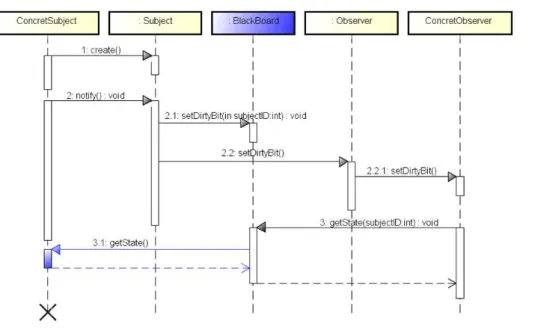
Fig. 5. Sequence diagram of monitoring mechanism interaction between Observer pattern and Blackboard design patterns
serialization of either the complete subject or only the changed parts, saving communication and processing time. Extending TerraME with new observers only requires rendering their content, no matter how subjects have been implemented.
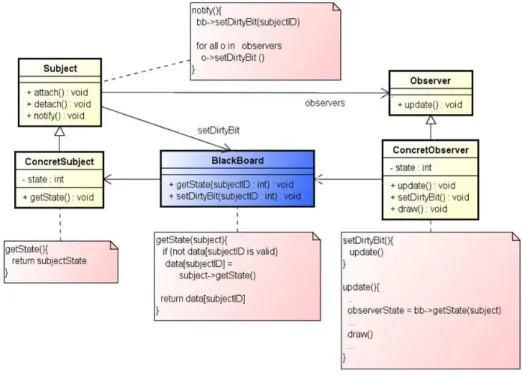
4.4 Detailed Structure of Monitoring Mechanism
Figure 4 depicts the class diagram of the monitoring mechanism and Figure 5 shows how the inter-actions between objects of these classes take place. Adirty-bit has been added to each element in the blackboard and to each observer. It indicates whether the internal state of the associated subject has changed, pointing out that such objects need to be updated to reflect the new state. Thus, when the simulation notifies the observers concerning changes in a subject, this notification only sets the dirty-bits to true. When an observer requests data about a dirty subject stored in the blackboard, the latter first updates itself, sets its dirty-bit to false, and then forwards the data to the observer. All other observers that need to be updated will find the data already decoded, updated, and stored in the blackboard. This way, a subject is serialized only once, even when there are many observers linked to it. After rendering the new subject state, an observer sets its dirty-bit to false to indicate that the visualization is updated.
4.5 TerraME Observers
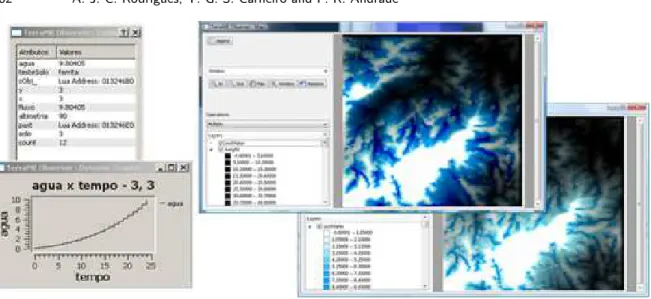
Fig. 6. Different types of TerraME observers: dynamic tables, charts and maps
4.6 Monitoring Mechanism Programming Interface
In order to create an observer and attach it to a subject, the modeler must explicitly declare an
Observer object. The following command creates the “myObs” observer to monitor the attribute calledsoilWater from the subject “myCell”:
myObs = Observer{ type = “chart” subject = myCell,
attributes = “soilWater” }
The parametertypeis a string indicating which observer will be used, while the parametersubject
represents the TerraME object that is going to be observed. Each type of subject can be visualized by a predefined set of observer types. The parameterattributesis a vector of strings that represent the attributes of the subject that are going to be observed. Once created, the observer is ready to display the states of its subject. Each time the modeler wants to visualize the changes of a subject, rendering all observers linked to it, he must explicitly call the functionnotify()of the respective subject. There are also some optional parameters that depend on the type of the observe. They can be used to configure the display, such as font size and labels for axis, as well as output location, such as filename or port.
The architecture presented is extensible to allow the modeler to create new observer types, extending the C++ abstract class namedObserver and is flexible to visualize different types of model component though inheritance of abstract class calledSubject.
5. PERFORMANCE ANALYSIS
Some experiments were conducted to evaluate the performance of the visualization pipeline. The idea is to measure the memory consumption and the response time involved in visualization interface updating and the number of bytes transmitted through the pipeline. The experiments help to identify system bottlenecks, depicting the required time for each stage of the visualization pipeline. The initial results of this work was published by Rodrigues et al. [2012]. The response time includes:
high-(6) Waiting time, the time that elapses between the subject calling the notification function (and so requesting all observers to be updated) and the request being performed by the first observer.
Experiments were performed in a single machine, a 64 bits Xeon with 32 GBytes of RAM using Windows 7. Each experiment was executed 10 times, and then averages of the memory consumption, the response time, and the amount of transmitted bytes were evaluated. In each experiment, 100 simulation steps were executed and observers were updated at the end of each step.
Four experiments were performed, varying the number of monitored attributes of a given subject
and the number of observers. AsCellularSpace subjects usually represent vast geographical regions as grids of cells and each cell (Cell) is characterized by several attributes, they are often the largest subjects of the model in terms of data volume. Thus, all experiments have considered only the visualization of this kind ofsubject. The experiment considered aCellularSpacecontaining 10000 cells and was divided into Test 1 and Test 2. In Test 1, theCellularSpace visualized by 2 map observers monitoring 3 attributes, while in Test 2 theCellularSpaceis visualized by 12 map observers monitoring 13 attributes.
This workload evaluates the effect of using blackboard to recover data, reducing the communi-cation channel by reusing the decoded data and Bag of Tasks to improve the performance with a multithreading mechanism [Beaumont et al. 2008; Benoit et al. 2010], thus reducing the waiting time. Two implementations of communication protocols were developed. The first is implemented directly in the recovery stage, and the second uses Google Protocol Buffers. Protocol Buffers technology (http://code.google.com/protobuf) is being developed by Google to replace the Extensible Markup Language (XML) as a strategy for transmitting data structures.
Figure 7 presents the results comparing the simulations with and without blackboard (BB) as cache memory and blackboard plus Protocol Buffer (ProtBuffer). It shows that the blackboard reduces significantly the number of serialized bytes (Test 1 in 47% and Test 2 in 58%), because attributes are serialized in the first data request and subsequent observers retrieve this data directly from the cached blackboard. The Protocol Buffer combined with blackboard achieved a greater reduction: 69% in Test 1 and 74% in Test 2), because in this technology there is no need to use atoken as delimiter of serialized values.
Figure 8 shows the average memory consumption of each test. It is possible to see that using blackboard does not cause any significant increase in memory consumption, less than 6.5%.
Fig. 7. Amount of raw data transmitted per notification in each experiment.
Fig. 8. Average memory consumption of each experiment.
Fig. 9. Average response time Test 1.
Fig. 10. Average response time Test 2.
the average response time of the visualization service is reduced by approximately 10%.
6. FINAL REMARKS
time with no significant increase in memory consumption. The developed graphical interfaces are able to render discrete, continuous and spatial state variables of environmental models written in Ter-raME, rendering instances of all TerraME types. Visualizations are also able to graphically display the co-evolution of state variables, allowing the understanding of how a variable influences each other and help identify some logic faults. The monitoring mechanism can be easily extended by inheritance. New observers can also be created using the same mechanism. The new visualization capabilities added to TerraME do not affect models previously written in this modeling platform, maintaining backward compatibility. Consequently, the proposed visualization mechanism satisfies all functional requirements stated in Subsection 4.1.
Future works will include a synthesis stage to the visualization pipeline. In this new stage, it will be possible to apply filters and statistical operations to raw data to make data analysis easier. Future works will also explore the use of Lua language compilers to reduce recovery time and to improve the serialization protocol when implemented using the Protocol Buffers. Other experiments will evaluate the impact of the blackboard and of compression algorithms in a client-server version of the proposed visualization mechanism. Initial evaluation of the client-server version has shown that the use of blackboard on the client side reduces the exchange of messages by half using TCP protocol. Finally, experiments will be conducted to quantitatively compare the visualization mechanisms of the most relevant modeling platforms with the one presented in this work.
REFERENCES
Apparao, V.,Ceponkus, A.,Cotton, P.,Ezell, D.,Fallside, D.,Gudgin, M.,Hurley, O.,Ibbotson, J.,
Milowski, R. A.,Mitchell, K.,Moreau, J.-J.,Newcomer, E.,Nielsen, H. F.,Lojek, B.,Nottingham, M.,Sadiq, W.,Williams, S.,and Yassin, A. XML Protocol (XMLP) Requirements, W3C Note. http://www. w3.org/TR/xmlp-reqs/, 2003.
Beaumont, O.,Carter, L.,Ferrante, J.,Legrand, A.,Marchal, L.,and Robert, Y. Centralized Versus Distributed Schedulers for Bag-of-Tasks Applications.IEEE Transactions on Parallel and Distributed Systems19 (5): 698–709, 2008.
Benoit, A.,Marchal, L.,Pineau, J.-F.,Robert, Y.,and Vivien, F.Scheduling Concurrent Bag-of-Tasks Appli-cations on Heterogeneous Platforms.IEEE Transactions on Computers59 (2): 202–217, 2010.
Buschmann, F.,Meunier, R.,Rohnert, H.,Sommerlad, P.,and Stal, M.Pattern-oriented Software Architecture: a system of patterns. John Wiley & Sons, Inc., 1996. ISBN: 0471958697.
Câmara, G.,Souza, R.,Pedrosa, B.,Vinhas, L.,Monteiro, A. M.,Paiva, J. a., Carvalho, M. T., and Gattass, M. Terralib: technology in support of GIS innovation. InBrazilian Symposium on Geoinformatics. São Paulo, SP, 2000.
Carneiro, T. G. d. S.Nested-CA: um fundamento para a modelagem de uso e cobertura do solo em múltiplas escalas. Ph.D. thesis, INPE - Instituto Nacional de Pesquisas Espaciais, Brazil, Computação Aplicada, 2006.
Carneiro, T. G. d. S., de Andrade, P. R.,Câmara, G., Monteiro, A. M. V., and Pereira, R. R. An Extensible Toolbox for Modeling Nature-Society Interactions.Environmental Modelling & Software46 (0): 104–117, 2013.
Fielding, R.,Gettys, J.,Mogul, J.,Frystyk, H.,Masinter, L.,Leach, P.,and Berners-Lee, T. RFC 2616, Hypertext Transfer Protocol – HTTP/1.1, 1999.
Gamma, E.,Helm, R.,Johnson, R.,and Vlissides, J. Design Patterns: elements of reusable object-oriented software. Addison-Wesley Professional, 1995.
Ierusalimschy, R.,Figueiredo, L. H.,and Filho, W. C. Lua - an extensible extension language. Software -Practice & Experience26 (6): 635–652, 1996.
McCracken, D. D. and Reilly, E. D.Backus-naur Form (BNF). InEncyclopedia of Computer Science. John Wiley and Sons Ltd., Chichester, UK, pp. 129–131, 2003.
Minar, N.,Burkhart, R.,Langton, C.,and Askenazi, M. The Swarm Simulation System: a toolkit for building multi-agent simulation. Report No. 96-06-042. Santa Fe, NM: Santa Fe Institute, 1996.
Moreira, E.,Costa, S.,Aguiar, A.,Câmara, G.,and Carneiro, T. G. d. S.Dynamical Coupling of Multiscale Land Change Models.Landscape Ecology24 (9): 1183–1194, 2009.
Wood, J.,Kirschenbauer, S.,Dner, J.,Lopes, A.,and Bodum, L. Using 3D in Visualization. In Exploring Geovisualization, J. Dykes, A. M. Maceachren, and M.-J. Kraak (Eds.). Elsevier, 14, pp. 295–312, 2005.
Wooldridge, M. J. and Jennings, N. R. Intelligent Agents: theory and practice. Knowledge Engineering Re-view10 (2): 115–152, 1995.
Wu, J. and David, J. L.A Spatially Explicit Hierarchical Approach to Modeling Complex Ecological Systems: theory and applications.Ecological Modelling153 (1-2): 7–26, 2002.