Universidade do Minho
Escola de Engenharia
Gabriel Ivan da Silva Rosa Neco da Mota
14
Gabriel Ivan da Silva Rosa Neco da Mo
ta
Detection of Fraud Patterns in Electronic
Commerce Environments
De tection of Fraud P atterns in Electronic Commerce EnvironmentsMaster Thesis
Master in Systems Engineering
Work made under the orientation of
Professor Doctor Orlando Manuel de Oliveira Belo
Universidade do Minho
Escola de Engenharia
Gabriel Ivan da Silva Rosa Neco da Mota
Detection of Fraud Patterns in Electronic
Commerce Environments
DECLARAÇÃO Nome
Gabriel Ivan da Silva Rosa Neco da Mota Endereço Eletrónico [email protected] Telefone Cartão do Cidadão 13420776 Título da dissertação
Detection of Fraud Patterns in Electronic Commerce Environments Orientador
Professor Doutor Orlando Manuel de Oliveira Belo Ano de conclusão
2014
Designação do Mestrado
Mestrado em Engenharia de Sistemas
É AUTORIZADA A REPRODUÇÃO INTEGRAL DESTA DISSERTAÇÃO APENAS PARA EFEITOS DE INVESTIGAÇÃO, MEDIANTE DECLARAÇÃO ESCRITA DO INTERESSADO, QUE A TAL SE COMPROMETE.
Universidade do Minho, _____/_____/_________ Assinatura:
Acknowledgments
This thesis was the result of a lot of hours of hard work, which included reading a ton of books and articles, a lot of programming, and writing… and more writing… and then, re-writing! All this process, with its ups and downs and some setbacks along the way, was not easy and in a few occasions I wondered if was all of this worth and if I had what it take to not only finish it, but also do a good work. Now looking back, to have thought this, seems ridiculous. The work is done, I feel very satisfied with it and also it doesn’t even look like it was that hard… but in the end, after everything is done, it never does.
To have gotten to this point was only possible because of the support of several persons, but one in particular, my teacher and my thesis supervisor, Professor Orlando Belo. I want to thank you for all your patience and availability, for all the hours spent around this, discussing and analyzing it and for all the work and revisions done, even under strict deadlines. Your guidance was truly invaluable.
My gratitude goes, of course, also to my parents. I know that despite always selling myself as the perfect son, in some occasions (very, very, very, rarely), I have given you some headaches.
Abstract
Electronic transactions (e-commerce) have revolutionized the way consumers shop, making small and local retailers, which were being affected by the worldwide crisis, accessible to the entire world. As e-commerce market expands, commercial transactions supported by credit cards - Card or Customer Not Present (CNP) also increases. This growing relationship, quite natural and expected, has clear advantages, facilitating e-commerce transactions and attracting new possibilities for trading. However, at the same time a big and serious problem emerge: the occurrence of fraudulent situations in payments. Fraud imposes severe financial losses, which deeply impacts e-commerce companies and their revenue. In order to minimize losses, they spend a lot of efforts (and money) trying to establish the most satisfactory solutions to detect and counteract in a timely manner the occurrence of a fraud scenario. In the e-commerce domain, fraud analysts are typically interested in subject oriented customer data, frequently extracted from each order process that occurred in an e-commerce site. Besides transactional data, all their behavior data e.g. clickstream data are traced and recorded, enriching the means of detection with profiling data and providing a way to trace customers behavior along time. In this work, a signature-based method was used to establish the characteristics of user behavior and detect potential fraud cases. Signatures have already been used successfully for anomalous detection in many areas like credit card usage, network intrusion, and in particular in telecommunications fraud. A signature is defined by a set of attributes that receive a diverse range of variables - e.g. the average number of orders, time spent per order, number of payment attempts, number of days since last visit, and many others - related to the behavior of a user, referring to an e-commerce application scenario. Based on the analysis of user behavior deviation, detected by comparing the user recent activity with the user behavior data, which is expressed through the user signature, it's possible to detect potential fraud situations (deviate behaviors) in useful time, giving a more robust and accurate support decision system to the fraud analysts on their daily job.
Keywords: Usage Profiling Over E-Commerce Systems, Fraud Detection And Prevention, Clickstream Processing, Signatures Based Methods, Fraud Detection Applications.
Resumo
As transações electrónicas (e-commerce) têm revolucionado a maneira como os consumidores fazem compras on-line, facilitando o acesso a partir de qualquer parte do globo, a retalhistas pequenos e locais, que estão a ser afectados pela crise mundial. À medida que o mercado do e-commerce se expande, transações comerciais suportadas por cartões de crédito – Cartão ou Cliente Não Presente (CNP) - também aumentam. Este crescimento natural e expectável apresenta claras vantagens, facilitando as transações e-commerce e atraindo novas possibilidades de negócio. Contudo, ao mesmo tempo, existe um grande e grave problema: a ocorrência de situações fraudulentas nos pagamentos. A fraude encontra-se associada a graves perdas financeiras, que têm um impacto profundo na receita de companhias de comércio electrónico. Grandes esforços (e dinheiro) são gastos numa tentativa de estabelecer soluções mais satisfatórias na detecção de casos de fraude em tempo útil, por forma a minimizar perdas. No domínio do e-commerce, os analistas de fraude estão tipicamente interessados em dados orientados ao consumidor, extraídos de cada uma das ordens de compra realizadas no site de comércio electrónico. Além dos dados transacionais, todos os dados comportamentais, i.e. dados clickstream, são guardados, enriquecendo assim os meios de detecção e garantindo uma forma de rastrear o comportamento dos consumidores ao longo do tempo. Neste trabalho utilizámos um método baseado na aplicação de assinaturas para estabelecer características comportamentais de consumidores e-commerce e assim, detectar potenciais casos de fraude. A aplicação de assinaturas foi já usada com sucesso na detecção de anomalias em diversas áreas, como a utilização de cartões de crédito, intrusão de redes e em particular, fraude em telecomunicações. Uma assinatura é definida por um conjunto de atributos que recebem um diverso leque de variáveis - e.g. número médio de encomendas, tempo de compra, número de tentativas de pagamento, número de dias desde a última visita, entre muitos outros – relacionados com o comportamento de um consumidor. Baseado na análise do desvio comportamental do consumidor, detectado através da comparação da sua atividade recente, com os seus dados comportamentais, expressados através da sua assinatura, é possível a detecção de potenciais casos de fraude (comportamentos díspares do habitual) em tempo real, garantindo assim um sistema mais robusto e preciso, capaz de servir de suporte à decisão aos analistas de fraude no seu trabalho diário.
Palavras-Chave: Perfis de Utilização em Sistemas E-Commerce, Detecção e Prevenção de Fraude, Processamento Clickstream, Métodos Baseados em Assinaturas, Aplicações para a Detecção de Fraude.
C
ONTENTS1. Introduction ... 2
1.1 Contextualization ... 2
1.2 Motivation and Objectives ... 3
1.3 Knowledge Discovery Through Data Mining ... 4
1.4 The CRISP Methodology ... 7
1.5 Thesis Structure ... 9
2. Fraud in E-Commerce Environments ... 11
2.1 Fraud Prevention Techniques ... 11
2.1.1 Identity Proofing ... 11 2.1.2 Guaranteed Payments ... 12 2.1.3 Operational Management ... 12 2.1.4 Data Quality ... 13 2.1.5 Technology ... 14 2.1.6 Analytics ... 14
2.2 A Typical Process of Fraud Detection ... 15
3. Analytical Exploration of Data ... 18
3.1 Classification ... 19 3.1.1 Decision Trees ... 20 3.1.2 K-Nearest Neighbor ... 20 3.1.3 Logistic Regression ... 21 3.1.4 Neural Networks ... 21 3.1.5 Bayesian Classifiers ... 22
3.1.6 Support Vector Machines ... 22
3.2 Segmentation ... 22
3.3 Association ... 24
3.4 Techniques Analysis ... 25
4.1 Signature Definition ... 27
4.2 Signature Update ... 27
4.3 Elements of a Signature ... 29
4.4 Detection of Anomalies ... 30
5. Signature-based Model for Fraud Detection and Prevention ... 32
5.1 Preparing and Exploring The Data ... 32
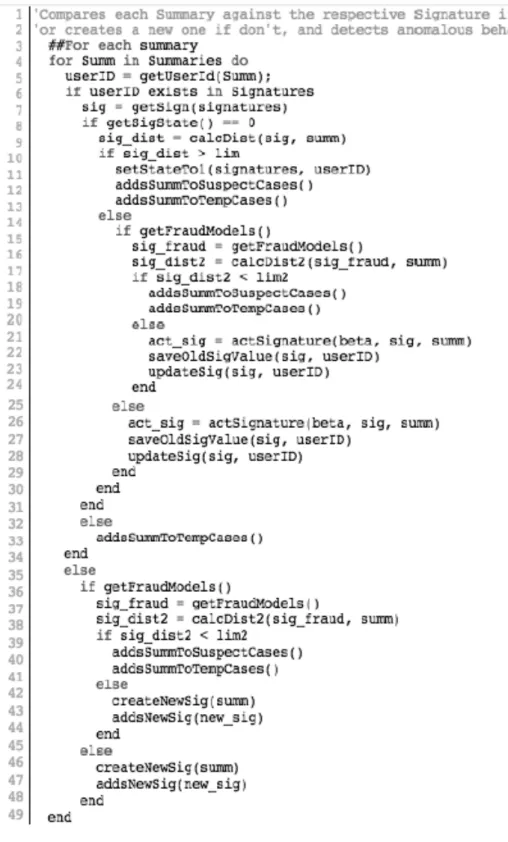
5.2 The Signatures Algorithm ... 34
5.3 Signature Classes ... 35
5.4 Signature Fraud Model ... 37
5.5 Anomalies Detection Process ... 37
6. Experimental Setup ... 39
6.1 Signature-based Models Evaluation ... 39
6.2 Random Forests and SVM Evaluation ... 40
7. Results Analysis ... 42
LIST OF FIGURES
Figure 1 - Flux of money in CNP transactions (Montague, 2010) ... 2
Figure 2 - Process of Knowledge Discovery in Databases ... 6
Figure 3 - Typical architecture structure necessary for the application of data mining techniques ... 7
Figure 4 - CRISP-DM Process Diagram ... 9
Figure 5 - High Level Fraud Process Diagram ... 17
Figure 6 - Illustration of the Variation of a Signature ... 29
Figure 7 - Example of a Fragment of a Record ... 30
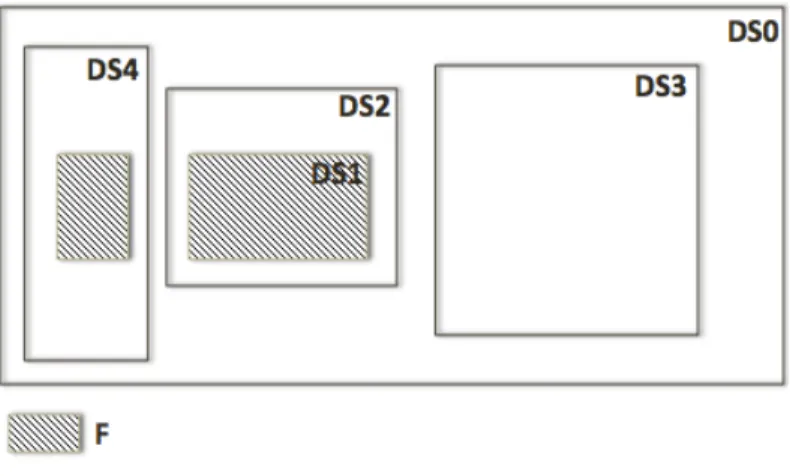
Figure 8 - The Datasets ... 33
Figure 9 - Signatures Processing Algorithm ... 35
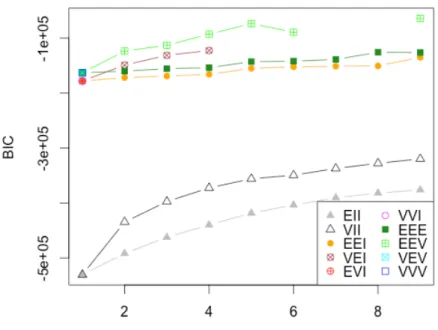
Figure 10 - BIC plot for number of components ... 37
Figure 11 - Random Forests Confusion Matrix ... 41
Figure 12 - SVM Confusion Matrix ... 41
Figure 13 - SVD left singular vectors ... 43
Figure 14 - Variables Impact ... 43
LIST OF TABLES
Table 1 –Features of a Signature. ... 29
Table 2 - "Number of Days Since Last Visit" Statistical Analysis. ... 30
Table 3 - Datasets Summary. ... 33
Table 4 - Range of Values for lim and lim2. ... 38
Table 5 - Signatures Models Performance. ... 40
L
IST OFA
BBREVIATIONS ANDA
CRONYMSBIC Bayesian Information Criterion
CNP Card/Customer Not Present
CRISP-DM Cross Industry Standard Process for Data Mining
CV Card Value
CVV2 Card Verification Value
DM Data Mining
DW Data Warehouse
E-Commerce Electronic Commerce
EM Expectation Maximization
KDD Knowledge Discovery in Databases
RF Random Forests
1. I
NTRODUCTION
1.1 Contextualization
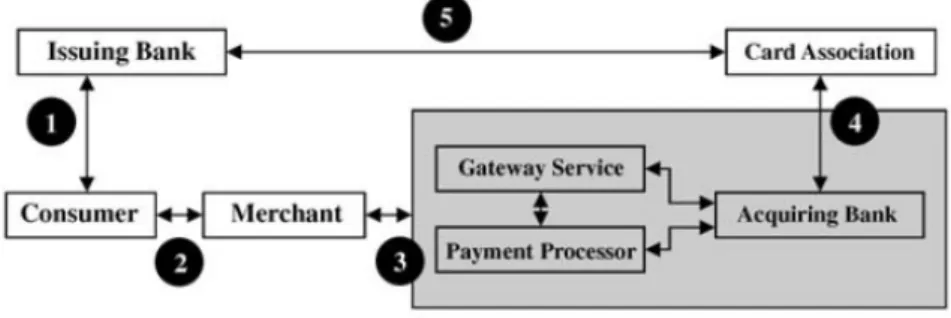
The electronic commerce industry (e-commerce) is in quick expansion at a global level. Nowadays a big majority of companies looks to get the biggest number of clients as possible, using means for disposing their services and products online. From small local companies to big multinationals, it is frequent to found projects for the placement of their businesses online. Advantages are obvious. However with the proliferation the online business, a big problem arose, that one way or another, all merchants must deal with in their business area: the occurrence of fraudulent situations in payments. Today the majority of online payments are done through da utilization of credit cards (Figure 1). These transactions are considered Card or Customer Not Present (CNP) (Turban et al., 2008)
. For merchants these types of transactions are one of the more problematic, since they are several times associated to concrete situations of fraud.
Figure 1 - Flux of money in CNP transactions – extracted from (Montague, 2011)
There are several entities involved in CNP transactions:
1. The consumer contacts an issuing bank and a credit card with a unique account number is issued for him.
3. The merchant proceeds to verify the credit card information provided by the customer, validating it through several tests and checks, sending the information to his bank (the acquiring bank) to find out if the consumer has money available on the card to make the purchase. At this point the merchant can use some intermediates, like a gateway service or a payment processor. Both of these act as a value-added middleman in the transaction process. 4. The acquiring bank sends the request through the card association to the
issuing bank for verifying credit.
5. If funds are available, the issuing bank places the correspondent amount aside, and a reply is sent back through the card association network to the acquiring bank, and then back to the merchant, informing the funds are available.
In most cases, the losses associated to the occurrence of fraud are supported entirely by the merchants themselves. Beside the monetary loss associated to the product, merchants have also to support the expenses of transport, in the case they exist, and the administrative costs related with the bank entity of the card associated to the fraud. Furthermore, merchants may even be subject to the payment of fees. Therefore, fraud cases can have a significant impact on companies business. To prevent this there are several techniques, services and tools available to merchants. One of these techniques is related with the development of specific data mining models. This thesis is focused around such topic.
1.2 Motivation and Objectives
Nowadays companies tend to store a lot of their data, even when most of it has no immediate or future use. Within this data there is information and knowledge that if correctly analyzed can improve business activities. The development of mining models of fraud prevention is highly dependent on the existence of such data, not only in quantity but also in quality. If these criterions are met then it is possible to get great benefits from the application of these models. This can not only lead to save companies money with the reduction of fraud situations, but also by decreasing the necessity of staff for manual reviews and the substitution of several other methods and techniques.
Seeing that, to any merchant the goal of applying any number of different techniques of fraud prevention is to find a balance point between the number of orders rejected and the number of
occurrences of fraud, in order to maximize the profits. The application of mining models can just very well help to meet such goals.
Others very important aspects related to fraud prevention, are the customer experience and the service provided, in which it is important to account that clients may feel insecure about disclosing confidential information. Also merchants must be aware that customers may not be willing to fill extensive forms or pass through the process of lengthy authentications. “The
goal is to optimize the risk/reward tradeoffs with customer experience and service”, said
Peter Martin, Director of Risk Consulting of Pay Pal. The execution of mining models is a process that should be invisible to the customer and so these customer related problems are not an issue.
With the elaboration of this thesis, the objective was to study several different mining models, pick some of those who were more appropriated for fraud prevention, and applying them to a set of real data, make a comparison and evaluation of the obtained results.
1.3 Knowledge Discovery Through Data Mining
Data Mining (DM) and Knowledge Discovery in Databases (KDD) are in great evolution and expansion, basing themselves in the premise that the data available can be a useful source of knowledge, with applicability in several domains. Data Mining can be resumed as the application of methods and techniques in databases, with the objective of finding tendencies or patterns in order to found knowledge (Santos & Azevedo, 2005).
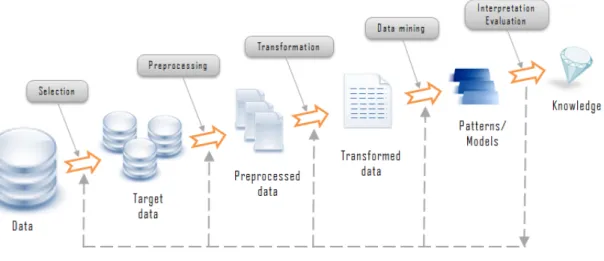
Usually a process of knowledge discovery in databases assumes the realization of several steps, namely: data selection, data preparation, data cleaning, incorporation of appropriate prior knowledge, and proper interpretation of the results of mining (Fayyad et al., 1996). In more detail:
1. Data selection: After learning and understand the domains of application, it is done the selection and collection of a group of data, or the search is focused in data samples, following some criteria.
2. Data cleaning and preprocessing: This step includes basic operations like the removal of noise and errors from data and the decision of the best strategy to take, in case of missing values or relevant information.
3. Data transformation: Basically this step consists in discovering useful characteristics that represent data, based on the final objective. Trough methods of reduction and transformation of dimensionality, the effective number of variables in consideration can be reduced, or invariable representations of data found. In this phase it becomes evident the use of a
Data Warehouse (DW), since in these structures the data are non volatile,
classified by subject and of historical nature, and so DW tend to become big repositories of data, extremely organized.
4. Data Mining: This stage can be divided in three sub phases. In an initial phase it is necessary to choose which data mining technique is best to apply, based on the final objectives of the process. After choosing the technique it is necessary to choose between the existent algorithms, paying special attention to the data in study and to the expected result. The last phase consists in the discovery of patterns of interest in a determined representative way or in a group of such representations.
5. Interpretation of the obtained results: This step includes the visualization of the extracted patterns and respective interpretation, the removal of irrelevant and/or redundant patterns, and the translation of the ones considered useful into information that should be easy to understand to common users. In case of necessity there is the possibility of going back to any of the previous steps. After obtaining the desired results, it is just left the incorporation of the discovered knowledge in the system performance and/or document and storing the obtained results.
The data mining component of a process of KDD involves repeated iterations of applications of particular methods. This happens due to the necessity of adjusting the algorithms parameters in order to get the best possible results, having in mind the method and algorithm used. Despite the importance of data mining in the global process, it is important to do not neglect the others processes, since only by executing them all, it is possible to obtain a credible final result with some practical impact. Shortly, in Figure 2 is presented all the KDD steps.
Figure 2 - Process of Knowledge Discovery in Databases – extracted from
http://www.rithme.eu/?m=resources&p=kdprocess&lang=en.
As referred, in order for the successful application of data mining, it is necessary that a consistent, integrated, clean and separated source of data exist. A data warehouse is thereby an ideal source of data. This is justified by the following:
• The consistency and quality of data is a prerequisite for mining, as a form of assuring the precision of the prevision models. DW are populated with clean and consistent data (Connolly & Begg, 2005).
• A DW guarantees the existence of data in a detailed and summarized way (Connolly & Begg, 2005). The presentation of data in this way is necessary when the objective of mining is to examine data in a more granular shape. The summarization of data guarantees that there is no necessity to repeat, in the beginning of each process of exploration, the realization of analysis done before.
• The results of techniques of data mining are very useful only if there is a way of investigating the discovered patterns. That is only possible through the historical analysis of data that allows the seasonal understanding of data. DW are responsible of storing historical information, allowing therefore the detection of patterns and tendencies through time, by the application of mining.
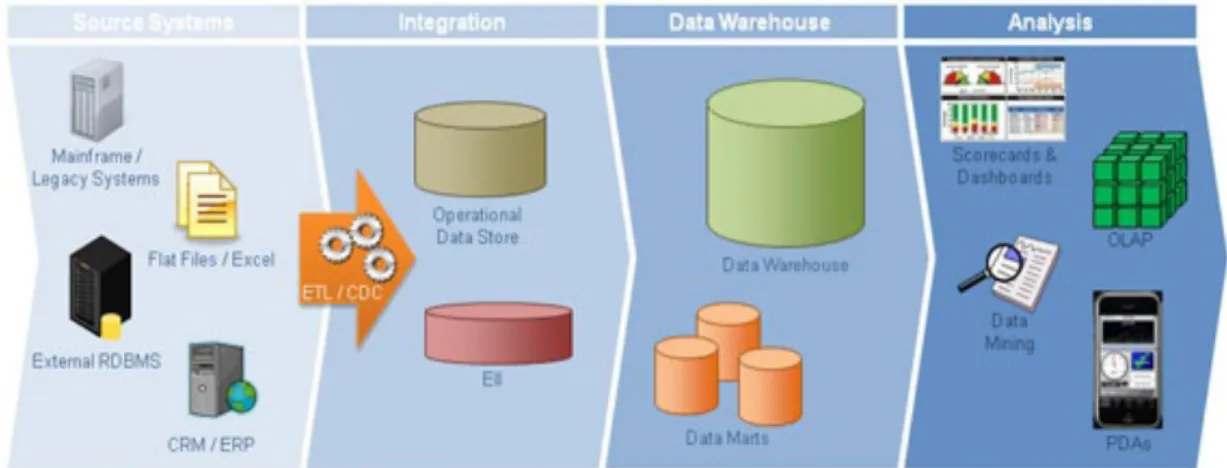
Thus, in general terms, a DW is a repository oriented specially for the support of the process of decision making, storing data from different operational sources. Besides, it is a repository of data that is built under the perspective of storing long-term information, keeping the information across a certain temporal period and assuring it evolution trough time. Figure 3
presents a typical functional architecture that is necessary for the application of data mining techniques.
Figure 3 - Typical architecture structure necessary for the application of data mining techniques – extracted from
http://deltechsolutionsinc.net/.
In summary, data mining is an interdisciplinary field bringing together techniques from machine learning, pattern recognition, statistics, databases and visualization. The application of such concepts as allowed the transformation of big volumes of information in valid and useful knowledge, through the discovery of fundamental truths in apparently random data (Sumathi et al. n.d.).
1.4 The CRISP Methodology
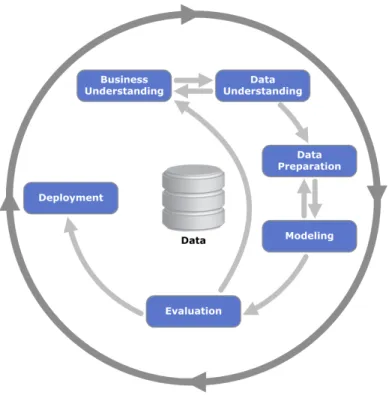
The CRISP-DM methodology foundations come from the theory, academic principles and also practical cases, based on the experience of those who develop data mining projects. Thus it has been incorporated practical knowledge used in the industry, in order to give answers to the requirements and necessities of users, and not focusing only in technology (Santos & Azevedo, 2005). Several steps, grouped into six main phases, characterize this methodology, namely:
1. Business understanding: This phase is focused on the analysis of the objectives and requirements of the project, from a business point of view. This knowledge is then converted into a data mining problem and a preliminary plan for the achievement of the objectives.
2. Data understanding: The study of data starts with the initial collection of data and then proceeds to their analysis as a way of detecting data quality problems or interesting subsets in order to form hypotheses for hidden information.
3. Data Preparation: In this phase are involved all the activities associated with the construction of the final dataset, the one that will be used in the modeling tool, considering the inevitable optimizations that it shall pass. It is important to have in mind that this can be the most time consuming phase of the project, since in general 80% of the time spent in projects whose objective is the extraction of knowledge, is related with the preparation of data (Adriaans & Zantinge, 1996).
4. Modeling: In the modeling phase several techniques are selected and their parameters adjusted so the best optimized results can be achieved. Typically in data mining there are several techniques that can be applied to the same type of problem. Some of them have specifics requirements to the form how the data should be presented. This can lead to the necessity of going back to the data preparation phase.
5. Evaluation: In this phase the objective is to evaluate the utility of the model or models, review the previous executed steps in their construction and verify if they allow to reach the business objectives, that is, verify if some point important to the business has not been considered.
6. Deployment: The creation of the model(s) does not mean necessarily the end of the project. The extracted knowledge needs to be organized e presented in a way the user can utilize it. This phase can be as simple as to generate a report or as complex as to implement the all data mining process, depending this on the requirements specified. Figure 4 shows the relationship between the different phases of a CRISP-DM process diagram:
Figure 4 - CRISP-DM Process Diagram – extracted from http://en.wikipedia.org/.
1.5 Thesis Structure
Beyond this chapter, eight other chapters comprise this document. Chapter 2 explores in detail the concept of fraud in E-Commerce environments. Several fraud prevention techniques are presented and explained, followed by a case example of a typical process of fraud detection. Then, in Chapter 3, the field of analytical exploration of data is addressed. Three most common and largely used data mining categories (Classification, Segmentation and Association) are explored, and a survey of several techniques inherent to each of those categories is presented, resulting in a brief analysis of each one and with an introduction to Signatures, a fairly recent technique which is the focus of this work. Chapter 4 explains in detail the concept behind signature-based methods, starting by its definition and update, followed by an explanation of the elements that can compose a signature and ending with a brief overview of the detection of anomalies process. The steps behind all the work-around, exploration and preparation of the data, such as the division of data into different datasets, each with specific purposes, are presented in Chapter 5. Next, in Chapter 6 the implementation of the developed signature-based model is explained. A detailed description of how the algorithm was developed, as well as the strategy adopted for the creation of the signature classes and the fraud model. This chapter ends with a detailed explanation of the process behind the detection of anomalies, previously seen in Chapter 4. Chapter 6 is
dedicated to the experimental setup of the developed signature model, as well as a results comparison with two widely known techniques, Random Forests and Support Vector Machines. Then, an analysis of the results obtained in this last chapter is done in Chapter 0. Finally, Chapter 8, which presents the conclusions withdrawn from this process of application of signature-based methods for fraud detection in E-Commerce environments, as well as the potential future work that can be in the scope of this technique, not only in fraud detection, but also in different fields.
2. F
RAUD IN
E-C
OMMERCE
E
NVIRONMENTS
2.1 Fraud Prevention Techniques
It is easily understood that despite the several obvious advantages of electronic commerce, there are a group of problems that can be ruinous to merchants, and which against they must prevent themselves. To do so, merchants can count on several techniques, services and methods. There are several fraud prevention techniques that can be applied in order to minimize losses. See for example, address and age verification, user authentication or reverse lookups, among others. These techniques together with more advanced ones, can be used to define a model of fraud prevention accordingly to the specificities of each business in particular. Merchants with high margins business can be more flexible in their politics of fraud prevention, while business where margins are small, need to concretize a larger volume of sales in order to compensate the nefarious effect of the occurrence of a fraudulent situation and so their politics of fraud prevention must be very restrictive even if that means to sometimes lose transactions that although valid, looked fraudulent. Next a few of these techniques are presented and briefly explained (Montague 2011).
2.1.1 Identity Proofing
The following techniques, methods and services can all be used in order to obtain more information about a customer and verify his identity.
• Address Verification Services - This is a tool provided by credit card associations and issuing banks that allow for merchants to check the submitted billing address to see if it is on file with the issuing bank.
• Advanced Address Verification - Advanced address verification, goes a little further by not only being able to check the billing address of the customer, but also the shipping address, e-mail address and phone number.
• Age Verification - Age verification is the attempt to determine the age of the consumer at the time of purchase. From a simple in-site check box, to the use of an external service, there are several ways for a merchant to implement this.
• Card Security Schemes - The Card Value (CV) or Card Verification Value (CVV2) are numbers that serve to verify that the consumer is in possession of the card. This helps to prevent fraud in situations where the fraudster may have acquired the card number, but is not in possession of the physical card and therefore unable to provide the extra set of security numbers printed on the back of the card.
• Deposit Check - Deposit Check is used to validate consumers by charging a small amount from their bank account and asking the consumer to validate that charge. • E-mail Authentication - In this process, the customer receives an e-mail with a link,
password or code that is used to validate and complete the sale.
• Reverse Lookups - The reverse lookup is used to crosscheck the address and phone information a consumer has provided with a third-party record.
It is important to note that some of these services are only available in certain countries and because of that their use can be very limited.
2.1.2 Guaranteed Payments
These types of guarantee are used in the same way as insurances, and may end up costing a lot to merchants. So they should be considered very carefully. To know:
• Escrow Services - By having a contract with an escrow service, the merchant inserts a middleman in the process, who is responsible for the delivery of the product, and may also collect the funds from the consumer. They are intended as neutral participants that ensure both parties are protected.
• E-commerce Insurance - Merchants may insure their orders to cover possible losses due to fraud, however this action can have a significant cost on margins and so unworthy.
2.1.3 Operational Management
There are a vast number of techniques and services that fall under this category. Most of these solutions are based on real-time decisions as well as providing access to third-party data and
• Authorization (Real Time) - The merchant makes a request to the consumer’ issuing bank in order to determine if sufficient money is available on the credit card used for payments. If there is, these funds are hold for the purchase.
• Bin Checks - The credit card number contains some useful information. The first six digits can be used to determine the card type (Visa, MasterCard, American Express, etc.), and the bank where the card was issued. With this information, the merchant can verify the country of the issuing bank and the address of the consumer.
• Lists - The use of lists (hot, warm and positive lists) serves to identify returning consumers and determine if they have had good or bad business in the past. Hot lists are used to reject customers who in the pass made orders that were associated with bad behavior like fraud or chargebacks. Warm lists are used to either reject or review orders from customers who have presented some problems in the past. Positive lists are used to identify great, trustworthy customers, whose orders can be most of the times automatically accepted.
• Internal Rules - Internal rules or heuristics are simple logic statements built into e-commerce engines, payment processing or order management systems, that look to see if a condition is present in order to catch potentially risk orders.
• Velocity of Use - Based on the number of associated transactions attempted, or the number of uses of a certain data element in a determined time frame, suspicious behavior may be discovered. For example, if a customer is trying in a short period of time to use several different credit cards, this may indicate that he is testing stolen numbers, trying to find one that is valid or not canceled.
• Velocity of Change - Similar to velocity of use, the objective of velocity of change is to detect suspicious behavior based on the number of changes between data elements on new transactions, with previous transactions. For example, if different phone numbers in a short period of time are associated to the same credit card number, this may indicate a suspicious behavior that should be analyzed.
Many of these methods need to be complemented with manual reviews, so that staff members can perform manual checks and decide if orders should be accepted or rejected, or if the consumer behavior is in fact suspicious and so he must be placed in a warm or hot list.
The purpose of data quality checks is to make sure the data provided by customers is valid, cleansed and standardized before being stored. They can be:
• Deliver Address Verification - This service is used to check if the address given by the customer is valid. This way the merchant has the guarantee that the customer did not forget any element of the address, like the door number for example, and that the goods will not be returned because the address is not deliverable.
• Mod 10 Check - With Mod 10 check, the credit card number the customer submitted is validated, by verification that it has the correct range and format and it is the type of credit card the customer says it is.
2.1.5 Technology
There are some technology-based tools in the marketplace that can be used to prevent fraud, although some are still uncommon and/or expensive, namely:
• Biometrics - Biometrics are used to identify an individual through a unique physical attribute, like for example fingerprints or retinal scans. Although very efficient, this type of technology is still very far from the common use.
• Geolocation - These services provides the merchant with information about the location of the consumer at the time of purchase, and can be used to detect suspicious orders, where for example, the customer gives a billing or shipping information very different from his location.
• Device Identification - The concept of device identification is related to the use of cookies. With this resource, every time a customer access from his computer to the merchant e-commerce platform, some information is registered, that can be used for comparison on later orders. So, if for example a fraudster uses multiple fake accounts to make orders, these would get noticed and could prevent any further damage. Although the use of cookies can be very useful, it is not foolproof, since they can simply be deleted.
• Smart Cards - This type of cards contain chips that can be used to verify the authenticity of the card, although not the authenticity of the customer, since one only needs to have the physical card. In some cases, the cards require the use of a PIN.
The development of mining models can be a very effective tool for fraud prevention, but its efficiency is highly related with other factors, such as the quality and quantity of the data that is available, along with the experience and capacity of the person who implements the model. Also, the investment in modeling can be substantial and so it is not common its use in small companies. Furthermore, the development of these models on a generic level that can be applied to different companies is very difficult, since it depends on the different characteristics of each company. In Chapter 0 this topic and some other specific techniques associated with it is addressed in more detail.
2.2 A Typical Process of Fraud Detection
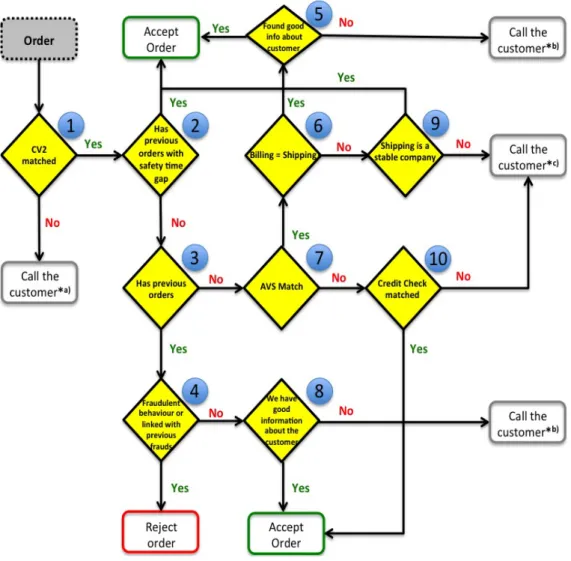
In Figure 5 it is visible a diagram that represents an example of the flow, on a high level, through which an order must pass, in order to be approved or refused. In this example there are several tests, represented by the diamonds numerated from 1 to 10. Each of these diamonds has only two possible outputs (yes or no). There are five diamonds that connect with the accept order case, and just one who leads to the rejection of the order. There are also five situations where the order is suspended and the customer contacted. The different motives regarding the contact are represented with by the superscript notation *a), *b) or *c)). An order must pass through at least two tests before being accepted, although this happens only in the best scenario situations.
Once an order is placed a CVV2 check is made (diamond 1). If the bank is unable to confirm the card verification valued, the customer is contacted*a) by the company staff, and it is explained that this information cannot be confirmed and the customer should place a new order once the existent one would be cancelled. Otherwise if the CVV2 check matches, then a new test (diamond 2) is made in order to verify if the customer has done previous orders. Not immediately previous orders that can not yet be confirmed to not be fraudulent, but orders in a recent enough gap, that were considered successful transactions. Passing this test, the order is accepted without further tests. Otherwise it is verified if the customer as any other previous orders (3), old or very recent ones, that do not fit in the gap defined in 2. If the customer has done previous orders, it is verified if he figures in an hot list, that is if any of those orders was considered to be fraudulent (4), in case of positive the order is rejected. If not a verification of the information available about the customer (8) is made. This information can be anything from verification if the customer was referred by another existent and trustworthy customer,
to an analysis that could include a verification of the customer address, phone number, bank accounts, and also a review of his Facebook profile, for example. All this with the purpose to determine if the customer can be trusted or not. If the information collected is good enough, then the order is accepted, else the customer is contacted*b) in order to obtain more details. In diamond 4, if the customer is new, which means that he has no previous orders, then an AVS check is done (7) to verify if the shipping address given match those associated with the credit card the customer used. In case there is a match, in diamond 6 it is verified if the shipping address is the same as the billing address, should this be the case and if there is good info about the customer (5), the order is accepted. Although if the shipping address differs from the billing, a verification is made (9) to verify if the shipping address belongs to a company where the customer can possibly work, since it is very common for customers to put their place of work address on orders, as most of the times they can not be home at the hour of delivery. In case the shipping address does indeed belong to a valid looking company, then the order is accepted, otherwise the customer is contacted*c) and the staff tries to understand the situation and in case of doubt asks for extra documents so more details can be confirmed. Back to diamond 7, if there is no match on the AVS check, then a special type of credit check is done (10), where it is done with a well know credit reference tool in the market that the company pays a monthly fee, and that offer tools where documents scans can be made to check if they were forged. Shall everything look ok in this step, and the order is accepted, otherwise the customer is contacted*c).
Figure 5 - High Level Fraud Process Diagram
It is important to note that this is just an example of a process of fraud detection with the purpose to characterize what can be considered a typical implementation. From company to company, these can greatly vary, due to the application of different techniques, tools and politics. Also, in this process not everything is automatized. Manual reviews are an important and fundamental part of it, as has been seen previously.
3. A
NALYTICAL
E
XPLORATION OF
D
ATA
From the several types of fraud that exist, in the next paragraphs we will be focus on credit card fraud, more precisely in CNP transactions, the most common on e-commerce environments. This type of fraud has the following characteristics that should be highlighted:
• Rarity - Fraud is rare. Identifying fraud is very difficult because of its rarity and its stealthy nature. In the overall transactions of a company or business, the amount of fraud should be very low, and so although it could be easy to develop a model with a very high overall accuracy, this model could steel be missing most of the fraud occurrences, and so not being very useful.
• Evolutionary - Fraud is constantly evolving as fraudsters adapt quickly to new situations and fraud detection models. Therefore fraud detection models have to be also in constant evolution, being able to respond to new methods of fraud.
• Necessity for large datasets - Due to the overall small number of fraud events in the global business of a company, in order to get a significant number of these occurrences, a big amount of data must be taken in consideration.
• Not always known - Sometimes fraud situations can be clearly identified and supervised analysis may be applied to model them. However, if fraud can not be identified up front, them unsupervised models are called for.
• Temporal dimension - When fraud occurred is very important to its detection. Historical data can provide some important information such as for example, highlight patterns of related events. Often in fraud models, the most powerful predictor variables are temporal in nature as are the most powerful fraud models built on historical data (Nisbet et al. 2009).
• Complexity: Due to the fraudster is need for stealth and secrecy, and the intentional obfuscation of the trail of evidence, in addition to data complexity, fraud events can be very complex.
On top of all, there are very few data sets and modeling details available that can be used as cases of study and guides to new implementations. The reason for that is related with to make
it harder for fraudster to get information, and also with the companies’ secrecy, who have no interest in reveling their methods, for obvious reasons.
A solution to the detection and prevention of fraud can pass through applying techniques of exploration and analysis of data with the objective of creating some sort of detection model adequate to the specific needs of the company, that can assist in detection of patterns common to fraudulent transactions. Through the combination of techniques and data mining algorithms, it can be possible to discover such patterns and tendencies as well as other anomalies that otherwise could not be visible with resource to conventional techniques (Lloyd-Williams et al., 1995). These techniques can be divided in two categories: supervised and unsupervised models. In the case of supervised models, the objective is to make the prevision of values based on a given group of input measures, while in the unsupervised models the objective pass through the discover of associations and patterns, also having a group of inputs. Within these models, the more common data mining techniques used for discovering patterns can be divided essentially into Association rules, Classification and Segmentation (Colet n.d.). Considering that nowadays a significant number of medium and large organizations related to activities of electronic commerce store their data in data warehouses, it makes sense their use as a primary source to the application of data mining techniques in fraud sceneries. In order for that to be possible, it is necessary to consider the application of adequate algorithms of association, segmentation and classification.
3.1 Classification
Classification is a supervised technique that consists in the attribution of instances or cases to a given group or class, by calculating the value of a categorical variable (Edelstein n.d.). For that, it is necessary that the analyst has knowledge about of how classes are defined. This means that it is necessary that a dataset denominated as training set exists, in which to each instance used to build the classifier, is associated the value of the attribute used to define the classes. The objective of a classifier is not to explore the data in order to found segments, but to decide how the new instances should be classified (Colet n.d.).
Before starting to use classification techniques, it is important to enhance what Nisbet et al. (2009) suggested about the appropriated steps that should be performed when using this specific technique:
1. Determine the type of the classification problem and the target classes. 2. Define the boundaries of each class.
3. Construct a set of decision rules from class boundaries.
4. Determine the prior-probability of each class, based on the frequency of occurrence of a class in the entire dataset.
5. If appropriate, determine the cost of making the wrong choice in assigning cases to a given class.
Some of the more well known techniques in classification are Decision Trees, K-Nearest Neighbors, Logistic Regression, Neural Networks, Bayesian Classifiers, and Support Vector Machines (SVM).
3.1.1 Decision Trees
The Decision Trees technique (Han & Kamber 2006) consists in the recursive partitioning of the available dataset, until each partition obtained contain mainly examples of a particular class. These hierarchical groups of relationships, organized into a tree-like structure, start with one variable called the root node. Then this node is split into two or more branches, each representing a separate class of the root node in case it is categorical, or specific ranges in case it takes continuous values. At each split the node that is split is called the parent node, and the resultant nodes are the child nodes. When a determined stopping rule is satisfied, the process ends. Decision Trees are well suited particularly for binary classification.
Within the topic of Decision Trees it is important to make reference to Random Forests. Decision Trees can be unstable and overly sensitive to specific training data (Bhattacharyya et al., 2011). Ensemble methods seek to address this problem. Random forests (RF) are an ensemble of classification trees. Therefore random forests perform well in situations where individual members are dissimilar. Another advantage of random forests is that they are robust to overfitting and noise in the data (Bhattacharyya et al., 2011).
3.1.2 K-Nearest Neighbor
K-Nearest Neighbor classifiers (Han & Kamber 2006) allow to find neighbors closer to the instance of test and assign them the more predominant class, from their closest k neighbors.
This algorithm although very simple to implement has several issues associated with it, namely:
• The inclusion of irrelevant parameters lowers the classification accuracy. A single parameter that has a random value for all instances can cause the algorithm to unable to separate the classes.
• Although categorical variables can be handled, they require special treatment, since the algorithm is designed to work primarily in numerical variables.
• Classification accuracy will also be degraded unless the variables scales are in proportion to their importance. Most of the times it very hard if not impossible to determine the importance of the parameters in relation to each other.
3.1.3 Logistic Regression
Logistic Regression (North 2012) has been widely applied in many type of problems that required classification of a binary outcome. This is a type of probabilistic statistical classification model, based on one or more predictor variables. It measures the relationship between a categorical dependent variable and one or more independent variables, which are usually (but not necessarily) continuous, by using scores as the predicted values of the dependent variable (Bhandari & Joensson 2008, p.293). Logistic Regression can be binomial when there are only two labels to classify or multinomial when there are more than two.
3.1.4 Neural Networks
Neural Networks (North 2012; Bishop 2006) are based in the creation of a data structure, done through a net of functions that pick one or more values and return as output the class that shall be assigned to the new instance. Several layers compose the architecture of a neural network, where the first layer serves as input and the last one as output. The layers between are called middle layers where weights assigned to each connection between each of these layers and the one immediately before them provide the capacity to model nonlinear relationships between the input and output nodes. The greater the number of nodes in the middle layers, the greater the capacity of recognizing nonlinear patterns in a dataset. As the number of nodes in the middle layers increases so does the training time in an exponentially way, and also the probability of overfitting.
3.1.5 Bayesian Classifiers
The Bayesian Classifiers technique (Aggarwal & Yu, 1999) assigns to a new instance the class to which that instance has more probability of belong to. These classifiers are based on the Bayes’ theorem, and assume that the effect of an attribute value on a given class is independent of the values of the other attributes. These classifiers, decision trees and neural networks have very similar performances, but in relation to speed, Bayesian classifiers are usually the more adequate to apply to large datasets.
3.1.6 Support Vector Machines
SVM (Hastie et al. 2009) are statistical learning techniques that have been found to be very successful in a variety of classification tasks. Several unique features of these algorithms make them specially suitable for binary classification problems like fraud detection (Bhattacharyya et al., 2011). SVM is a method for the classification of both linear and nonlinear data. Using a nonlinear mapping to transform the original training data into a higher dimension, SVM searches within this dimension for the linear optimal decision boundary, separating the tuples of one class from the other. SVM can be extremely slow, but they are highly accurate and the risk of overfitting the training set is minimum.
3.2 Segmentation
Segmentation (or Clustering) (North 2012) is an unsupervised data mining technique, whose objective is the separation of data in clusters of registries that share a same group of properties. Here, the objective is to find groups that differ one from another, as well as to find similarities between them. Unlike classification, in a process of segmentation the analyst does not know the initial segments, happening the same to the attributes that may be used to segment the data (Edelstein n.d.). The main idea behind segmentation is the identification of homogeneous groups of objects in which each group represents a class. Inside the same class objects should be similar and objects from different classes should obviously be considerably dissimilar. Han & Kamber (2006) enumerate the following characteristics of clustering:
• Scalability - Highly scalable clustering algorithms can prevent the lead of biased results on a sample of large datasets.
• Ability to deal with different types of attributes - Clustering can be applied over not only numerical data, but also binary, categorical (nominal), ordinal or in mixtures of these.
• Discovery of clusters with arbitrary shape - Although many clustering algorithms determine clusters based on Euclidean or Manhattan distance measures, which leads to the find of spherical clusters with similar size and density, there are others algorithms that can detect clusters of arbitrary shape.
• Minimal requirements for domain knowledge to determine input parameters - In general, cluster algorithms require certain parameters, such as the number of desired clusters. These kinds of parameters are often difficult to determine, and so this not only burdens users but also makes the quality of clustering difficult to control.
• Ability to deal with noisy data - Some clustering algorithms are sensitive to outliers or to missing, unknown or erroneous data, which may result in clusters of poor quality.
• Incremental clustering and insensitivity to the order of input records - Some algorithms cannot incorporate newly inserted data into existing clusters and so must determine new ones. Also they can be sensitive to the order of input data, this is, different results may be obtained, based on the order of the input objects.
The different segmentation techniques can be organized into the following methods:
- Partitioning methods - In this type of methods, given n objects, k partitions of the data are constructed, where each partition represents a cluster and 𝑘 ≤ 𝑛, with the following requirements being satisfied: (1) each group contains at least one object, and (2) each object must belong to exactly one group.
- Hierarchical methods - A hierarchical method creates a hierarchical decomposition of the given set of data objects (Han & Kamber, 2006). It can be classified as being either agglomerative or divisive, based on how decomposition is formed. The agglomerative approach starts with each object forming a different group and successively merges similar groups until all the groups are merged into one, or a stop condition is reached. The divisive approach works on the opposite way, with all objects starting in a unique cluster and being successively separated into new ones. - Density based methods - Density based objects are able to find clusters of arbitrary
density (number of objects or data points) in the neighborhood exceeds some threshold.
- Grid-base methods - These methods quantize the object space into a finite number of cells that form a grid structure. This approach has a very fast processing time when compared to others, because typically it is independent of the number of objects and dependent only on the number of cells in each dimension.
- Model based methods - At last, model based methods hypothesize a model for each of the clusters and find the best fit of the data to the given model. It also takes noise or outliers into account by automatically determining the number of clusters based on standard statistics and thus yielding robust clustering methods.
3.3 Association
The objective of association techniques is to find a model that can describe significant dependencies between variables, identifying associations in groups of data and facts that can be directly or indirectly associated with each other. Associations come to light when several occurrences are connected in a unique event at a structural or quantitative level. In the structure level the model is represented in a graphic way and with variables locally dependent between themselves, while in the quantitative level the model specifies the dependencies strength or weight, by a numeric scale (Santos & Azevedo, 2005). Association Rules help to find such relationships accurately. They can also be generalized to do classification of high dimensional data (Liu et al., 1998).
Association rules have recently gained considerable importance in the data mining community because of their capability for knowledge discovery (Aggarwal & Yu, 1999). An association rule can be expressed as a condition in the form: Χ ⇒ Y, where X ⊆ I and Y ⊆ I are two sets of items. The idea is the development of a systematic method through which a user can infer the presence of some sets of items, given the presence of others items. The confidence of a rule is the fraction of transactions containing X that also contain Y, while the support of a rule is the fraction of transactions which contain both X and Y.
3.4 Techniques Analysis
Based on the data mining techniques and methods seen above, some seem to us more relevant than others when dealing with fraud scenarios. From Classification, Decision Trees (more specifically Random Forests) appear to be an obvious choice, not only because of their good capability to deal with noise in the data and to resist overfitting, but also because they have been proven in the literature to be capable of achieve good results when applied to fraud datasets (Bhattacharyya et al., 2011). In order to perform some comparisons, it made sense to consider others classification techniques. SVM has also been receiving a lot of attention lately, due to some good results they provided, and so it looked like a good technique to consider for comparison. On the other hand, Logistic Regression is a widely tested technique often used as a term of comparison and so it also made sense to test it in the model.
Segmentation and association techniques were also considered with the objective of helping to determine the profile of a fraudster. The idea behind the application of segmentation techniques was to see if outliers that represent fraudulent customers, could be detected from the universe of study, and/or to test the possibility of separating fraudulent from non-fraudulent customers in two distinct clusters. Association techniques were applied with the objective of determining if there were any common attributes that appear “hand-to-hand” associated to fraudulent transactions or fraudulent costumers profiles.
A fairly recent technique, with an approach different from all the ones seen previously, has been introduced with some success in the detection and prevention of fraud, particularly on the telecommunication industry (Cortes & Pregibon, 2001; Lopes et al., 2010; Ferreira et al., 2006), consisting on the establishment of signature based methods for data streams. It will be around this technique that this document will focus.
4. F
RAUD
D
ETECTION
B
ASED ON
S
IGNATURES
Signature-based methods consist on the application of signature-based methods for data streams, trying to establish usage patterns in a specific branch of activity. In general, these methods consider the selection of a group of features extracted from a data stream source, in order to capture the behavior of a user or a community of users in some kind of application scenario. Using those patterns as comparison terms with any other outliers that deviate from them, it is possible to detect potential cases of fraud.
Cortes & Pregibon (2001) described a transactional data stream as a dynamic continuous flow of data consisting of a set of records about some interaction processes that happened between a group of entities of interest. In E-Commerce environments, clickstream data are a perfect example that fits very clear with this definition. Thus, using signatures analysis on fraud detection it seems very appropriate due to the nature of the E-Commerce problems and because it allows for the characterization of users almost in real-time.
Clickstream is a generic term to describe visitors paths through a series of Web pages requested by a visitor in a single visit, referred also as a session. In a Web site, clickstream data is a collection of sessions performed on that site, which can be derived from raw page requests (referred as hits) and their associated information (e.g. timestamp, IP address, URL, status, number of transferred bytes, referrer, user agent, or cookie data) that was recorded in the log files of a Web server. The analysis of clickstreams shows how a Web site is navigated and used by its visitors (Lee et al., 2001). While simple records of transactional data streams can be rather uninformative, when taken as a whole, they can represent a detailed picture of the user behavior, and so they are a good source to establish usage profiles.
The use of signatures on fraud detection is very appropriate since its nature allows for the characterization of users in almost real-time. Signatures in fraud can be used in two ways (Burge & Shawe-taylor, 1997; Denning n.d.; Fawcett & Provost, 1997):
- Profile-based detection methods. - Anomaly detection methods.
Profile-based detection methods, consists in storing several deviant behavior cases and signatures from current traffic are then compared to these deviant cases to detect fraudulent behavior. In anomaly detection methods, the user signature is itself used for comparison. A big deviation on one is signature indicates a change of behavior that can be fraudulent. This method is used specially in telecommunications and commercial credit card fraud detection systems.
4.1 Signature Definition
The main idea behind the concept of signature it is to give the notion that usage data varies from site to site, being personalized from visitor to visitor, changing slowly over time. Statistically speaking a signature can be described as an estimate of the joint probability distribution of a group of selected combined components (variables and/or features). These variables can be simple or complex. Simple variables are those that consist of a unique atomic value (i.e. integer or real), while complex variables consist of two co-dependent statistical values (i.e. the mean or the standard deviation of a feature). Thus components on signatures should be treated as independent, so that the signature model can be simply the product of marginal distributions (Cortes & Pregibon, 2001).
Signature models need to be relatively simple, since typically for each visitor, or account a signature is maintained, resulting in the existence of a very large number of signatures, dependent on the dimension of the data stream in analysis.
4.2 Signature Update
For a given temporal window w, a signature is obtained from a function φ, where 𝑆 = 𝜑(𝑤). (Ferreira et al., 2006) define a time unit as a certain pre-defined amount of time in which session records from the Clickstream data (in this case of analysis) are accumulated and then processed, being the value of w proportional to the time unit, 𝑤 = 𝛼 × ∆𝑡. For example if ∆𝑡 is considered to be one day, then 𝛼 = 7 for a temporal window of one week.
Updating a signature involves three distinct steps (Lopes et al., 2010): - Reading the signature from disk to memory.
- Changing the value of the signature using a statistical algorithm. - Re-write the signature on disk or memory.
The continuous growing of new visitors on clickstream data can make the maintenance of a single signature per visitor a challenge. In order to approach this problem, equivalent classes of accounts are created, and when a newcomer appears its class is identified and its signature is defined as the average of the signature members of the respective class. This is similar to a nearest-neighbour classification procedure (Cortes & Pregibon, 2001). After the shift of a time unit the signature S is updated to S’ with the new Clickstream information recorded between the end of S and the updating of S’ (Figure 6).
Signatures updates can be processed based on two common ways (Lopes et al., 2010; Cortes & Pregibon, 2001): event-driven or time-driven. In time-driven, records are collected and temporarily stored for a certain period of time. After the end of that time, they are summarized and signatures updated. In the case of event-driven, signatures are constantly updated with the entry of new records. This method has considerable bigger costs of I/O (input/output) than the time-driven updating. On the other hand time-driven requires more disk space in which to store the records until the signature is updated. Therefore, in cases where time is a critical factor like in fraud detection, event-driven updating seems more appropriated. The computational model for both methods is the same (Cortes & Pregibon, 2001). According to (Lopes et al., 2010), consider St a signature and R a record or set of records available at a given period of time t, that should be processed before the signature update, with an identical format as St, being the result of that transformation TR. At time t + 1 a new signature is formed, corresponding to the update of St in conjunction with TR, according to the following formula:
S!!! = β. S!+ 1 − β . T!
where β determines the value of the weight of the new T! transactions in the new signature. In time-driven update the value of β is usually constant and can be adjusted in accordance with the defined time window. The signature is then updated if a certain threshold Ω is met (Ferreira et al., 2006). This Ω is calculated based on the distance between the S and T!
vectors, where dist S, T! ≥ Ω. Otherwise an alert is generated in order for the case to be further analysed.
Figure 6 - Illustration of the Variation of a Signature - extracted from (Ferreira et al. 2006).
4.3 Elements of a Signature
Features or elements of a signature are statistical values that describe a certain aspect of the behavior of a user. These are calculated through variables extracted from the clickstream data. In this concrete context of application, an element can be simple when it corresponds to an average value, or complex when it is associated with an average and standard deviation of a certain data feature.
A statistical analysis was done upon the data extracted from the clickstream, in order to determine the most useful variables for the detection of potential fraudulent cases. These selected variables correspond therefore to a statistical value that describes a certain aspect of the behavior of a user. In our application context, a simple variable corresponds to an average value and a complex variable to an average and a standard deviation of a certain feature. In Table 1 it is presented a list of the feature variables that were selected to define the structure of our signatures, as well as their respective type.
Table 1 –Features of a Signature.
Description Type
Number of Days Since Last Visit Complex
Number of Days To Purchase Complex
Value of Order Complex
Number of Unique Actions Complex
Order Days Complex
Order Time Complex
Time Spent Simple
Time per Page Simple
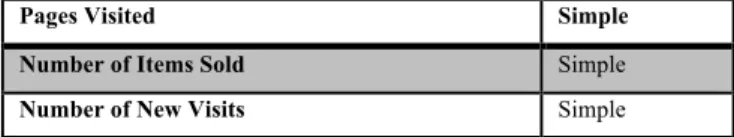
Table 1 - Features of a Signature (Continuation)
Pages Visited Simple
Number of Items Sold Simple
Number of New Visits Simple
From the 12 features chosen, 6 are complex and 6 simple (Table 1). Since each complex feature has a mean and a standard deviation (std) value associated with, the total number of measures is 18 (12 mean values and 6 std). In Figure 7 it is presented an example of a fragment of a record, from which the features of the signature were extracted.
Figure 7 - Example of a Fragment of a Record.
The choice of each variable type depended on its variability and complexity. Features that showed high variability are much better expressed through both average and standard deviation, while others can be expressed only by their mean value. Take for example the “Number of Days Since Last Visit” feature (Table 2), which is much lower on the case of fraudulent users, because usually fraudsters have a small time window to make purchases, before being caught. In the case of this measure, it can be better expressed by representing both it mean and standard deviation value.
Table 2 - "Number of Days Since Last Visit" Statistical Analysis.
Min Max Mean Std
Fraud 0 232 3.698 18.296
Non-Fraud 0 1673 20.677 64.932
4.4 Detection of Anomalies
For a given set of clickstream records of a certain user, a summary is created and then compared to its signature, in order to establish if there was a deviation from its typical