Patrícia Santos Pereira de Barros
The Pricing of Secured Non-Performing Loans:
Lessons from an Internship
UNIVERSIDADE DO ALGARVE FACULDADE DE ECONOMIA
ii
Patrícia Santos Pereira de Barros
The Pricing of Secured Non-Performing Loans:
Lessons from an Internship
Internship Report
Master in Financial Economics
Work made under the supervision of: Luís Miguel Serra Coelho Ph.D.
Marco Filipe Dias Freire - Chief Operational Officer and Administrator WS
UNIVERSITY OF ALGARVE FACULTY OF ECONOMICS
iii
Patrícia Santos Pereira de Barros
The Pricing of Secured Non-Performing Loans:
Lessons from an Internship
Relatório de Estágio para obtenção do Grau de Mestre
Mestrado em Economia Financeira
Trabalho efetuado sob a orientação de: Professor Doutor Luís Miguel Serra Coelho
Marco Filipe Dias Freire - Chief Operational Officer e Administrador WS
UNIVERSIDADE DO ALGARVE FACULDADE DE ECONOMIA
iv
The Pricing of Secured Non-Performing Loans
:
Lessons from an InternshipWork Authorship Declaration
I declare to be the author of this work, which is unique and unprecedented. Authors and works consulted are properly cited in the text and are in the listing of references included.
Patrícia Santos Pereira de Barros
Copyright
© Copyright: Patrícia Santos Pereira de Barros
The University of Algarve has the right, perpetual and without geographical boundaries, to archive and make public this work through printed copies reproduced in paper or digital form, or by any other means known or to be invented, to broadcast it through scientific repositories and allow its copy and distribution with educational or research purposes, noncommercial purposes, provided that credit is given to the author and Publisher.
v ABSTRACT
The present document refers to a study conducted at Arrow Global Group - White Star Asset Solutions (WS), in the form of an internship. The subject was the pricing of secured Non-performing loans (NPL), in particular, the time to recover debt. The methodology selected was to follow a statistical approach, recurring to external and internal data to elaborate estimations. In particular, external factors such as macroeconomics, judicial procedures, civil law and court type are considered in the analysis, and the parameters, that were part of the time matrix in use, are revisited from a different perspective to compile a new time matrix. Relying on this time matrix one can predict the debt recovery moment, which has a direct influence on the pricing of the portfolios under management by WS.
This is an important topic since it is at the core of WS’ activities. At a more general level, the work undertaken during the internship is valuable to the investment community at large. In particular, investors operating in this market seek to acquire portfolios with a good recovery percentage and high return on investment. The methodology employed and the results uncovered seem to suggest that the new time matrix, that was developed, may help achieve these two objectives.
vi RESUMO
O presente relatório refere ao estágio efetuado na empresa Arrow Global Group – Whitestar Asset Solutions (WS), tendo como objetivo o estudo de Non-performing Loans (NPL) Pricing e fatores preponderantes no cálculo do valor recuperável da dívida em mora, como parte integrante de uma carteira de crédito.
O fator de maior foco foi o tempo de recuperação de dívida, sendo este primordial para a tomada de decisão de investimento. Os investidores, que adquirem estas carteiras de crédito, procuram informação a respeito dos montantes expectáveis de retorno, com incidência no ponto da linha temporal em que ocorre o retorno do seu investimento. Estas estimativas são, portanto, pontos de interesse do trabalho desenvolvido na WS.
A WS é uma empresa de gestão de carteiras de crédito e imobiliário, líder em Portugal, e a única capaz de oferecer um serviço integrado e completo de gestão de ativos para investidores e originadores. Trata-se uma empresa especializada na gestão de crédito, oferecendo um serviço completo e integrado de gestão de portfólios. As carteiras incluem NPL, sendo, na sua maioria secured NPL. Assim, o estudo incide em secured NPL, que se pode resumir como NPL garantido por bens imobiliários.
A recuperação da dívida, incluída nestes portfólios, constitui o principal negócio da WS. Nesta medida, a estimativa dos valores passíveis de serem recuperados e o tempo de recuperação de dívida, são, necessariamente, parte integrante das mais eminentes atividades para investimento de recursos de natureza técnica e humana. A estrutura organizacional da WS identifica-se pela cooperação entre departamentos chave visando a criação de lucros. A WS tem um departamento de Due Diligence dedicado somente a esta área de negócio. Nestas equipas incluem-se advogados que monitorizam e incitam os processos judiciais, com a finalidade de recuperar dívida.
A metodologia escolhida para formalizar estimativas de preço e tempo de recuperação de dívida pode variar. A WS desenvolveu modelos de pricing apoiados em estudos realizados na empresa; os acedidos diferem em resultados e assunções, embora a metodologia não difira significativamente. Procura-se, no presente estudo, analisar outras perspetivas e correlacionar outros fatores, de modo a afinar a estimativa.
Os principais alvos deste estudo sofrem a influência de fatores macroeconómicos. Esta evidência é identificada por diversa pesquisa na matéria e as correlações entre indicadores macroeconómicos e NPL são muito significativas. Os fatores macroeconómicos são
vii
apontados como determinantes para a evolução de NPL, verificando-se que indicadores macroeconómicos desfavoráveis potenciam o aumento de NPL. A existência de extensa investigação, nesta matéria, espelha o interesse que provoca. Os estudos indicam relações diretas entre fatores macroeconómicos e NPL, nomeadamente, Produto Interno Produto (PIB), taxa de desemprego e taxa de juro.
O pricing de NPL é, também, incluído nesta dinâmica. Sabendo-se que para o pricing de NPL contribuem grandezas como o tempo, pode-se inferir que o tempo de recuperação de dívida está diretamente relacionado com a macroeconomia de um país. Alguns investigadores apontam para uma ligação entre os tempos judiciais e a situação macroeconómica, bem como a quantidade de NPL. Com efeito, verifica-se que nos países onde a economia é menos pujante, e portanto apresentando fatores macroeconómicos mais débeis, a percentagem de NPL é superior, à semelhança dos respetivos tempos de resolução e recuperação de dívida.
O estudo que agora se apresenta define matrizes de tempo de retorno de investimento, em termos de recuperação de dívida, seguindo um processo judicial. Assim, as matrizes foram agrupadas por fases do processo litigioso; desta forma, a estimativa torna-se mais aproximada e perceciona-se quais as fases mais morosas. Adicionalmente, é possível verificar o investimento, em termos temporais, que uma determinada fase implica e carece. Esta informação traduz-se numa mais-valia, aquando a gestão de um portfólio, uma vez que os trâmites legais exigem recursos monetários.
Esta escalpelização tem particular relevância na determinação de Cash-Flows ao longo do período de gestão do portfólio, não obstante, este cálculo não foi incluído no estudo. A metodologia selecionada debruça-se em métodos estatísticos, os dados recolhidos são tratados estatisticamente, de modo a produzir estimativas do tempo que decorre em cada fase judicial. Dados internos e externos são combinados para melhorar esta estimativa. Relativamente às metodologias e processos para estimar estas grandezas, podem-se identificar alternativas àquela que foi utilizada. Outro método passível de ser adotado é o recurso a software dedicado, sendo os dados tratados e analisados por esta ferramenta, produzindo relatórios Ad hoc e manipulando os dados de forma traduzir a informação em gráficos e tabelas, que evidenciam a sua leitura.
Estas ferramentas informáticas permitem criar o que é denominado de business intelligence, suportando as decisões de negócio. Tal abordagem de tratamento de
viii
informação constitui uma mais-valia, especialmente, se produzida com a combinação de dados internos e externos, criando uma espécie de inteligência.
No entanto, são conhecidas as limitações destas ferramentas, apoiam-se em dados e informação do passado para identificar padrões e efetuar estimativas e previsões. Existem ainda fatores que não são passíveis de ser manipulados por estas ferramentas, deixando, portanto, ainda espaço para o erro. Os algoritmos utilizados para estas aplicações são insuficientes, em termos de capacidade de produção de resultados mais abrangentes; o algoritmo aprende apenas aquilo a que está destinado.
Em termos de estimativa e previsão, está-se ainda aquém do que poderia ser considerado um resultado exato. A expetativa é que no futuro (próximo) se possa recorrer ao que neste momento está a ser desenvolvido e se denomina por ‘algoritmo mestre’, parte da aprendizagem das máquinas, também considerada inteligência artificial.
Considerando o espetro disponível, a abordagem escolhida foi a mais conservadora e parca em recursos externos, justificada pela natureza do estudo. Consequentemente foi possível definir matrizes, com adequado grau de rigor, em termos de estimativa. Os resultados destas matrizes diferem de outros obtidos anteriormente na WS. Estas diferenças podem ser explicadas pela utilização de premissas diferentes, baseadas em informação recolhida em departamentos cujo espectro de ação não inclui análise de negócio, com efeito, o departamento legal. A identificação da realidade, significado dos processos legais e respetivos trâmites possibilitou a afinação do modelo. A acumulação de mais dados internos contribuiu também para produzir uma melhoria da qualidade do seu processamento.
ix
Page INDEX
INDEX OF FIGURES ... xi
INDEX OF TABLES ... xii
LIST OF ABBREVIATIONS ... xiii
Chapter 1 INTRODUCTION ... 1
Chapter 2 THEORETICAL CONSIDERATIONS ... 3
2.1 The Relevance of Non-performing Loans ... 3
2.2 Macroeconomic factors and NPL ... 4
2.2.1 GDP and the NPL ratio ... 4
2.2.2 Unemployment rate and NPL growth ... 8
2.2.3 Interest rate and NPL ... 9
2.2.4 Management of NPL and forborne exposures ... 12
2.3 Macroeconomic effects and resolution times of NPL ... 13
2.4 Impediments to NPL resolution in the EU ... 14
2.5 Wrapping up ... 15
Chapter 3 THE INTERNSHIP ... 17
3.1 Presentation of Arrow Global Group ... 17
3.2 Whitestar and the main goal of the internship ... 17
Duration and location of the internship ... 19
3.3 Concepts and theoretical considerations ... 19
3.3.1 WS price walk and pricing model for secured NPL ... 19
3.3.2 The time line and judicial time matrices ... 23
3.3.3 Secured NPL and legal phases ... 25
3.4 Selected approach and relevant information ... 27
x
3.4.2 Data analysis ... 29
3.5 Results and Discussion ... 33
Chapter 4 CONCLUSION ... 37
4.1 Personal perspective and respective conclusions ... 37
4.3 Limitations ... 40
4.4 Future set-up... 40
xi INDEX OF FIGURES
Figure 2.1 - NPL ratio evolution and real GDP growth, EU and EA, for the period 2000-2015……….. 5 Figure 2.2 - NPL per EU member state, for 2015……… 5 Figure 2.3 - NPL ratios in different categories of EU Member States (2000 - 2015, % of gross loans)………... 7 Figure 2.4 - Output gap in different categories of EU Member States per NPL level and dynamics, for the period of 2009 – 2015……….. 7 Figure 2.5 - Evolution of NPL, GDP and Unemployment rate, in Spain - 2004 to 2010. 8 Figure 2.6 - Non-performing loans, per cent, Q2 2016………. 9 Figure 2.7 - Financial indicators, for the period 2008-2016 (Graphs A., B., C. and D.). 10 Figure 2.8 - Performance of the judicial system……….. 13 Figure 2.9 - Importance of impediments to the local legal and judicial system across EU countries……….. 15
xii INDEX OF TABLES
Table 2.1 - Categories of EU Member States based on NPL level………..…. 6 Table 3.1 - WS Cost categories for Real Estate……….……….. 21
xiii LIST OF ABBREVIATIONS AI Artificial Intelligence AM Asset Manager BE Belgium BEL Belgium BG Bulgary BI Business Intelligence BK Bankrupcy CF Cash-Flow
CPC Código de Processo Civil CZ Czech Republic
CZE Czech Republic DD Due Diligence
DE Germany
DEU Germany
DG ECFIN Directorate General for Economic and Financial Affairs DIL Deed-in-Lieu
DK Denmark
EA Enforcement Agent
EBA European Banking Authority EC European Commission
xiv ECB European Central Bank
EE Estonia
ES Spain
ESP Spain
ETR Expected Time to Return EU European Union
EUR Euro
FC Foreclosure
FR France
FRA France
FSI Financial Soundness Indicators GBR Great Britain
GDP Gross Domestic Product
GDPR General Data Protection Regulation
GRC Greece
HU Hungary
HUN Hungary
IE Ireland
IMF International Monetary Fund INE Instituto Nacional de Estatística IRL Ireland
xv IT Information Technology
ITA Italy
JPN Japan
KOR Korea
KPI Key Performance Indicator
LT Lithuania LTV Loan to Value LU Luxembourg LV Latvia MEX Mexico NFC Non-Financial Corporations NL Netherlands NLD Netherlands NPL Non-Performing Loans
OECD Organisation for Economic Co-operation and Development OPB Outstanding Principal Balance
PL Poland
POL Poland
PT Portugal
PTR Portugal
xvi REO Real Estate Owner
RO Romania SE Sweden SI Slovenia SK Slovakia SVK Slovakia SWE Sweden TUR Turkey UK United Kingdom
UPB Unpaid Principal Balance USA United States of America WAL Weighted Average Life
WS Whitestar Asset Solutions S.A. YTD Year-to-date
1 Chapter 1 INTRODUCTION
The present document reports an internship at Whitestar Asset Solutions, targeting Secured Non-performing loans and, in particular, its pricing and judicial time matrices. A Non-performing loan (NPL) is a loan that is either in default or close to be in default. Loans deemed as NPL are less likely to be repaid in full, relative to similar loans that are not classified as such. Thus, lenders strive to avoid being exposed to NPL, since this may result in the loss of interest and principal.
In the past years, the market for NPL has grown substantially. Particularly, in the aftermath of the 2008 Financial Crisis, numerous banks and similar institutional investors were exposed to this problem since several firms and individuals were forced to default on their loans. Although the world economy is showing signs of improvement, it is likely that NPL will still matter in the foreseeable future.
Whitestar Asset Solutions is a full service and integrated servicing specialist with expertise that covers Non-performing loans. At the outset, the internship had two main goals. The first was to explore how this firm prices the portfolios of secured NPL that it manages. Second, this internship constituted an experience in the investment world. This involvement contributes to the understanding of the complexities of the organizational culture of such type of firm thus fulfilling one of the main goals of the master degree: helping students to get acquainted with real-world businesses operating in financial markets.
The results of this internship can be summarized as follows. It is acknowledged that NPL is connected to macroeconomic factors. In effect, harsh macroeconomic conditions lead to increasing outcomes in terms of NPL volume. A forthright explanation for it is that during recessions and periods of weak economic growth, households and firms are less able to repay their loans, leading to a rise of NPL. Importantly, the financial and banking sectors exert a positive feedback loop, which contributes to the behavior of NPL and negatively affects the macroeconomic context.
Moreover, the time line to recover debt is deemed as the main concern of investors, when considering investing in a certain portfolio. As such, accurate prediction of the time elapsed to debt recovery distinguishes the performance of different firms managing NPL which, in turn, impacts on how they gain the trust of investors.
2
In this context, judicial times play a key role as they influence directly the time to recover debt. As such, civil Law and courts’ administration are considered important factors for NPL performance, as well as proficient players linked with these matters, such as lawyers. Proper internal organization and having motivated and knowledgeable human resources are thus crucial in this line of business.
As previously mentioned, the NPL business is highly time-sensitive and, therefore, being able to transform assets into cash as soon as possible is vital to make the business profitable. Yet, servicers do not directly control many of the main aspects that determine the time they take to recover the debts they are managing. Hence, having a cohesive and professional team is paramount; Whitestar Asset Solutions seems to comprehend this issue, since is ranked first in the debt recovery ability for secured NPL in Portugal.
3
Chapter 2 THEORETICAL CONSIDERATIONS 2.1 The Relevance of Non-performing Loans
The European Commission (EC), the European Central Bank (ECB), and the International Monetary Fund (IMF) noted that “reducing the excessive levels of NPLs remains the number one priority for economic recovery” (European Commission, ECB and IMF 2015). This statement emphasizes the importance of the role that NPL played in the recent financial crisis.
The connection between macroeconomic factors and bank’s performance seems clear. For instance, Makri, Athanasios, and Athanasios (2014) find strong correlations between the Gross Domestic Product (GDP), unemployment, public debt and bank-specific factors in the Eurozone and the level of NPL. On the other hand, NPL seems to critically affect macroeconomic performance. In particular, Nkusu (2011) finds that its enlargement debilitates macroeconomic performance and exacerbates macro-financial vulnerabilities. Recently, we have witnessed the rise of NPLs around the world, which led the topic to be extensively researched. Relying on data from the United States of America (USA), Saba, Kouser and Azeem (2012) show that the NPL ratio is the most important issue for banks to survive. In a related study, Karry (2017) report that, in China, NPL follows an increasing path. In fact, the IMF estimates that the country’s non-financial sector debt will exceed 290% of GDP by 2022, compared to 235% in 2016. Interestingly, Beck, Jakubik and Piloiu (2015) find that until the 2008 global financial crises, the credit quality of loan portfolios, across most countries in the world remained relatively stable. Yet, afterwards, the global recession severely hit the asset quality in the balance sheet of banks, which led to its significant deterioration.
Interestingly, there is evidence that not all countries were affected in the same way. For instance, the NPL ratio in Germany increased by less than that that could be expected considering that the economy contracted by almost 5% in 2009. This suggests that not only economic cycles, but also other factors contribute to explain the behavior of NPL. In this context, Tanasković and Jandrić (2015) indicate that for more developed financial markets the level of NPLs should be lower. In fact, the authors find that only financial market level of development is reported as statistically significant in relation to the level of NPL.
4
Finally, it is important to stress that not all NPL are born alike. In particular, they are generally classified into two different categories: secured and unsecured. The former (latter) is usually (not) backed by real estate (any form of collateral), which links the NPL ratio to mortgage default and housing price index. This is also an area that has merited attention by academic researchers. For instance, Jones and Sirmans (2016) show that commercial mortgage delinquency and default rates rose dramatically during the 2007-2009 financial crisis. This information is useful for originators and investors, amongst other players in the financial business, since real estate is the type of asset which mainly backs NPL. In a different paper, Jones and Sirmans (2015) find that mortgage default rates increased during the recent housing market downturn, rising from less than 1% to historically high levels.
2.2 Macroeconomic factors and NPL
The global economy and the individual countries’ economy impact the volume of loans that enters into a NPL status. Thus, it is interesting to study how NPLs relate to different macroeconomic factors. In fact, several studies tend to find a significant relationship between credit risk and macroeconomic factors. For instance, Louzis, Vouldis and Metaxas (2012) find that for all loan categories, NPLs in the Greek banking system can be explained mainly by macroeconomic variables and management quality. This connection is non-linear and differs according to the specific economy. The next sub-sections explore this issue in more detail, using the global crisis around 2008 as a reference to explore the cycle patterns and its consequences.
2.2.1 GDP and the NPL ratio
The GDP is part of the primary indicators used to gauge the health of a country's economy. It represents the sum of gross value added by all resident goods and services, produced within a specific timeframe. It is recognizable that GDP growth impacts the percentage of NPL, since diminishing production decreases wealth and solvency. In the case of the European countries, loans’ volume tends to increase when the GDP decreases; thus, GDP and loans’ volume follow an opposite, but correlated pattern, according to Eurostat (2018 Statistics). Furthermore, NPL ratios reach a significant peek in crisis’ periods; afterwards they shrink and stabilize, a behavior clearly shaped by the macroeconomic cycles.
5
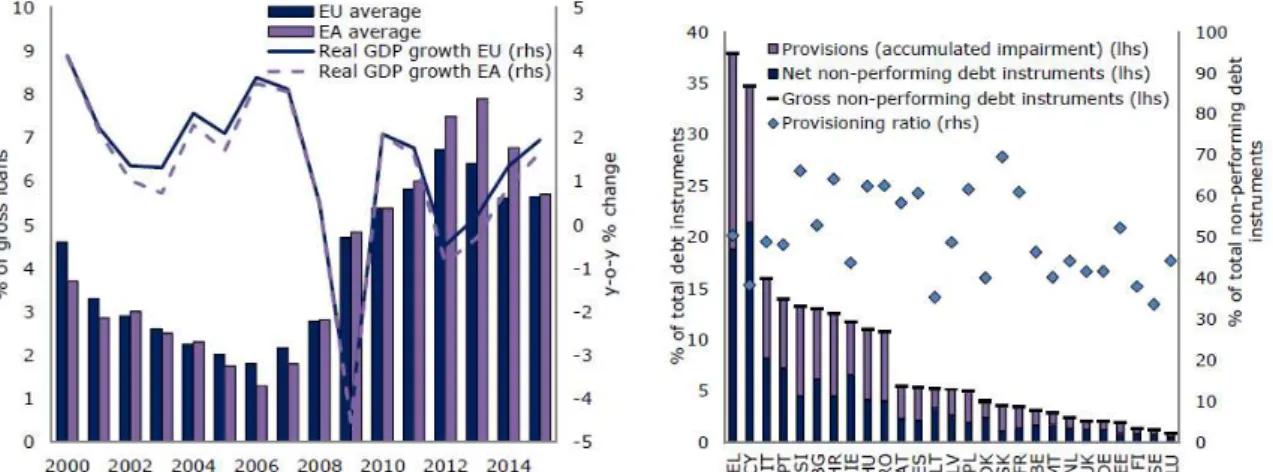
Nevertheless, it is possible to recognize that, between different European countries, the NPL performance varies significantly. Figure 2.1 depicted below evidences this fact. Figure 2.2 represents a relative comparison of NPL per EU member state, in 2015.
Figure 2.1 – NPL ratio evolution and real GDP growth, EU and EA, for the period 2000-2015.
Figure 2.2 – NPL per EU member state, for 2015.
Source: Worldbank, ECB, DG ECFIN calculations.
Figure 2.1 shows the clear and significant decrease in GDP during the period of the global 2008 crisis. Such fall was followed by an improvement in the overall performance of the economy, a normal consequence of the cyclical nature of the economic phenomenon. The NPL ratio evolved oppositely to GDP, noted that in the period of GPD’s recover after crisis, the decrease of NPL was not proportional to GDP increment, and maintained itself on a higher level, compared to the period prior crisis. This figure refers to the EU average. When the analysis is performed per European country separately, as in figure 2.2, it is possible to notice the differences between countries, which implies that the EU average may not be adequate to characterize any specific country.
Further, as can be seen, according to the International Monetary Fund World Economic Outlook issued on October 2018, countries with less volume of NPL have higher GDP. For instance, Germany has the highest GDP in the EU, holding a small record of NPL;
6
other countries, such as the UK, France, Netherlands and Sweden also rank high on the GDP’s comparison and low in their NPL ratio.
It is interesting to verify to what extent EU member states can be categorized according to their growth rate of NPL. This is important since as the NPL ratio increases, it affects the dynamics of the economy as an all. Table 2.1, puts this issue into perspective around the recent crisis, for the same period:
Table 2.1 - Categories of EU Member States based on NPL level
Category Member States
Category 1: currently not showing high NPL
(<=10% of banks' loan portfolio) and not done so in the past 15 years
BE, DK, FI, DE, LU, NL, FR, SE, UK
Category 2: currently not showing high NPL (<=10% of banks' loan portfolio) but have done so in the past 15 years and/or NPL ratios rose strongly in a short period of time (at least doubling between 2008 and 2013)
AT, EE, CZ, PL, HU, SK, ES, LV, LT
Category 3: currently showing high NPL (>10% of banks' loan portfolio)
BG, HR, CY, EL, IE, IT, MT, PT, RO, SI
Source: DG ECFIN.
As it is possible to notice on the table, countries are grouped in three categories. Category 3 is the most negative one, clustering the countries with weaker economies (Portugal is included in such category); on the other hand, category 1 groups the richer member states. As can be seen in the figures below, the Euro area countries that were relative more affected by the debt crisis (i.e., Portugal, Italy, Greece, Spain, Ireland, Cyprus and Slovenia), experienced a growth in their NPL ratios since 2010, an effect that still lasts, however, at a decreasing marginal rate. The remaining euro area countries show a
7
dissimilar pattern from 2012 onwards. The following figures (figure 2.3 and figure 2.4) depict exactly that.
Figure 2.3 - NPL ratios in different categories of EU Member States (2000 - 2015, % of gross loans)
Figure 2.4 - Output gap in different categories of EU Member States per NPL level and dynamics, for the period of 2009 – 2015.
Source: Worldbank, ECB, DG ECFIN calculations.
Source: Eurostat, DG ECFIN calculations.
The percentage of NPL, relative to gross loans is shown by groups of countries, fitting the same category, and GDP levels. Countries belonging to category 3 have lower levels of GDP and increased NPL ratio. Following the 2008 crisis, a significant peek occurred (2013), naturally related to the macroeconomic cycle and GDP variance. Afterwards, there seems to be a reversal phenomenon, which is likely to be linked to the expansion of GDP, a phenomenon that is more visible in countries of category 3.
Overall, the present subsection suggests that GDP level and the NPL ratio are negatively correlated. Noted that the decreasing or increasing rates are not directly proportional, GDP’s growth is followed by NPL ratio shrinkage, however, the evolution of the rate is not as steep for NPL ratio decrements, as it is for GPD increments, especially for countries included in Category 3.
8
2.2.2 Unemployment rate and NPL growth
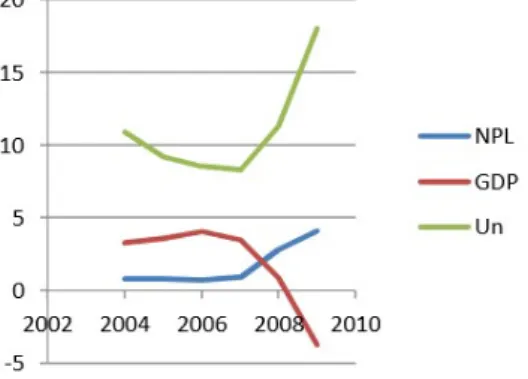
This subsection explores the connection between unemployment rate and NPL growth. It is done via an example that happened with Spain, from 2004 to 2010.
Figure 2.5 – Evolution of NPL, GDP and Unemployment rate, in Spain – 2004 to 2010.
Source: International Journal of Economics and Financial Issues Vol. 3, No. 4, 2013, pp.852-860.
As can be seen, GDP (in red) and unemployment (in green) rates evolve oppositely and depict a pattern that nearly mirrors one another. NPL (in blue), on the other hand, follows a pattern resembling the unemployment line.
In order to continue the analysis of this topic, it is important to distinguish some concepts and figures. NPL can be corporate or relative to households. Furthermore, concerning non-financial corporations (NFC) it tends to be unsecured, which means that it is a loan that is issued and supported only by the borrower's creditworthiness, rather than by any type of collateral; yet, households usually have secured NPL, typically backed by real estate.
The distribution of NPLs for the EU is as follows: 61% for NFCs, 35% for households and 4% for others, according to ESRB Secretariat based on Consolidated Banking Data (ECB), for 2015. As such, the NPL stock for NFC is higher than for households (61% vs. 35% in EU Member States).
It should be noted that NPL that is backed by real state has a significant percentage in the total amount of non-performing debt. Thus, unemployment directly affects this parameter in a larger scale, since corporations tend to adjust human resources before entering in
9
default. Such people are likely have mortgages and thus are the first defaulting on their debts. Hence, mortgages entering a NPL status increase with unemployment, which heavily contributes for a rise in the total NPL. For this reason, according to Laeven and Laryea (2009), assessing the likeliness of repayment can be viewed as a good proxy in measuring familiar financial stability.
2.2.3 Interest rate and NPL
The interest rate is linked to NPL (Messai e Jouini 2013). In fact, when NPL increases the interest rate follows since fewer funds become available and, thus, it is more difficult to borrow. This triggers a cascade effect. As rates increase the default probability of both high-risk and less-risky borrowers increases. The expected increase in default rates raises bank’s exposure to credit risk, generating higher levels of NPL.
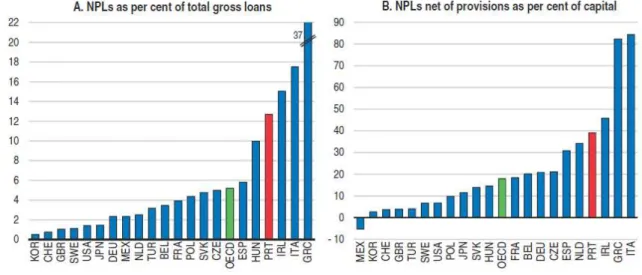
This vicious circle is hard to break and may lead to economic unrest. Figure 2.6 helps to understand this concept in practice by depicting the relation between NPL and total loans amongst European countries and other reference economies, such as the USA, Japan, Mexico and Korea.
Figure 2.6 – Non-performing loans, per cent, Q2 2016
Source: IMF (2016), Financial Soundness Indicators (FSI Database), International Monetary Fund.
10
The graphs represent a relative comparison of NPLs as per cent of total gross loans (A.) and NPLs net of provisions as per cent of capital (B.). Portugal (in red) is clearly in an unconfortable position: it marks above the the OCDE average (in green), whch only Italy, Greece and Ireland having a higher ratio of NPL to total gross loans. According to figure 2.6., nearly 13% of total gross loans are NPL in Portugal as of Q2 of 2016. This means that 13% of loans are in default, and for banks to absorb the impact of these NPLs it is necessary to compensate with higher interest rates.
Secured NPL, i.e. that backed by real estate, is particularly sensitive to interest rates. In fact, default on mortgages is more likely to occur when interest rates rise, as with higher interest rates the monthly mortgage may be incremented to an unaffordable amount falling in a NPL status. In addition, the dynamics of the real estate market is also negatively affected by high interest rates, since buyers are less able to get access to affordable funding.
It is also important to distinguish between Corporation’s and Household´s figures, as they are impacted differently, as well, as consumption and housing. Figure 2.7 helps to put these considerations into perspective:
11
Source: Banco de Portugal (2016), BPstat Database and ECB (2016), Statistical DataWarehouse, European Central Bank.
The graph A shows the evolution of outstanding loans (in Euros) for Corporations and Housing separately, and it is noted that they follow a similar tendency. On the other hand, graph B, amongst the private sector debt, evinces a percentage of debt relative to GDP for Corporations with a pattern that is not as similar to Households’ debt’s percentage relative to gross disposable income. This means that, not only the percentage of debt for Corporations is directly influenced by GDP and vice-versa, whereas, Households to gross disposable income (as Households are financially managed according to their income), but also that they range within different limits.
For a bank it is easier to analyse the risk of a private person, via personal income, and keep the debt at a lower and steadier pace, also through interest rates’ management (higher risk, higher interest rate); contrasting with Corporations where creditworthyness is the main factor of the evaluation and more difficult to quantify.
Figure 2.7. above also evidences the weight that corporations have in NPL ratios. This is an important topic since corporations encompass the biggest share of the total, and, consequently, banks need to adapt interest rates to this market. This means that during periods where the NPL ratio is high risk follows and interest rates rise. However, interest rates for Corporations and Households should not present the same figures, as such, higher interest rates are applied to Corporations to withstand the impairments and diminish the risk.
12
When commercial banks are considerably exposed to default risk they are inclined to widen the interest rate spread in order to cushion themselves against the risk. This is pointed out in previous research conducted by Samahiya and Kaakunga in 2014, which implies that there is a positive relationship between interest rate spread and non-performing loans.
2.2.4 Management of NPL and forborne exposures
The macroeconomic factors and cycles allow economists to estimate and predict future scenarios. Nevertheless, the economic reality of this century raises some fundamental questions regarding this discipline. Firstly, important theories were tested and several times unsuccessfully so. Secondly, economic models usually assume that humans act rationally, looking to maximize their being, something that occurs within a well-functioning market, a recipe that eventually leads to social improvement. However, human beings hardly comply with theory, something that is well illustrated by real estate market bubbles. In recent years, in many countries several families underwrote loans that they could (cannot) not pay since they were signing long-time contracts that, in the short-run, benefited from unusally low interest rates. Rising rates dictated (will dictate) that such families lost (will eventually lose) their houses.
The banking system is faced with this reality and some banks are not prepared to manage NPLs effectively, lacking strategies to reduce them and/or managers with sufficient NPL expertise. In fact, NPL consumes capital and management time, diminishing profitability, and, in some cases, may weaken the bank’s position to support growth and employment. Considering this reality the European Banking Authority (EBA) issued a report offering guidelines for this matter, which is to be implemented by June 2019. Such guidelines mirror EBA’s view of appropriate supervisory practices within the European System of Financial Supervision or of how Union law should be applied in a particular area. For banks to mirror their approach on EBA’s perspective it is necessary to alter part of the requirements’ existing setup, assess the operating environment and external conditions, and trace a decision-making plan; these processes become part of regular operations. As investment areas it is pointed the IT systems and infrastructure for NPL management and monitoring, to be possible to capture and treat data, in order to support the implementation of consistent solutions.
13
Nevertheless, the ECB’s main supervisory priority areas are business models and profitability drivers, credit risk and risk management. The approach to NPLs is the most important element, within the ECB’s focus on credit risk and interest rates’ control.
2.3 Macroeconomic effects and resolution times of NPL
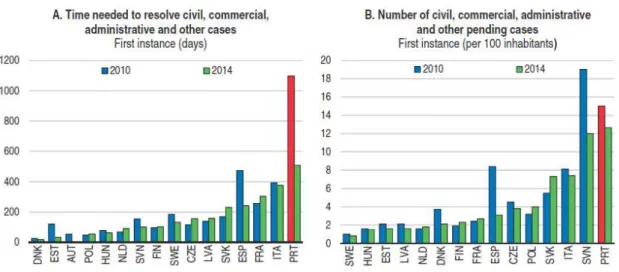
The value of a NPL portfolio varies with its time line: the longer it takes to sell it, the less it values. During a judicial process, that finishes targeting a sale, the time that a court takes to foreclosure it is decisive. This fact also interferes in the economic and financial wealth of the country, since profitability depends on the time necessary to recover debt (the higher the time to achieve foreclosure the lower the profitability). The efficiency of the judicial system also manners to the interest rate. On the assumption that a lender knows that the judicial procedures are well organized, it will dwindle the cost of funding; the risk is lower due to the decrease of uncertainty. In contrast, when operating in a country where the judicial system is less efficient, lenders will inflate their interest rate. Figure 2.8 shows the differences in performance of the judicial system among European countries.
Figure 2.8 – Performance of the judicial system
Source: European Commission (2016a), The 2016 EU Justice Scoreboard and Direcção-Geral da Política de Justiça.
14
As can be seen, the time elapsed to resolve a case in Portugal reduces the competitiveness of the country. The famous expression that “time is money” really applies to this situation. In fact, between 2010 (in red) and 2014 (in green), the time needed to resolve civil, commercial, administrative, and others cases, was reduced in approximately 50%.Yet, the country is still the one that ranks last in all those considered in figure 2.8 for this variable: Portugal still presents average values in 2014 (approximately 500 days) higher than other European countries, namely Italy (less than 400 days), Spain (approximately 220 days) and Denmark (approximately a month). Graph B shows the number of pending cases, with Portugal again finishing first in a very undesirable podium (in 2014).
2.4 Impediments to NPL resolution in the EU
The management of NPL is hampered by unbalanced national insolvency regimes and legislative limitations. Accordingly, banks adapt their NPL resolution strategy to the particular legal and judicial system of the countries they operate in. Another critical factor is the expected recovery rate, which also depends on such particularities. Thus, it is important to keep in mind the major impediments of the legal and judicial system (ranked by their degree of relevance according to EBA):
1. Long duration of the processes, due to legislation;
2. Low average recovery, due to long and, thus, costly legal processes;
3. Expensive legal necessary procedures;
4. Taxes;
5. Frequent changes in the applicable civil Law.
Impediments are deemed as relevant for the study of NPL, especially secured NPL, since its mainly backed by real estate and, therefore, highly dependable on the legal and judicial system. These impediments impact the system into a certain degree of importance, as the following figure depicts (Figure 2.9).
15
Figure 2.9 – Importance of impediments to the local legal and judicial system across EU countries.
Source: EBA.
As it is noticeable on the graph depicted above, the impediments were rated according to its importance and the impediments to the local judicial system (in red) represent a heavier contribution, relative to the local legal system (in blue), for high and medium importance; thus, the judicial system impacts locally the resolution of NPL and it is a differenciating factor.
2.5 Wrapping up
NPL is undoubtedly an important share of the financial market, especially since the aftermath of the 2008 crisis. The management of this NPL is then a business opportunity with consolidated results. In the case of secured NPL, its portfolios’ management represents a relative realiable source of cash inflow, therefore, an inviting investment. To improve the understanding of NPL’s role and expected behaviour it is fruitful to include the macroeconomic factors in the equation.
The relation between macroeconomic factors and the amount of NPL is close, it is possible to admit that the ability to pay a loan is influenced by one’s wealth. If the macroeconomic scenario is positive it is likely that one’s wealth is augmented and the financial capacity, as well. The percentage of NPL could also constitute a parameter to
16
perform a financial analysis. A high NPL level, usually, corresponds to a situation of economic distress. As stated by Ghosh (2015) and considering a study that targeted the US, higher GDP and income growth rates reduce NPLs, whereas inflation, unemployment rates and public debt increase NPLs.
Understanding the interrelation between macroeconomic indicators and NPL can help banks to manage credit risk more effectively. It is important to separate different economies’ performances, due to the discrepancies between countries; the same factor and behaviour may have a different outcome, although it is expectable that similar potentials would induce close results. Considering an isolated case, as Portugal, it is possible to analyse the vulnerabilities, including the macro-financial indicators; macroeconomic factors should be connected to financial indicators, leading to an enriched global perspective.
Referring to GDP and unemployment as parameters, the impact of GDP growth and the business cycle on credit risk is usually represented as pro-cyclical, the unemployment growth is associated to a decrease in loans demand, and regardless the NPL tend to increase. Hence, concerning a portfolio of NPL, its quality may be improved with the contribution of the decrease of loans, however the increase of NPL diminishes this effect. This phenomenon indicates that there are others factors at stake, such as the interest rates. The interest rates play an important part, as the loans and outstanding amounts are directly linked to them. Higher interest rates represent added difficulties to repay a loan and, simultaneously, diminish the access to affordable funding. The sum of these factors supplements NPL analysis and impacts NPL resolution times.
In addition, besides these evident macroeconomics factors, NPL analysis also benefits from an attentive read of how NPL impediments to resolution influence its time line, this understanding matters to improve the management approach. For a servicer it is important to gather these inputs and information, acknowledge to what extend they influence NPL pricing, and integrate them in the business plan.
17 Chapter 3 THE INTERNSHIP
3.1 Presentation of Arrow Global Group
Arrow Global was established in 2005, specializing in the purchase, collection and servicing of non-performing loans; it identifies, acquires and manages secured and unsecured defaulted loan portfolios from financial institutions, such as banks and credit card companies, as well as retail chains, student loans, motor credit, telecommunication firms and utility companies. Arrow Global combines a successful operating model pioneered in the US with local knowledge of the UK and European markets. The result is an innovative and flexible debt purchasing and management platform, which enables the creation of bespoke solutions for both customers and creditors.
Since Arrow´s stock market listing in October 2013 its growth has accelerated. From then onwards, the Group has expanded via internal development and selected acquisitions. In November 2014, the purchase of Capquest provided own in-house collections capability. In April 2015, WS was acquired together with Gesphone in Portugal cementing their position as a leading player in the country. In May 2016 InVesting B.V. in Holland and Belgium were also acquired by Arrow. In the same year Redrock was added to the Portuguese business. In April 2017, Zenith Service S.p.A. a leading Master Servicer -was acquired in Italy, and in December 2017, Arrow also acquired Mars Capital, strengthening its asset management capabilities, reinforcing its leading position in the UK, and providing a strategic entry into Ireland, a new market for the Group.
Arrow Global aims to hold a position as the most respected, responsible, and innovative debt purchaser, leading the market in compliance, risk management and treating customers in a fairly manner.
3.2 Whitestar and the main goal of the internship
Whitestar Asset Solutions, S.A. (WS) was founded in 2007. It is a full service, integrated credit servicing specialist, which offers advisory, real estate management, securitisation and structuring, analytics, and related loan portfolio investment services. WS is part of the Arrow Global Group. Before being acquired by Arrow, WS was an independent company, and a former child of the Lehman Brothers Group, the giant that fell with the Global Economic Crisis. The demise of its initial parent company had a strong impact on
18
WS. Yet, it managed to survive the difficult times post-fall and became a reference in the Portuguese NPL market, as servicer. Currently, the company has circa 500 employees, in offices in Lisbon and Porto.
WS business includes secured and unsecured NPL and, as a servicer, it is responsible for managing several different portfolios. In practice, typically, it is hired by an investor (in most cases Arrow Global) to develop and operationalize a business plan that aims at recouping as much as possible from specific NPL portfolios. Portfolios are originated by institutions and corporations, typically banks. Most of them contain several hundred credit contracts, many of which backed by assets, typically real estate. WS examines each and every contract before agreeing to manage the NPL portfolio. In order to do so, it follows a pre-defined plan. Pricing would be the first phase, included in the origination. Next, WS checks the potential return that it can earn with the portfolio. It does that by developing a specific business plan that attends to the specific nature of the credit contracts that make up the portfolio. A key aspect at this stage is to identify contracts deemed “ranking one”, which are those that offer the highest expected return according to WS proprietary pricing algorithm. Portfolios that offer a reasonable mix of credit contracts are considered for management by WS.
At the time of the internship, WS had several portfolios under management. For the purpose of this report two were chosen: Aureas and Badajoz. The first has been under management for a long period and constituted the main focus of the internship. In effect, it has already generated a considerable amount of data for study and analysis. In contrast, portfolio Badajoz is much more recent. Yet, it was also considered during the internship since it provides more recent cases that help enrich the study, and can also be used for validation purposes. Importantly, both portfolios are similar in terms of size and the type of assets they entail (mostly residential). This is a nice feature since it allows comparisons among the two.
The main goal of the internship was creating a new judicial time matrix for portfolios Badajoz and Aureas. In particular, drawing on existing knowledge, this internship aimed at revisiting parameters that were part of the judicial time matrix in use, from a different perpective, and, simultaneously, updating them; something that was expected to help increase WS’ managing performance.
19
Duration and location of the internship
The internship ran for 320 hours, corresponding to 40 working days. It was performed in Lisbon at Whitestar headquarters, as well as in another office, also in Lisbon. The headquarters are located in Oeiras, and the great majority of the departments are gathered there. There was a smaller office in Lisbon City Centre, wich housed specific services and departments such as the pricing team. Therefore, it was important to get acquainted to both dynamics, becoming easier to understand WS’ processes and organization. In addition, considering the particular topic developed during internship, it was important to cover the entire scope of contributions for it (operational, legal, pricing, real estate valuation and business analytics).
3.3 Concepts and theoretical considerations
Before going into the details of how the new judicial time matrix was elaborated it is necessary to clarify a number of concepts that are specific to WS’ vision about the NPL world. The next sub-sections help with this issue.
3.3.1 WS price walk and pricing model for secured NPL
The pricing of NPL is essential for WS business. As such, the firm has developed a number of Key Performance Indicators (KPIs) to monitor its performance. The main ones are the Average time to recover for claims and Real Estate Owners (REOs), the recovery percentage on Unpaid Principal Balance (UPB), the Weighted Average Life (WAL) and the average year-to-date (YTD) penetration rate.
Practical application of the KPIs follows well-defined rules. For instance, the recovery percentage on UPB distinguishes secured from unsecured debt. In particular, secured NPL is expected to generate 100% of recovery, whereas unsecured merely 20%. The difference suggests that secured and unsecured NPL must be handled and priced quite differently, a direct consequence of risk. Another example is the standard set for the WAL. In secured NPL, expected WAL is 32 months; its unsecured counterpart is 28 months. Although the WAL for unsecured NPL is smaller than that of the secured ones, its return on investment is typicall not has interesting. In fact, unsecured NPL has a lower marginal recovery percentage since unlike secured NPL it is not backed by real state.
20
WS resorts to portfolio analysis, advisory, modelling and business plan when pricing NPL. Hence, next the main steps of what WS defines as its price walk, a key ingredient in this context:
WS starts with the Outstanding Principal Balance (OPB) quantification, being the total amount in debt. The originator value represents the originator’s expectations over the property value, which may not be calibrated.
WS then adjusts the Originator appraisal values particularly in the case of properties with less liquidity and known to have less interest from an investor’s perspective. The seniority is also appraised, senior liens represent the amounts that have seniority over the Originator’s rank over the collateral’s value; this segment has a negative impact on the value of the portfolio.
The Loan to Value (LTV) denotes the overall quality of the portfolio, therefore its calculation is crucial. LTVs greater than 100% lessens considerably the value of the portfolio.
The gross target is then calculated as the minimum of the loan less any senior amounts or the asset value. Additional to the gross secured target, residuals and unsecured loans are projected. Importantly, WS typically considers that total costs represent 14% of the gross target; thus, the net target is the result of the gross target minus the total costs.
Additionally as contribution for these main steps resumed above, for Secured NPL, which is the focus of this study, the real estate valuation is paramount to the mentioned analysis and adjustments.
Real estate valuation is also a part of the pricing strategy, which can be performed via two appraisals: one external and another internal. External appraisal is independent and is provided by a certified company (selected according to asset type and geographic expertise), based on the available documentation (blueprints, registered property value, etc), supported by market research analysis and City Hall inquiries (when necessary). WS practices dictate that a good valuation requires using two alternative valuation methods and a minimum of three comparisons per appraisal report. The internal methodology consists in reviewing the information provided by the Originator (if any), a market analysis, verification of the average sale value by type and geography that WS records of the previous year and scouting local brokers’ opinion. Regardless of the path chosen, real estate valuations are always conducted by a dedicated in-house team.
21
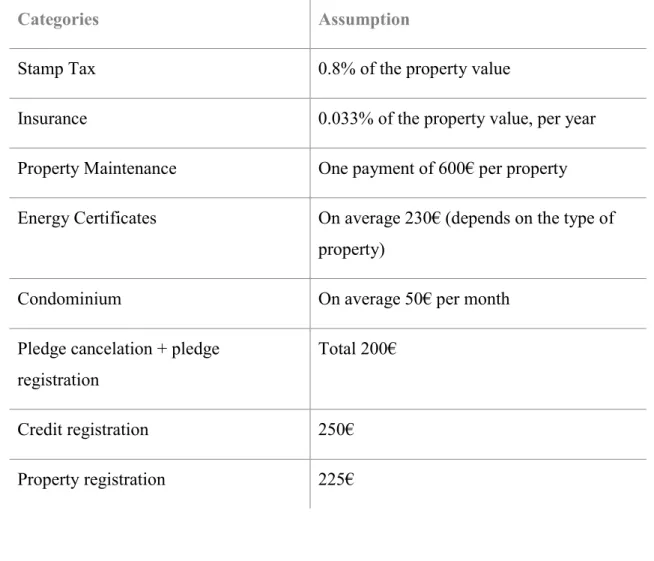
Most often than not, real estate under management by WS is eventually sold to recoup the associated debt. WS typically assumes that this will take 4 months in the case of a forced sale and 9 to 12 months for an open market value, notwithstanding the Business Plan value. As a result, WS must manage real estate properties over considerable periods, which is a cost-generating feature of the business. Business practice leads WS to consider, on average, 7 months to put a property under management in the market and an additional three months to complete the sale. Under this set-up, the following cost structure is applied in the pricing of the NPL backed by real estate1:
Table 3.1 – WS Cost categories for Real Estate
Categories Assumption
Stamp Tax 0.8% of the property value
Insurance 0.033% of the property value, per year Property Maintenance One payment of 600€ per property Energy Certificates On average 230€ (depends on the type of
property)
Condominium On average 50€ per month
Pledge cancelation + pledge registration
Total 200€
Credit registration 250€
Property registration 225€
22
Broker fees 5% + VAT of the property value for amounts greater than 50.000€. Below, on average 2.500€.
Valuations On average 100€ per property, once per year
Court and legal costs 5% for foreclosure, 10% for bankruptcy files
Source: WS
It should be emphasized that the pricing model applied to the evaluation of real estate assets follows a specific methodology. The assets included in each portfolio are organized according to the district, county and parish they belong to. Among other factors, it matters to discern which type of real estate is included, the construction year, typology, square meters amount, occupancy status and if it is marketable. It is crucial to be able to achieve an accurate value to fit the expectations of return. For this purpose, WS uses its historical data and, in addition, data from different sources, to propose a value that meets the reality. WS has a notable record of data; nevertheless, data from Instituto Nacional de Estatística (INE) and Confidencial Imobiliário are also gathered to help with the valuation procedure. Confidencial Imobiliário only deals with real estate and thus is a superior source than INE when the issue is real value of property, since they draw their data directly from actual sales. INE uses the official value of the deed, which may differ significantly from reality. Yet, such data can be useful, especially for most the recent years.
The pricing model for secured NPL encompasses the quatification of the secured debt amount, its quality, the costs associated to its recovery, the valuation of real state that backs the NPL and the time to recover debt.
23
3.3.2 The time line and judicial time matrices
Time is quite important in the NPL business. In fact, this is a cash-consuming activity since the investor must be able to put significant amounts of money upfront, in order to finance the managing period of the portfolio. Hence, the industry focus on the concept of the time line, i.e., the period it takes to transform the recently bought NPL portfolio into cash.
The time line is also very relevant for the pricing of NPL portfolios. In effect, regardless of the value of the assets in any given portfolio, it is always better to cash-in earlier than not. As such, it is very important to have a clear understanding of how long it will take to recover all the debts in the portfolio, i.e., to have a prediction of the timeliness of the cash-inflow that it will potentially generate. This is not an easy task since it depends on non-identical inputs that are difficult to accurately predict on a per debt contract basis. WS draws on its experience to overcome this issue. In particular, to get to the sales phase, a sequential number of steps need to be completed. These are: pledge, debtor summons, creditor announcements and sale. During these phases there are expenses to consider, and thus it is important to predict when they will occur. The CF prediction includes the sales and when they occur, as well as the expenses.
The CF prediction for outflow and inflow is embedded in the time line. Therefore, it is important to stablish its distribution over this time line. The CF distribution may be chosen considering assorted perspectives and goals, there is not a strict rule for it. For this study, it is considered a distribution of inflow that possibly fits better the reality. Assuming it is forecasted that a certain sale is going to occur at a specific date, the CF would not be admitted at once at that moment.
The CF is usually equally distributed amongst 12 months, provided that it occurs after 12 months or more, if not it would be evenly distributed within the number of months of the sale’s date. As an example, in case the sale occurs in the 14th month, the CF of 12000€, expected at this date, would be distributed over 12 months, 6 months before and after, thus 1000€ per month from the 8th to the 20th month. For sales within less than 12 months old, it would be spread following a similar reasoning, dividing the number of months by 2 and distributing half before and the other half after the date. For instance, if a sale occurs in the 4th month the CF of 12000€ is distributed over 4 months, 3000€ per month, 2 months before and after the sale.
24
The CF inflow occurs at once and distributing it would provide an inaccurate entry of cash, however, the moment of sale may not occur exactly at the specific moment it was forecasted and this distribution diminishes the impact of this inaccuracy. Althought the CF outflow prediction also matters, the costs are less challenging to examine, since they are close to fixed and not as influenced by market’s conditions as a sale. Considering the time line, it is preferable to focus on a strategy of forecasting the inflow, to be possible to draw the expected return on investment line, which benefits from this dissimination, as one of the appealing aspects of this kind of investment is corresponding to a regular cash inflow.
The time line importance is explicit and a method of translating and incorporating it in the pricing model is via time matrices, in particular judicial time matrices, as it is the judicial time that impacts them. WS has been developing these judicial time matrices over time, updating them regularly based on new data it keeps collecting in a systematic way. In the case of secured NPL, legal proceedings play a key role. Given the peculiarities of the Portuguese legal system, segmentation is required here. In fact, WS differenciates between process Foreclosure (FC), territory area, and Residential (RESI).
The judicial process may vary from foreclosure, bankruptcy, tax, injunction, litigation and forbearance measures (in Portuguese PER, plano especial de revitalização). Depending on the particular setting, legal phases will differ. It is also necessary to check whether the process was always of the same judicial type or not. This information matters to discern the timings of each phase without adding data that is not appropriate to fit an average value.
WS manages NPL all over Portugal but more significantly so in Lisbon, Porto, Setúbal and Faro. Superior time matrices would require data for each individual geographical area as this would allow factoring in the local dynamics and particularities.
The concept of “legal time” becomes important in this context. In fact, numerous debt contracts that are mortgage-backed end up in court. Data available shows that legal proceedings do not adhere to strict time-frame across the all of Portugal and, thus, developing city-specific time matrices would go a long way in optimizing WS’ ability to predict a more accurate time line for each case it manages. As such, WS would have a better view on the porfolios it manages as a servicer, clustering country areas.
25
3.3.3 Secured NPL and legal phases
When a loan is a NPL (after 90 days of non-performing) it can be claimed judicially or amicably. For a judicial claim backed by real estate, the outcome for WS is the sale of the underlying asset by the court or REO (Real Estate Owner). Provided that the claim is amicable it can turn into cash or DIL (Deed-in-Lieu). As such, WS has worked out internal policies to deal with secured NPL. These rely on key decision variables.
Firstly, there is the decision to choose whether there is an amicable resolution or a judicial one, as such some variables are considered for this analysis. In order to identify the propensity for amicable or legal resolution is used the client’s status; this status is defined by the asset manager (AM) and the status conditions are defined via information regarding use licenses and asset liquidity. When liens (junior and senior) amount are higher than 15% of the WSvalue, the amicable resolution is to be eschewed. The type of process is also important, since Bankruptcy (BK) does not permit amicable resolutions. Additionally, the tax liens are linked to tax legal type process; this kind of process will not proceed to asset sale when the asset is a client residence (in this case other procedures must be put into action to achieve the same goal).
Secondly, once the judicial resolution is deemed necessary, WS has a predefined guidance and strategy. Considering the guidelines, one factor stands out: the courts. Hence, courts are ranked by WS according to their performance. When the NPL leads to a foreclosure which is being dealt by an inefficient court, WS typically restarts the process in a new court or goes for a BK process. The idea is to minimize the expected time to return (ETR) of the process. In fact, according to WS’ strategy it is necessary to find the fastest path to cash money. As such, even when it is possible an amicable resolution, the legal process starts to be developed by the legal team to diminish the time to get return, in case the amicable resolution is not effective.
It is important to stress that, according to Portuguese law the creditor cannot automatically become the owner of the secured assets when the debtor defaults on its debt. Therefore, the usual process of enforcement requires seizure of assets and the implementation of an enforcement application to the competent court. For a given portfolio going for litigation and judicial resolution, the judicial enforcement workflow (secured loans) is as follows: Enforcement application, pledge, debtor summons, creditors announcement and sales, if necessary/included other pledges and process termination.
26
The litigation phases of the foreclosure process can be described in a brief manner. Enforcement application is when the asset management team analyses whether the file can be resolved extrajudicial. In case it cannot, there is a submission of an enforcement application to the competent court. The court receives the file and allocates an Enforcement Agent (EA) and the number to the court file. The EA is chosen by the creditor. WS rates EAs and chooses the ones with the best historical results.
During pledge, research is undertaken to identify which assets (properties), part of the debtor’s belongings, are possible be sold and are chosen the ones that shall be pledged. The debtor summons phase is when the debtors and guarantors are informed that an enforcement procedure was filed against them and which assets/income have been pledged; the debtors are notified of all documents that accompanied the petition, to allow them to understand it and oppose to it, in the event that they intend to. While creditors announcement, the court verifies whether there are other creditors related to the pledged assets; all known and unknown creditors, regarding the debtor, are notified to claim their credits in the process, if registered assets are pledged.
Once the debtor’s assets have been foreclosed, it is possible to commercialize the assets. The sale can be executed by closed letter or auction. The income from these sales will be dedicated to pay the debt to the enforcing creditor. The court defines the credit graduation to allocate the income to the creditors. On the condition that the debtors submit an opposition request, the process will have a delay, given that the decision is submitted to the judge. Oppositions are common in WS processes and, when they occur, WS usually wins the case, due to the fact that the entire documentation is guarantee at a prior phase. In fact, for the Aureas’ portfolio oppositions represent 0,06% of the total.
The legal phases for secured loans follow a structured order, which is always the same. Each phase has a predicted average time to be concluded, nevertheless, forecasts may vary. In addition, there are external factors that influence the timing, namely the updates and changes of the Law.
The legislation affects the timing of WS’ business plans. For instance, recently there was a reduction in judicial time due to a change in 2013 that affected Portuguese Civil Law. In particular, it is no longer needed to go to the Judge of Court for a pledge. Further, in 2016, another positive change was enacted, giving birth to the possibility of having
27
electronic auctions. These changes made the process more methodical and facilitated the sale of the assets under WS’ management.
Not all changes spurred WS’ business. In 2016, new legislation forbids pledging a family house with registered value below or equal to €500.000. Most of the assets under management at WS fall within this range and, as a result, other procedures are compulsory to conduct a sale of these assets, namely intending a BK process.
To be possible to effectively manage a portfolio it is important to gather information and the required documents, that are part of the assets included in each portfolio. Some assets do not have the legal documentation necessary for a sale, to secure that assets are appropriate and fully documented WS has a permanent Due Diligence team.
WS is the only servicer in Portugal that has a permanent Due Diligence team, specialized in secured debt portfolios. This team consists of finance and law specialists and real estate valuation technicians, with extensive experience in detailed loan file reviews. Moreover, they are capable of providing debt recovery strategies for clients, all types of debtors, credits and assets/collaterals. Due Diligences are tailored to individual client requirements, portfolios characteristics, originator’s timeline and process conditions.
3.4 Selected approach and relevant information
This study aims at creating a new judicial time matrix that can be used to improve the time line used by WS. The time matrices produced before the internship, by WS, followed another approach. This one is different and targets a good comparison with the existing analysis. It is important to differenciate it and understand why it followed distinct premisses.
3.4.1 Description of the approach
Tipically the cases that WS handles correspond to debt backed by real state and to recover this debt it is necessary to either amicably solve it, and retrieve the monthly renegotiated amount of the mortgage (or the total renegociated amount committed at once), or follow a judicial process and sale the asset to cash (at least part of) the outstanding and cover the associated costs.
28
These cases constitute the portfolio that the servicer manages. As management strategy, once the portfolio is under management the debtors are contacted for an amicable resolution and at the same time the judicial process commences, as the majority of the cases cannot be solved merely via amicable resolution. The judicial process is, therefore, contemplated for the entire portfolio and why it interferes deeply in the time line. In addition, as some processes do not complete all the phases (the amicable resolutions) and others were already pledged before WS starts managing, the importance of separating the phases becomes evident.
This separation of the phases benefits the quality of the results and facilitates the definition of the business plan. Constituting already a more accurate approach, it can still be enhanced, via improved data analysis (part 3.4.2 in detail) and further segmentation for the matrices. Regarding the case of Portugal the assets’ valuation is organized by area (as referred in part 3.3.1), as the conditions do not apply equally to the entire country. A similar reasoning can be followed for the judicial system, as the importance of impediments to the local judicial system impact differently the processes (part 2.4 EBA’s analysis - Figure 2.9). The portfolios Aureas and Badajoz, under management, were systematized via a different scope.
As mentioned above, the data employed comes from the Aureas and the Badajoz portfolios. Given the available data, Portugal was divided according to the following geographical areas:
Lisboa
Porto
Setúbal
Coimbra, Leiria e Santarém
Aveiro, Braga, Bragança, Viana do Castelo, Vila Real e Viseu
Beja, Castelo Branco, Évora, Faro, Portalegre, Região Autónoma dos Açores e Região Autónoma da Madeira.
It follows that, in the end, six different matrices for Portfolio Aureas and Badajoz would be achieved.