DOI: 10.1530/JOE-16-0610
http://joe.endocrinology-journals.org © 2017 Society for Endocrinology
Printed in Great Britain Published by Bioscientifica Ltd.
Journal
of
Endocrinology
381–394
apmateus and others Thermal imprinting affects stress
Research
233:3Thermal imprinting modifies adult
stress and innate immune
responsiveness in the teleost
sea bream
Ana Patrícia Mateus1,2, Rita A Costa1, João C R Cardoso1, Karl B Andree3, Alicia Estévez3, Enric Gisbert3 and Deborah M Power1
1Comparative Molecular and Integrative Biology, Centro de Ciências do Mar, Universidade do Algarve, Faro, Portugal 2Escola Superior de Saúde, Universidade do Algarve, Faro, Portugal
3IRTA-SCR, Unitat de Cultius Aqüicoles, Sant Carles de la Ràpita, Spain
Abstract
The impact of thermal imprinting on the plasticity of the hypothalamic–pituitary– interrenal (HPI) axis and stress response in an adult ectotherm, the gilthead sea bream (Sparus aurata, L.), during its development was assessed. Fish were reared under 4 thermal regimes, and the resulting adults exposed to acute confinement stress and plasma cortisol levels and genes of the HPI axis were monitored. Changes in immune function, a common result of stress, were also evaluated using histomorphometric measurements of melanomacrophages centers (MMCs) in the head kidney and by monitoring macrophage-related transcripts. Thermal history significantly modified the HPI responsiveness in adult sea bream when eggs and larvae were reared at a higher than optimal temperature (HT, 22°C), and they had a reduced amplitude in their cortisol response and significantly upregulated pituitary pomc and head kidney star transcripts. Additionally, after an acute stress challenge, immune function was modified and the head kidney of adult fish reared during development at high temperatures (HT and LHT, 18–22°C) had a decreased number of MMCs and a significant downregulation of dopachrome tautomerase. Thermal imprinting during development influenced adult sea bream physiology and increased plasma levels of glucose and sodium even in the absence of an acute stress in fish reared under a high–low thermal regime (HLT, 22–18°C). Overall, the results demonstrate that temperature during early development influences the adult HPI axis and immune function in a teleost fish.
Introduction
In mammals, the way in which pre-natal or post-natal ‘adverse challenges’ has an impact on the hypothalamic– pituitary–adrenal (HPA) axis is extensively studied and linked with dysfunction during adulthood and
associated pathologies (Fahmi et al. 2004, Breton 2013,
Devlin et al. 2013, Johnsen et al. 2013,
Gonzalez-Bulnes et al. 2014). Early life exposure to stress induces plasticity of the HPA axis and is associated with either hyper-responsiveness to a stress challenge or hypo-responsiveness characterized, respectively, by exaggerated
or attenuated levels of glucocorticoids (Elzinga et al. 2003,
Carpenter et al. 2007). Modifications in the HPA axis Correspondence should be addressed to D M Power Email [email protected] Key Words f confinement f HPI axis f melanomacrophage centers f plasticity f thermal imprinting Journal of Endocrinology (2017) 233, 381–394
Downloaded from Bioscientifica.com at 04/17/2020 09:40:50AM via free access
Journal
of
Endocrinology
during childhood are proposed to provoke dysfunction in adulthood due to epigenetic mechanisms that lead to persistent changes in the expression of genes such as the glucocorticoid receptor (GR), together with lifelong alterations in DNA methylation and histone 3 lysine 9
(H3K9) acetylation (Zhang et al. 2010).
Despite differences in stress axis organization between mammals and fish, the overall regulatory loop is conserved and the hypothalamic–pituitary–interrenal (HPI) axis in fish is the homologue of the HPA axis in mammals. Stress in fish triggers the release of hypothalamic, corticotropin-releasing hormone (CRH), which in turn stimulates the synthesis of the prohormone proopiomelanocortin (POMC) and release of adrenocorticotropic hormone (ACTH) from the pituitary. In the adrenal gland or interrenal tissue of the head kidney in fish, ACTH regulates the production of cortisol by modulating the rate-limiting enzyme, steroidogenic acute regulatory protein (StAR). Cortisol exerts its effect by binding to the GR in target cells and modifies a range of physiological processes such as metabolism and immune function to
maintain allostasis (Wendelaar-Bonga 1997).
The ability of juvenile and adult fish to cope with a stressor has been extensively studied, and cortisol levels are generally fairly well correlated with the performance
of fish under acute or chronic stress (Wendelaar-Bonga
1997, Mommsen et al. 1999, Prunet et al. 2008, Aluru & Vijayan 2009, Harper & Wolf 2009, Pankhurst 2011). A notable feature of the stress response in fish is its plasticity, and individuals of the same species can be
low- or high-cortisol responders (Barton 2002) and this
has led to the suggestion that genetic, developmental and environmental factors determine an individual’s
stress response (Pottinger & Pickering 1997, Barton 2002,
Barton et al. 2005, Cnaani 2006). Surprisingly, little attention has been given to understanding the potential lifelong consequences on the stress axis of early gene– environment interactions in teleost fish.
Temperature is a key regulator in ectotherms that strongly influences development and may have a long-term impact on phenotype or genotype
and influence adaptive evolution (Somero 2010,
Mozes et al. 2011). The developmental plasticity of fish means that modifications in the thermal regime during embryonic development can significantly
modify their developmental trajectory (Schaefer &
Ryan 2006). Skeletal deformities (Boglione & Costa
2011) and modifications in muscle fiber number and
growth (Johnston 2006, Garcia de la Serrana et al. 2012,
Vieira et al. 2012b) are well-established examples of phenotypic plasticity induced by thermal imprinting.
Exposure of early life stages of sea bass (Varsamos et al.
2006) and rainbow trout (Auperin & Geslin 2008) to
stress results in decreased cortisol production in juveniles exposed to stress. Stress not only acts on the central stress axis but also causes changes in the periphery to re-establish homeostasis, and one well-recognized target
is the immune system (Dhabhar 2008). In fish, as in
other vertebrates, the majority of stress responses lead to
suppression of the immune response (Tort 2011). Stressful
conditions including parasitic infections in fish induce modifications in the number, size and pigment content of aggregates of macrophages, the melanomacrophage centers (MMCs) of the piscine innate immune system (Fournie et al. 2001, Agius & Roberts 2003, De Vico et al.
2008), and this is the predominant immune response
during early development (Tort et al. 2003).
The present study characterizes the developmental plasticity of the stress axis to thermal imprinting in the gilthead sea bream (Sparus aurata), a teleost with a
well-studied stress response (Arends et al. 1999, Montero et al.
1999, Rotllant et al. 2001, Barton et al. 2005, Calduch-Giner et al. 2010). The hypothesis tested was that thermal imprinting during development would modulate the activity of the HPI axis and lead to a modified stress response in adults. The response to acute confinement stress of young adults that were exposed during development to different thermal regimes was assessed by determining the responsiveness of the HPI axis and elements of the secondary stress response. The influence of thermal history on immune responsiveness to stress at the level of the head kidney, a prominent immune tissue
in fish (Whyte 2007) was also evaluated.
Materials and methods
Early life programming
All the procedures for manipulation of embryonic and larval thermal regimes and rearing to juveniles as well as the stress challenge experiments were performed at the Institute for Aquaculture and Food Technology Research (IRTA), St Carles de la Ràpita, Spain, in a temperature-controlled seawater recirculation system (IRTAmar). All animal handling procedures were approved by the Ethics and Animal Care Committee (4998-T9900002) and were compliant with the guidelines of the European Union Council (86/609/EU), Spanish and Catalan Governments
Journal
of
Endocrinology
legislation. No evidence of infection, modified behavior or mortality was observed during the experiments.
Fertilized eggs of gilthead sea bream (fertilization rate = 92%) were maintained during embryogenesis at
18 ± 0.5°C (low temperature (LT)) or 22 ± 0.5°C (high
temperature (HT)) in duplicate tanks containing 110 mL of fertilized eggs per incubator (30 L). Newly hatched larvae were maintained under four different temperature
regimes (2 replicate tanks/group, Fig. 1/Supplementary
Fig. 1 and Supplementary Tables 1 and 2, see section on supplementary data given at the end of this article): 18°C from egg incubation through hatching and up until larvae-juvenile transition (LT), 22°C from egg incubation through hatching and up until larvae-juvenile transition (HT), 18°C from egg incubation up until hatching and
then 22°C until larvae-juvenile transition (LHT), and 22°C from egg incubation up until hatching and then 18°C up until larvae-juvenile transition (HLT). Fish from the
four temperature regimes were maintained in 2 m3 tanks
connected to a recirculating sea water system (5–10% water renewal per day; IRTAmar) under the same constant
temperature regime of 22 ± 1°C until they were 9 months
old. Fish from the four temperature regimes were fed 3% body mass (m/m) with a commercial diet (OptiBream; Skretting, Spain).
Confinement challenge and sampling
Duplicate tanks of fish from each thermal regime were exposed to an acute confinement stress. Sea bream stocked
Figure 1
Schematic representation of the experimental setup. (A) Temperature program imposed to gilthead sea bream from egg fertilization to larvae-juvenile transition. Four temperature treatments (thermal groups) were considered: 2 constant temperatures (18–18°C (LT) and 22–22°C (HT)) and 2 variable temperatures between incubation phase and larval rearing (22–18°C (HLT) and 18–22°C (LHT)). When the fishes’ bodies were covered with scales (larvae-juvenile transition), fish from all thermal groups were maintained at 22°C until the onset of the acute stress challenge by confinement (n = 20/ tank; 2 replicate tanks per thermal history group). Details about differences in the development of fish from different thermal regimes and the time of temperature change/group can be accessed in Supplementary Tables 1 and 2 and also in Supplementary Fig. 1B. Acute stress challenge by confinement and the sampling regime. Adult sea bream (n = 5/replicate tank) stocked at 20 kg/m3 were sampled prior to the application of an acute stress challenge (0 h). The remaining fish were exposed to an acute stress by reducing the level of water of each tank, which increased the density to 70 kg/m3. Fish were exposed to confinement stress for 30 min before returning them to the initial stocking density (20 kg/m3) and then sampled (n = 5/replicate tank/sampling time) at 1, 4 and 24 h after a stress challenge.
Journal
of
Endocrinology
at a density of 20 kg/m3 (n = 40/group, weight and length
are given in Table 1) were acclimated to the experimental
circuit for 1 week, which consisted of a recirculating sea water system (IRTAmar) with eight 200 L square fiberglass
tanks. Acclimating conditions were: 21 ± 1°C, pH 7.5–8,
35–36% salinity, >80% oxygen saturation and 12-h
light/12-h darkness photoperiod. Fish were fed by hand five times per day using a commercial diet (OptiBream, Skretting) at a ration level of 3% body mass (m/m). Fish (n = 5/tank) were sampled before application of the acute stress challenge (time 0). The remaining fish were exposed to an acute stress by increasing their tank density
to 70 kg/m3 by lowering the water level for 30 min before
increasing the water volume to return them to the initial stocking density. Fish were then sampled (n = 5 per tank/ sampling time) at 1, 4 and 24 h after the stress challenge. For sampling, fish were killed with an overdose (450 ppm) of 2-phenoxyethanol (Sigma-Aldrich) and blotted dry and blood was collected from the caudal vein using a
heparinized syringe, centrifuged at 7000 g for 4 min at
4°C and the plasma was stored at −80°C. The pituitary was removed and collected into RNAlater (Sigma-Aldrich) and stored at −80°C. The head kidney was dissected out and half of it was placed in RNAlater and the remainder was fixed in Bouin-Hollande for histomorphometric measurements of MMCs in the head kidney.
Biochemical analysis
Plasma cortisol (ng/mL) was measured using a
radioimmunoassay as previously described (Rotllant et al.
2005). Glucose (mmol/L) and total calcium (mmol/L)
in plasma samples were measured with glucose oxidase–peroxidase and o-Cresolphthalein colorimetric commercial kits (Spinreact 1001190 and 1001061, Spain, respectively). Total protein (mg/mL) was measured in plasma using a commercial kit, Protein Assay Dye Reagent Concentrate (#500-0006), a Quick Start BSA Standard
Set (#500-0207, Bio-Rad), and the manufacturer’s instructions were followed. Spectrophotometry of colorimetric assays was performed in 96-well plates using a plate reader (Benchmark, Bio-Rad). Osmolality (mmol/ kg) was determined using a vapor pressure osmometer (Vapro Wescor 5520, Utah, USA), and sodium (mM) and potassium (mM) concentrations were determined by flame photometry (BWB Technologies, USA).
MMCs morphometric analysis
Head kidney fixed in Bouin-Hollande (n = 3/tank/time point) was dehydrated through a graded ethanol series (70–100%) and embedded in low melting point paraffin wax using a tissue processor (Leica TP1020, Leica). Serial
longitudinal sections (5 μm) were cut using a rotary
microtome (Leica RM 2135) and mounted on glass slides coated with 3-amino-propyltriethoxysilane (APES; Sigma-Aldrich). One section per individual was stained with hematoxylin and eosin to assess general histology, and 3 slides containing 3 serial sections/slide with a gap of 5 sections (25 µm) between consecutive slides were stained with a combination of Alcian blue–Periodic Acid Schiff (PAS)–Orange G. Stained sections were observed using a microscope (Leica DM2000) equipped with a digital camera (Leica DFC480) and 1 section per slide was photographed.
The images obtained were analyzed using Fiji v1.47p
software (Schindelin et al. 2012). One field of 0.3 mm2 per
PAS stained section (n = 6/group/time point) was randomly selected and semi-automatic analysis of MMCs was carried out by setting a color threshold that highlighted
all dark pigment cells as red (Papadopulos et al. 2007).
The parameters analyzed were the number of MMCs with
an area superior to 0.001 mm2 (larger MMCs with a
well-defined oval shape); number of MMCs with an area equal
or inferior to 0.001 mm2 (smaller MMCs, poorly defined);
total number of MMCs and total area the MMCs occupied in the defined area.
Analysis of gene expression by quantitative real-time PCR (qPCR)
Total RNA from the pituitary was extracted using PureZOL RNA Isolation Reagent (Bio-Rad), and total RNA from the head kidney was extracted using a Maxwell 16 System (Promega) following the manufacturer’s instructions. The concentration and quality of the extracted RNA were determined using NanoDrop 1000 spectrophotometer Table 1 General physiological status of the gilthead sea
bream with different thermal histories.
Thermal history Weight (g) Length (cm)
LT (18–18°C) 155.7 ± 20.2a 15.79 ± 0.86ª
HLT (22–18°C) 180.2 ± 28.0b 16.20 ± 0.96ª
LHT (18–22°C) 227.1 ± 30.3c 18.03 ± 1.04b
HT (22–22°C) 201.1 ± 20d 16.99 ± 0.73c
Body weight (g) and standard length (cm) of fish from each thermal regime (n = 40). Data from all sampling times were pooled. Different letters indicate statistical significant difference between thermal groups. Data shown as mean ± s.d.; One-way ANOVA; P < 0.05.
Journal
of
Endocrinology
(Thermo Fisher Scientific). To eliminate contamination of genomic DNA, total RNA (2–9 µg) was treated with DNase using a DNA-free kit (Ambion). cDNA synthesis was carried out in a 20 µL reaction volume with 500 ng
of DNase-treated RNA, 200 ng of random hexamers
(Jena Biosciences, Germany), 100 U of RevertAid reverse transcriptase (Fermentas, Thermo Fisher Scientific), 8 U of RiboLock RNase Inhibitor (Fermentas) and 0.5 mM dNTPs. The reaction was incubated for 10 min at 20°C followed by 60 min at 42°C, and the enzyme was inactivated by heating for 5 min at 72°C.
qPCR was used to analyze the mRNA expression of candidate indicator genes of the central stress axis and associated with MMC function before (0) and 4 and 24 h after the acute stress challenge. To monitor how stress modulates the activity of the pituitary gland, the
duplicate pomc genes (α1 and α2) and gr were measured,
and in the head kidney, star and gr transcripts were measured. To assess MMC activity, expression of colony-stimulating factor-1 receptor (csf1r) and Tyrosinase (tyr) family members dct and tyr was quantified in the head kidney. Since members of the tyrosinase gene family are not described in sea bream, database mining and phylogenetic analysis were performed to identify them (Supplementary Fig. 2 and Supplementary Table 3).
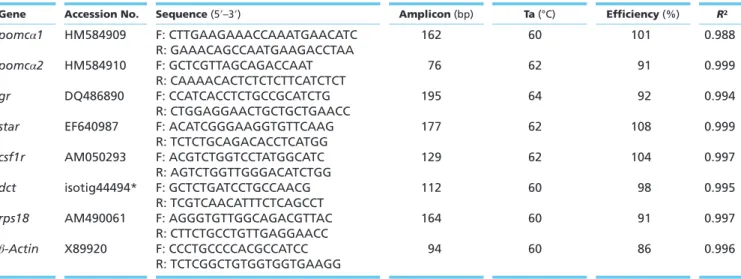
Specific primers for each transcript (Table 2) were
designed using Primer Premier 5.0 software (Premier Biosoft Int., CA, USA).
Reactions were performed in duplicate for a 15 µL final volume containing 10 ng of cDNA (25 ng for dct and tyr
mRNA expression analysis) and 300 nM of specific primers (Table 2) and EvaGreen (SsoFast EvaGreen supermix, Bio-Rad Laboratories). The reaction was carried out in a StepOnePlus qPCR thermocycler, and data were analyzed with StepOne software v2.2 (Applied Biosystems). qPCR cycling conditions were 30 s at 95°C, 40 cycles of 5 s at 95°C and 10 s at 60°C followed by a final melt curve between 60 and 95°C, which gave single product/dissociation curves in all reactions.
Transcripts were quantified using the relative
standard curve method (Vieira et al. 2012a), generated
using serial dilutions of specific qPCR products for each gene (obtained using the same species, tissues and primers for qPCR analysis). All amplicons were sequenced to confirm their identity. Control reactions included a no-template control and a cDNA synthesis control (reverse transcriptase omitted from the reaction). Two candidate reference genes routinely
used for sea bream (rps18 and β-actin) were tested in
pituitary and head kidney samples. Rps18 did not vary significantly in the pituitary samples and was used as
the reference gene. β-Actin did not vary significantly in
the head kidney and was used as reference gene. Results were calculated by dividing the detected copy number of the target gene by the reference gene in each cDNA sample and expressed as Log2 Fold Change. Results were calculated relative to the LT group at time 0, which was the group reared during the egg and larval stages using the standard temperature regime used for gilthead sea
bream (Mozes et al. 2011).
Table 2 Primers used for quantitative RT-PCR expression analysis.
Gene Accession No. Sequence (5′–3′) Amplicon (bp) Ta (°C) Efficiency (%) R2
pomcα1 HM584909 F: CTTGAAGAAACCAAATGAACATC 162 60 101 0.988 R: GAAACAGCCAATGAAGACCTAA pomcα2 HM584910 F: GCTCGTTAGCAGACCAAT 76 62 91 0.999 R: CAAAACACTCTCTCTTCATCTCT gr DQ486890 F: CCATCACCTCTGCCGCATCTG 195 64 92 0.994 R: CTGGAGGAACTGCTGCTGAACC
star EF640987 F: ACATCGGGAAGGTGTTCAAG 177 62 108 0.999
R: TCTCTGCAGACACCTCATGG csf1r AM050293 F: ACGTCTGGTCCTATGGCATC 129 62 104 0.997 R: AGTCTGGTTGGGACATCTGG dct isotig44494* F: GCTCTGATCCTGCCAACG 112 60 98 0.995 R: TCGTCAACATTTCTCAGCCT rps18 AM490061 F: AGGGTGTTGGCAGACGTTAC 164 60 91 0.997 R: CTTCTGCCTGTTGAGGAACC β-Actin X89920 F: CCCTGCCCCACGCCATCC 94 60 86 0.996 R: TCTCGGCTGTGGTGGTGAAGG
Gene name, accession number, primer sequence, amplicon length (bp), primer annealing temperature (Ta, °C) and qPCR efficiency (%) and R2 are indicated for each primer pair (F = forward and R = reverse).
Journal
of
Endocrinology
Statistical analysis
All statistical analyses were performed with SPSS 22.0 software (SPSS, 2013). No significant differences were detected between tank replicates, so all data of fish with a given thermal history at each time point were pooled. Two-way analysis of variance (ANOVA) was used to test the significant differences between fish with different thermal histories at different times after exposure to acute stress. One-way ANOVA was then performed to identify significant differences: (1) in the general physiological status of groups before the application of the acute stress challenge (time 0), (2) between different thermal history groups at the same time point (intergroup comparison) and (3) between the same thermal history group at different time points (intra-group comparison). If significant differences were detected, a Tukey’s multiple comparison test was performed. Data were considered significantly
different at P < 0.05. Log10 transformation of data was used
whenever necessary to achieve either normal distribution or equal variance assumptions, and data transformed for analysis are indicated in the respective figure legends.
Data are presented as mean ± standard error of the mean
(s.e.m.) unless otherwise stated.
Results
Characterization of the general physiological status of experimental fish at time zero
The general physiological status of fish with different thermal histories was assessed before the experimental challenge by measuring body weight and standard length (Table 1). One-way ANOVA revealed that fish from different
thermal regimes were significantly (P < 0.001) different in
most of the biometric parameters assessed. No significant differences in biometric parameters of experimental fish
were detected during the experiments (1, 4 and 24 h). Fish
from the LT group were significantly (P < 0.001) lighter
(155.7 ± 20.2 g) and shorter (15.79 ± 0.86 cm) than LHT
and HT fish (Table 1).
Basal plasma glucose concentrations were influenced by thermal imprinting (P = 0.025), and before the start of the experimental challenge, the HLT group exhibited
significantly (P < 0.05) higher glucose concentrations
than the other groups. Thermal imprinting also influenced plasma potassium, sodium and total protein
concentrations (Table 3). Early thermal regimes did not
significantly modify the plasma osmolality or calcium
concentration in adult fish (Table 3).
Before the onset of the acute stress challenge, no significant differences were detected in plasma cortisol levels between different groups and cortisol varied
from 5.35 ± 1.92 ng/mL (LHT) to 18.40 ± 7.89 ng/mL
(HLT, Fig. 2). In the pituitary, expression of pomcα2 was
significantly upregulated (P = 0.04) in the HLT relative to the LHT group at time 0, but thermal history did not have
an impact on pomcα1 transcript abundance. Similarly, star
transcripts in the head kidney were significantly (P < 0.05)
upregulated in the HT relative to the LT group. Gr transcripts in the head kidney and pituitary of sea bream with different thermal histories were not significantly different at time 0.
Thermal history had no significant impact on the
histology (Fig. 3) or transcript abundance of dct and csf1r
in the head kidney (Fig. 4).
Characterization of the fish physiological response to the acute stress challenge
Plasma cortisol Plasma cortisol levels were
significantly affected (P < 0.001, Two-way ANOVA) after
acute stress (Fig. 2). Thermal history did not significantly
modify the amplitude of the cortisol response in any of Table 3 Variation of secondary response parameters in gilthead sea bream with different thermal histories.
Thermal
history Glucose (mmol/L) Potassium (mM) Sodium (mM) Osm (mmol/kg) Protein (mg/mL) Calcium (mmol/L)
Time (h) 0 1 4 24 0 1 4 24 0 1 4 24 0 1 4 24 0 1 4 24 0 1 4 24
LT 4.3 ± 0.2a 4.2 ± 0.4 4.1 ± 0.6 4.0 ± 0.5 3.2 ± 0.2a 4.2 ± 0.4 4.3 ± 0.3a 4.7 ± 0.4 176.4 ± 2.5a 218.9 ± 15.0 225.8 ± 8.3 233.1 ± 6.7a 267.0 ± 7.0 347.6 ± 8.7 347.9 ± 6.5a 350.8 ± 9.0ab 21.8 ± 1.0a 21.9 ± 2.6 22.0 ± 1.4 23.6 ± 2.2ab 3.3 ± 0.1 3.3 ± 0.1a 3.1 ± 0.1a 3.3 ± 0.1 LHT 4.2 ± 0.4a 4.3 ± 0.3 3.9 ± 0.3 4.1 ± 0.7 3.4 ± 0.2ab 4.1 ± 0.4 4.2 ± 0.3a 4.7 ± 0.4 173.8 ± 8.7a 223.5 ± 5.2 226.7 ± 9.2 231.3 ± 13.1a 262.6 ± 7.5 344.6 ± 5.2 342.0 ± 5.2ab 358.6 ± 5.8a 21.6 ± 2.1a 21.7 ± 1.6 20.1 ± 2.7 24.9 ± 1.8a 3.4 ± 0.1 3.2 ± 0.1a 3.2 ± 0.1ab 3.3 ± 0.2 HT 4.3 ± 0.2a 4.3 ± 0.3 3.9 ± 0.6 3.7 ± 0.3 3.4 ± 0.2ab 4.0 ± 0.4 4.5 ± 0.3ab 4.5 ± 0.2 166.2 ± 2.4b 218.7 ± 4.5 219.4 ± 2.9 230.1 ± 7.2a 270.1 ± 10.6 340.2 ± 5.8 339.0 ± 5.5b 355.6 ± 8.7ab 24.3 ± 2.2b 21.3 ± 2.8 20.5 ± 2.7 23.7 ± 2.1ab 3.5 ± 0.3 2.9 ± 0.1b 3.1 ± 0.1a 3.3 ± 0.1 HLT 4.8 ± 0.5b 4.3 ± 0.4 4.2 ± 0.5 4.1 ± 0.7 3.6 ± 0.3b 4.1 ± 0.6 4.8 ± 0.4b 4.4 ± 0.2 199.6 ± 6.8c 214.4 ± 4.7 228.8 ± 13.7 214.8 ± 1.8b 268.9 ± 6.7 343.6 ± 5.0 347.3 ± 5.8a 346.4 ± 7.5b 21.9 ± 2.4ab 21.3 ± 2.1 21.0 ± 1.8 21.6 ± 1.6b 3.5 ± 0.3 3.1 ± 0.2a 3.3 ± 0.2b 3.4 ± 0.4
Glucose, potassium, sodium, electrolyte-water balance (osmolality), total protein and total calcium of plasma were measured prior (time 0) and after acute stress confinement (1, 4 and 24 h) in the different thermal regimes groups (LT (18–18°C); LHT (18–22°C); HT (22–22°C); HLT (22–18°C)). Statistical differences between the groups are indicated by different letters of the same sampling time. Data is shown as mean ± s.d. (n = 10 individuals per group
per sampling time); Two-way ANOVA; P < 0.05.
Journal
of
Endocrinology
the experimental groups at any of the time points post stress (intergroup comparison). Intra-group analysis revealed that a short-term hormonal response was observed in all groups irrespective of thermal history, and
1 h after confinement, cortisol levels significantly
increased to 113.6 ± 29.26 ng/mL (P < 0.001) in the LHT
group and to 37.2 ± 7.64 ng/mL (P < 0.01) in the HT group
when compared to time 0. Twenty-four hours after application of the stress, only the cortisol levels of the LHT group were significantly (P = 0.01) increased relative to basal levels.
Pituitary pomc transcripts Expression of the
duplicate pomcα1 and pomcα2 was modified after acute
stress challenge (P = 0.022 and P < 0.001, respectively,
two-way ANOVA), but only pomcα2 was significantly
(P < 0.001, Two-way ANOVA) modified by thermal history
(Fig. 2). Intergroup comparison revealed that at 4 h post
stress, significant (P = 0.04 and P < 0.001, respectively)
upregulation of both pomcα1 and pomcα2 transcripts was
observed in the HT fish relative to the LT at time 0. In the
same time period, only pomcα2 was significantly (P = 0.01)
upregulated in HLT and LHT relative to LT at time 0. At
24 h post stress, pomcα2 remained significantly (P < 0.05)
upregulated in LHT, HT and HLT and also became
significantly P < 0.05) upregulated in LT fish, all relative
to LT at time 0. Pomcα1 was also significantly (P < 0.05)
upregulated in the LHT and HLT fish at 24 h relative to LT
at time 0. In contrast, pomcα1 was significantly (P < 0.05)
downregulated in LT relative to HLT 24 h post stress.
Intra-group analysis revealed that pomcα1 was
significantly (P = 0.02) upregulated at 4 h in the LT fish relative to time 0 and then decreased significantly
(P = 0.02) at 24 h (Supplementary Table 4). Pomcα2 was
significantly (P < 0.05) upregulated in LHT and HT at 4
and 24 h, in relation to time 0 (Supplementary Table 4).
Head kidney star transcripts Two-way ANOVA revealed that after an acute stress challenge, a significant (P = 0.016) interaction occurred between thermal history and time in the relative abundance of star transcripts (Fig. 2). Intergroup comparisons revealed that the
expression of star was significantly (P < 0.05) upregulated
in the HLT fish 24 h post stress relative to LT at time 0. Intra-group analysis indicated that in HT fish, the expression
of star was significantly (P < 0.05) downregulated at 24 h
relative to 0 h (Supplementary Table 4). None of the
other groups revealed a significant modification in the expression of star.
Pituitary and head kidney gr transcripts Abundance of gr transcripts in the pituitary
was significantly (P < 0.001, two-way ANOVA) modified by
the stress challenge, but no significant effect was observed
in the head kidney (P > 0.05, two-way ANOVA, Fig. 2).
Intergroup analysis showed that at 4 h, gr expression in
the pituitary was significantly (P < 0.05) downregulated in
the LHT fish relative to LT at time 0. At 24 h, gr abundance
in the head kidney of LHT fish was significantly (P < 0.05)
upregulated relative to LT at time 0 and to HT fish. Intra-group analysis revealed that gr expression in the pituitary
at 4 h was significantly (P < 0.05) downregulated in all
groups relative to time 0, but by 24 h, returned to basal
levels (Fig. 2).
Characterization of the secondary response to acute stress challenge
Plasma glucose concentrations in response to acute stress
were significantly influenced by time (P < 0.001) and
thermal history (P = 0.025, two-way ANOVA, Table 3).
Intra-group analysis revealed that plasma glucose
significantly (P < 0.05, one-way ANOVA) decreased
Table 3 Variation of secondary response parameters in gilthead sea bream with different thermal histories.
Thermal
history Glucose (mmol/L) Potassium (mM) Sodium (mM) Osm (mmol/kg) Protein (mg/mL) Calcium (mmol/L)
Time (h) 0 1 4 24 0 1 4 24 0 1 4 24 0 1 4 24 0 1 4 24 0 1 4 24
LT 4.3 ± 0.2a 4.2 ± 0.4 4.1 ± 0.6 4.0 ± 0.5 3.2 ± 0.2a 4.2 ± 0.4 4.3 ± 0.3a 4.7 ± 0.4 176.4 ± 2.5a 218.9 ± 15.0 225.8 ± 8.3 233.1 ± 6.7a 267.0 ± 7.0 347.6 ± 8.7 347.9 ± 6.5a 350.8 ± 9.0ab 21.8 ± 1.0a 21.9 ± 2.6 22.0 ± 1.4 23.6 ± 2.2ab 3.3 ± 0.1 3.3 ± 0.1a 3.1 ± 0.1a 3.3 ± 0.1 LHT 4.2 ± 0.4a 4.3 ± 0.3 3.9 ± 0.3 4.1 ± 0.7 3.4 ± 0.2ab 4.1 ± 0.4 4.2 ± 0.3a 4.7 ± 0.4 173.8 ± 8.7a 223.5 ± 5.2 226.7 ± 9.2 231.3 ± 13.1a 262.6 ± 7.5 344.6 ± 5.2 342.0 ± 5.2ab 358.6 ± 5.8a 21.6 ± 2.1a 21.7 ± 1.6 20.1 ± 2.7 24.9 ± 1.8a 3.4 ± 0.1 3.2 ± 0.1a 3.2 ± 0.1ab 3.3 ± 0.2 HT 4.3 ± 0.2a 4.3 ± 0.3 3.9 ± 0.6 3.7 ± 0.3 3.4 ± 0.2ab 4.0 ± 0.4 4.5 ± 0.3ab 4.5 ± 0.2 166.2 ± 2.4b 218.7 ± 4.5 219.4 ± 2.9 230.1 ± 7.2a 270.1 ± 10.6 340.2 ± 5.8 339.0 ± 5.5b 355.6 ± 8.7ab 24.3 ± 2.2b 21.3 ± 2.8 20.5 ± 2.7 23.7 ± 2.1ab 3.5 ± 0.3 2.9 ± 0.1b 3.1 ± 0.1a 3.3 ± 0.1 HLT 4.8 ± 0.5b 4.3 ± 0.4 4.2 ± 0.5 4.1 ± 0.7 3.6 ± 0.3b 4.1 ± 0.6 4.8 ± 0.4b 4.4 ± 0.2 199.6 ± 6.8c 214.4 ± 4.7 228.8 ± 13.7 214.8 ± 1.8b 268.9 ± 6.7 343.6 ± 5.0 347.3 ± 5.8a 346.4 ± 7.5b 21.9 ± 2.4ab 21.3 ± 2.1 21.0 ± 1.8 21.6 ± 1.6b 3.5 ± 0.3 3.1 ± 0.2a 3.3 ± 0.2b 3.4 ± 0.4
Glucose, potassium, sodium, electrolyte-water balance (osmolality), total protein and total calcium of plasma were measured prior (time 0) and after acute stress confinement (1, 4 and 24 h) in the different thermal regimes groups (LT (18–18°C); LHT (18–22°C); HT (22–22°C); HLT (22–18°C)). Statistical differences between the groups are indicated by different letters of the same sampling time. Data is shown as mean ± s.d. (n = 10 individuals per group
per sampling time); Two-way ANOVA; P < 0.05.
Journal
of
Endocrinology
relative to basal levels in the HLT and HT fish 24 h after
acute stress (Supplementary Table 5).
Interaction between thermal history and time
significantly (P < 0.01, two-way ANOVA) modified plasma
protein together with potassium, sodium, calcium and
osmolality that were also significantly (P < 0.001,
two-way ANOVA) changed after confinement stress (Table 3).
Intergroup comparisons showed that at 24 h post
confinement, plasma osmolality and total protein were
significantly (P < 0.05) higher in the LHT fish relative to the
HLT fish. The HLT group also had a significantly (P < 0.05)
lower plasma sodium concentration at 24 h compared
to all other experimental groups. Calcium levels in the
HT group were significantly (P < 0.05) decreased 1 h post
confinement in relation to all other experimental groups. Intra-group analysis revealed that plasma sodium, potassium and osmolality increased significantly
(P < 0.05) in all groups 1 h after confinement and remained
significantly (P < 0.05) higher up until 24 h, in relation
to time 0 (Supplementary Table 5). In all experimental
groups, plasma calcium decreased significantly (P < 0.05)
1 h after the onset of acute stress relative to time 0 and
subsequently returned to basal concentrations 24 h
post confinement. Figure 2
Cortisol levels and expression of molecular indicators (pomc α1, pomc α2, gr and star) of the overall stress response of the four experimental thermal groups after acute stress confinement. Cortisol levels were Log10 transformed and measured before (0 h) and after acute stress at three time points (1, 4 and 24 h). Gene expression was assessed by qPCR at 0, 4 and 24 h, and in the pituitary gland, expression of pomcα1, pomcα2 and gr was normalized by the mean of rps18 expression, and in the head kidney, the relative gene expression of star and gr by the mean of β-actin expression. Normalized data were expressed as Log2 Fold Change relative to LT 18–18°C at 0 h. The results are plotted in Tukey box and whiskers graphs: LT (18–18°C); LHT (18–22°C); HT (22–22°C); HLT (22–18°C). ‘+’ represents the mean and dots the outliers (n = 10 individuals per group per sampling time). Different letters indicate statistical significant differences between the groups of the same sampling time (intergroup analysis). Capital letters under the graph of plasma cortisol indicate if significant differences exist between sampling times for each thermal group (intra-group analysis, ns = not significantly different). Groups with the same letter are not significantly different. Significant upregulation or
downregulation relative to LT (18–18°C) at 0 h was denoted by: *P < 0.05, **P < 0.01, ***P < 0.001 using two-way ANOVA.
Journal
of
Endocrinology
Characterization of MMCs following acute stress challenge
Histology of the head kidney MMCs were randomly distributed in the head kidney and were evident as large pigmented masses surrounded by highly cellular tissue stained with a purple or an orange hue due to the accumulation of lymphocytes and erythrocytes,
respectively (Fig. 3A). Occasional blood vessels
surrounded by cords of cells of interrenal tissue, pale
chromaffin cells and proximal renal tubules were evident in the tissue. The main changes 24 h after acute stress were a decrease in the number of small, highly pigmented masses in the LHT and HT groups and the change from well-delineated spherical MMCs to heterogeneous masses in the LHT group.
Thermal history and time after stress interacted
and were associated with a significant (P < 0.01,
two-way ANOVA) change in the number of small MMCs, Figure 3
Histological (A) and histomorphometric (B) analysis of gilthead sea bream MMCs in the head kidney before and 1, 4 and 24 h after the acute stress challenge. (A) MMCs in head kidney were stained with Alcian blue–Periodic Acid Schiff (PAS)–Orange G. Different thermal groups (LT (18–18°C); HLT (22–18°C); LHT (18–22°C); HT (22–22°C)) are represented. Erythrocytes enriched area is stained in orange, and lymphoid tissue is stained in purple. MMCs may consist in larger clusters of cells (area >0.001 mm2; arrowhead) or as free cells (area <0.001 mm2; arrow; e). MMCs may present a round (a), oval (c) or irregular shape (g) and is frequently observed near blood vessels (bv, e). Both free and larger MMCs contain dark brown pigmented material. ad, adipocytes. Scale bar = 100 µm. (B) Histomorphometric analysis of MMCs in a randomly selected area of 0.3 mm2 in head kidney: number of MMCs with an area equal or inferior to 0.001 mm2 (smaller MMCs), total number of MMCs found within the analyzed area and the total area (mm2) occupied by MMCs in the selected area. Analysis of MMCs was performed in unstressed fish (0 h) and during stress response (1, 4 and 24 h). Different thermal regimes (LT (18–18°C); LHT (18–22°C); HT (22–22°C); HLT (22–18°C)) are represented. Different letters indicate statistical difference between thermal groups of the same sampling time. Data shown as mean ± s.e.m.; two-way ANOVA; P < 0.05; n = 10. A full colour version of this figure is available at http://dx.doi.org/10.1530/JOE-16-0610.
Journal
of
Endocrinology
and consequently, the total number of MMCs, and also in the total area occupied by MMCs in the head kidney
at time 0 and during the acute stress response (Fig. 3B).
Intergroup comparisons revealed that thermal history had a significant (P = 0.01, one-way ANOVA) impact on the number of small MMCs and the total number of MMCs
and that the HLT fish had significantly (P < 0.05) fewer
MMCs at 1 h when compared to the LHT fish. Conversely, 24 h after acute stress, the LHT and HT fish exhibited
significantly (P < 0.05) fewer small MMCs relative to the
LT group. Although no significant differences were found between groups at 4 h post stress in the number of small and total MMCs, the total area occupied by MMCs was significantly (P = 0.01) smaller in the HLT group compared
to LT fish (Fig. 3B). Intra-group comparisons revealed
that the number of small MMCs in both LHT and HT
groups significantly (P < 0.05, One-way ANOVA) decreased
between time 0 and 24 h after acute stress, although the total area of MMCs in the head kidney was not significantly modified in these groups between 0 and 24 h post stress (Supplementary Table 6). The number of large MMCs was not significantly modified by confinement stress in any experimental fish at any time point (data not shown). qPCR of MMC relevant transcripts in the head kidney Csf1r expression was highly variable in all experimental groups and was significantly (P = 0.003, two-way ANOVA) affected by time after acute stress.
Intergroup analysis revealed that significant (P < 0.05)
upregulation of csf1r transcripts only occurred in the LHT group 4 h after acute stress exposure, relative to LT at 0 h (Fig. 4). Thermal history and time interacted and had a
significant (P < 0.001, two-way ANOVA) association with
dct downregulation 24 h post stress in all experimental
groups compared to LT at time 0 (Fig. 4). At the same
time, dct transcript abundance was significantly (P < 0.05)
downregulated in LHT and HT groups relative to the LT group. No significant changes between groups were identified at any other time point for any of the gene transcripts analyzed. Tyra transcripts were below the detection threshold for reliable quantification by qPCR and were excluded from the analysis (data not shown).
Discussion
The results of the present study suggest that, in common with mammals, early life stress modulates the stress
response in gilthead sea bream adults (Cottrell & Seckl
2009). Although all the sea bream from each thermal
group had a typical response to acute stress with significant differences in plasma cortisol across time (Arends et al. 1999, Tort et al. 2011), no significant intergroup differences were detected. However, the
concentration range of plasma cortisol (37.16 ± 7.64 ng/
mL) in fish reared during egg and larval stages at a higher temperature than the standard (HT) was lower than 50–80 ng/mL, typical of stressed Sparidae fish, 1 h after
an acute stress challenge (Tort et al. 2011). These results
are reminiscent of the lower cortisol response reported for European sea bass (Dicentrarchus labrax) juveniles that as larvae were reared at a higher than optimum
water temperature (Varsamos et al. 2006). Similarly,
when rainbow trout (Oncorhynchus mykiss) embryos were stressed, the magnitude of the cortisol response to stress in the subsequent juveniles was lowered
Figure 4
Relative expression of dct and csf1r in the head kidney before the onset of confinement (0 h) and during response (4 and 24 h) to stress. Transcript expression levels were obtained by qPCR and were normalized in relation to the mean of β-actin expression and normalized results were expressed as Log2 Fold Change calculated relative to LT 18–18°C at 0 h. The results are plotted in Tukey box and whiskers graphs: LT (18–18°C); LHT (18–22°C); HT (22–22°C); HLT (22–18°C) are represented. ‘+’ represents the mean and dots the outliers (n = 10 individuals per group per sampling time). Different letters indicate statistical significant difference between thermal groups of the same sampling time (intergroup analysis). Data are shown as mean ± s.e.m. (n = 10
per group) and significant upregulation or downregulation relative to LT (18–18°C) at 0 h was denoted by: *P < 0.05, **P < 0.01, ***P < 0.001 using two-Way ANOVA.
Journal
of
Endocrinology
(Auperin & Geslin 2008). Although no significant intergroup differences were observed in plasma cortisol, a temporal shift with delayed resolution in cortisol response was seen in LHT fish at 24 h post stress, which may be explained by a significant upregulation of gr in
head kidney (Vazzana et al. 2010, Teles et al. 2013).
Although no significant changes in cortisol response was detected between fish with different thermal histories, a change in the responsiveness of the HPI axis probably resulted from changes at several levels in this
axis. Significant differences existed in pomcα1 and pomcα2
pituitary expressions between fish reared at standard temperatures and the fish exposed to acute stress, and this response differed with thermal history. More consistent
differences were observed in relation to pomcα2 that is
synthesized by corticotrophs and processed and released as ACTH that acts on the interrenal and regulates
glucocorticoid production (Cardoso et al. 2011). A
significantly higher pomcα2 response was observed in the
HT and HLT groups, which had a lower median cortisol response, supporting the notion that higher than standard temperatures during embryogenesis (common to both treatment groups) modulate the activity of the HPI axis by
increasing the pituitary pomc expression (Bizuayehu et al.
2015). Increased relative abundance of Pomc transcripts
have been reported in adult mice exposed to an early life
stress (Wu et al. 2014).
The responsiveness of the HPI axis was also modified at the level of the head kidney, and basal star transcripts that encode the rate-limiting enzyme in the synthesis pathway of cortisol in the head kidney were significantly
higher (Stocco 2000) in the HT group, suggesting modified
activity of the cortisol producing pathway. An upregulation of star expression linked with lower cortisol production was observed in chronically stressed fish and was related to post-translational changes in the pre-existing pool of star mRNA, which led to modified biological activity of
the enzyme (Geslin & Auperin 2004, Castillo et al. 2008).
It remains to be established if a similar process occurred in the present study.
All experimental groups of sea bream had a classical stress response with strong downregulation of pituitary gr transcripts 4 h after acute stress, which suggests that the central activation of negative feedback on the stress axis was maintained irrespective of thermal history (Alderman et al. 2012). These results suggest that thermal imprinting during development in sea bream increased the responsiveness of the pituitary gland to stress but in a gr-independent manner. This contrasts with the
situation in mammals, in which exposure to stress during early development leads to reduced expression of GR in the hippocampus and reduced negative feedback on
the HPA axis relative to unstressed animals (Cottrell &
Seckl 2009). Future studies will be required to establish if increased pomc expression in sea bream is a consequence of reduced expression of hypothalamic gr or a result of epigenetic mechanisms at the level of the pituitary gland (Wu et al. 2014).
The mechanism by which early thermal regimes modified stress was not established, but it may be most likely linked to epigenetic modulation of the genome
by temperature (Bizuayehu et al. 2015). It has been
shown that epigenetic mechanisms cause a reduction in
hypothalamic GR expression (Cottrell & Seckl 2009) and
the increase in the expression of POMC in the pituitary
gland of amniotes (Wu et al. 2014) and that these changes
in gene expression are associated with hypermethylation
or hypomethylation of DNA, respectively (Jaenisch &
Bird 2003).
Thermal imprinting during early ontogeny modified the subsequent growth trajectory of the sea bream and changed the whole animal physiology even in the absence of a stress challenge, as plasma parameters related to hydromineral balance and osmoregulation were modified. It was notable that a drop in temperature at hatch (HLT group) had the most profound impact on the adult physiology, and HLT fish displayed significantly higher levels of glucose, sodium and potassium in relation to LT fish (the reference). Although in the present study the mechanism by which temperature after hatching modified the plasma glucose and ions in adult fish was not established, it may be linked to a time-specific window for temperature-induced epigenetic modulation (Bizuayehu et al. 2015).
The overall organization of the gilthead sea bream interrenal tissue was not modified by thermal history, and the MMCs had a typical morphology (large
encapsulated, small clusters or free pigmented cells; Fig. 3;
Meseguer et al. 1994). Different thermal histories were associated with a significantly modified immune response to stress in adults, and the number of small MMCs was reduced 24 h post stress in the LHT and HT groups relative to LT group. The reduction in the number of MMCs in the teleost fish head kidney has been proposed as a sign of immunosuppression and decreased phagocytic activity (Gregori et al. 2014). However, the expression of the well-established macrophage marker in gilthead sea bream csf1r (Roca et al. 2006) in the present study was highly variable
Journal
of
Endocrinology
and did not corroborate the histology that indicated less MMCs, and presumably less macrophages, were present 24 h post stress in the LHT and HT fish.
The melanosynthetic activity of the macrophages in MMCs has been demonstrated in Atlantic salmon (Salmo salar, Fagerland et al. 2013) and DCT, which is involved
in conversion of l-tyrosine into melanin, is expressed
exclusively in cells capable of pigment production (Steel et al. 1992). In addition, DCT has antioxidant and phagocytic functions in the innate immunity of
ectothermic vertebrates (Kovacs et al. 2012). In the
present study, a highly significant downregulation in dct expression occurred 24 h after the acute stress challenge in all fish. However, LHT and HT had a significantly greater downregulation compared to LT suggesting stronger suppression of innate immunity after a stress challenge
in these fish (Kovacs et al. 2012). In a short-term study
in sea bass exposed to thermal imprinting, juveniles had depressed serum IgM and higher susceptibility to a viral
challenge (Varsamos et al. 2006). Our results demonstrate
the effect of thermal imprinting not only on the HPA axis but also on innate immune elements of adults exposed to stress. It will be important to establish if these modifications are a consequence of the bioenergetics/ metabolic cost of a modified stress response or the result of temperature-induced epigenetic modifications of immune
genes (Bizuayehu et al. 2015).
The present study revealed that the temperature regime during early development of sea bream caused thermal imprinting with long-term consequences for physiological and homeostatic responses to a stressor in adults. Clearly, a change in temperature between egg and larval stages (HLT and LHT) and an increase in temperature (HT) above the optimum (16–19°C) modified the whole adult physiology (HLT) and attenuated the plasma cortisol response to an acute stress in an over-stimulated HPI axis (HT). Additionally, rearing larvae at higher temperatures (HT and LHT) resulted in a suppression of elements of the innate immunity in adults, but the reason for this change remains to be established; it may arise from changed bioenergetics/metabolic costs of a modified stress response or from epigenetic modifications of immune genes. The present results provide valuable information for future research about the epigenetic mechanisms underlying the plasticity of the stress axis and immune function.
Supplementary data
This is linked to the online version of the paper at http://dx.doi.org/10.1530/ JOE-16-0610.
Declaration of interest
The authors declare that there is no conflict of interest that could be perceived as prejudicing the impartiality of the research reported.
Funding
This study was funded by the project Lifecycle EU-FP7 222719 and national funds through FCT—Foundation for Science and Technology through project CCMAR/Multi/04326/2013. R A C is funded by FCT SFRH/ BD/81625/2011 grant and J C R C is supported by an auxiliary research contract under the project UID/Multi/04326/2013.
Acknowledgments
Authors are extremely grateful to G Macià, M Matas, S Molas and M Monllaó (IRTA) for their technical assistance in live prey production and gilthead sea bream larval and juvenile rearing.
References
Agius C & Roberts R 2003 Melano‐macrophage centres and their role in fish pathology. Journal of Fish Diseases 26 499–509. (doi:10.1046/ j.1365-2761.2003.00485.x)
Alderman SL, McGuire A, Bernier NJ & Vijayan MM 2012 Central and peripheral glucocorticoid receptors are involved in the plasma cortisol response to an acute stressor in rainbow trout. General and Comparative Endocrinology 176 79–85. (doi:10.1016/j.ygcen.2011.12.031)
Aluru N & Vijayan MM 2009 Stress transcriptomics in fish: a role for genomic cortisol signaling. General and Comparative Endocrinology 164 142–150. (doi:10.1016/j.ygcen.2009.03.020)
Arends R, Mancera J, Munoz J, Bonga SW & Flik G 1999 The stress response of the gilthead sea bream (Sparus aurata L.) to air exposure and confinement. Journal of Endocrinology 163 149–157. (doi:10.1677/ joe.0.1630149)
Auperin B & Geslin M 2008 Plasma cortisol response to stress in juvenile rainbow trout is influenced by their life history during early development and by egg cortisol content. General and Comparative Endocrinology 158 234–239. (doi:10.1016/j.ygcen.2008.07.002)
Barton BA 2002 Stress in fishes: a diversity of responses with particular reference to changes in circulating corticosteroids. Integrative and Comparative Biology 42 517–525. (doi:10.1093/icb/42.3.517)
Barton BA, Ribas L, Acerete L & Tort L 2005 Effects of chronic confinement on physiological responses of juvenile gilthead sea bream, Sparus aurata L., to acute handling. Aquaculture Research 36 172–179. (doi:10.1111/j.1365-2109.2004.01202.x)
Bizuayehu TT, Johansen SD, Puvanendran V, Toften H & Babiak I 2015 Temperature during early development has long-term effects on microRNA expression in Atlantic cod. BMC Genomics 16 305.
(doi:10.1186/s12864-015-1503-7)
Boglione C & Costa C 2011 Skeletal deformities and juvenile quality. In Sparidae: Biology and Aquaculture of Gilthead Sea Bream and Other Species, pp 233–294. Eds MA Pavilidis & CC Mylonas. Chichester, West Sussex, UK: Blackwell Publishing Ltd. (doi:10.1002/9781444392210)
Breton C 2013 The hypothalamus–adipose axis is a key target of developmental programming by maternal nutritional manipulation. Journal of Endocrinology 216 R19–R31. (doi:10.1530/JOE-12-0157)
Calduch-Giner JA, Davey G, Saera-Vila A, Houeix B, Talbot A, Prunet P, Cairns MT & Pérez-Sánchez J 2010 Use of microarray technology to assess the time course of liver stress response after confinement exposure in gilthead sea bream (Sparus aurata L.). BMC Genomics 11 193. (doi:10.1186/1471-2164-11-193)
Journal
of
Endocrinology
Cardoso J, Laiz-Carrion R, Louro B, Silva N, Canario AV, Mancera J & Power D 2011 Divergence of duplicate POMC genes in gilthead sea bream Sparus aurata. General and Comparative Endocrinology 173 396–404. (doi:10.1016/j.ygcen.2010.12.001)
Carpenter LL, Carvalho JP, Tyrka AR, Wier LM, Mello AF, Mello MF, Anderson GM, Wilkinson CW & Price LH 2007 Decreased adrenocorticotropic hormone and cortisol responses to stress in healthy adults reporting significant childhood maltreatment. Biological Psychiatry 62 1080–1087. (doi:10.1016/j. biopsych.2007.05.002)
Castillo J, Castellana B, Acerete L, Planas JV, Goetz FW, Mackenzie S & Tort L 2008 Stress-induced regulation of steroidogenic acute regulatory protein expression in head kidney of Gilthead seabream (Sparus aurata). Journal of Endocrinology 196 313–322. (doi:10.1677/ JOE-07-0440)
Cnaani A 2006 Genetic perspective on stress response and disease resistance in aquaculture. Israeli Journal of Aquaculture-Bamidgeh 58 375–383. (doi:hdl.handle.net/10524/19199)
Cottrell EC & Seckl JR 2009 Prenatal stress, glucocorticoids and the programming of adult disease. Frontiers in Behavioral Neuroscience 3 1–9. (doi:10.3389/neuro.08.019.2009)
De Vico G, Cataldi M, Carella F, Marino F & Passantino A 2008 Histological, histochemical and morphometric changes of splenic melanomacrophage centers (Smmcs) in sparicotyle-infected cultured sea breams (Sparus aurata). Immunopharmacology and Immunotoxicology
30 27–35. (doi:10.1080/08923970701812290)
Devlin M, Grasemann C, Cloutier A, Louis L, Alm C, Palmert M & Bouxsein M 2013 Maternal perinatal diet induces developmental programming of bone architecture. Journal of Endocrinology 217 69–81. (doi:10.1530/JOE-12-0403)
Dhabhar 2008 Enhancing versus suppressive effects of stress on immune function: implications for immunoprotection versus immunopathology. Allergy, Asthma and Clinical Immunology 4 2.
(doi:10.1186/1710-1492-4-1-2)
Elzinga BM, Schmahl CG, Vermetten E, van Dyck R & Bremner JD 2003 Higher cortisol levels following exposure to traumatic reminders in abuse-related PTSD. Neuropsychopharmacology 28 1656–1665.
(doi:10.1038/sj.npp.1300226)
Fagerland HA, Austbø L, Fritsvold C, Alarcon M, Rimstad E, Falk K, Taksdal T & Koppang EO 2013 Pathological pigmentation in cardiac tissues of Atlantic salmon (Salmo salar L.) with cardiomyopathy syndrome. Veterinary Research 44 107. (doi:10.1186/1297-9716-44-107)
Fahmi A, Forhead A, Fowden A & Vandenberg J 2004 Cortisol influences the ontogeny of both alpha-and beta-subunits of the cardiac sodium channel in fetal sheep. Journal of Endocrinology 180 449–455.
(doi:10.1677/joe.0.1800449)
Fournie JW, Summers JK, Courtney LA, Engle VD & Blazer VS 2001 Utility of splenic macrophage aggregates as an indicator of fish exposure to degraded environments. Journal of Aquatic Animal Health 13 105–116.
(doi:10.1577/1548-8667(2001)013<0105:UOSMAA>2.0.CO;2)
Garcia de la Serrana D, Vieira VL, Andree KB, Darias M, Estévez A, Gisbert E & Johnston IA 2012 Development temperature has persistent effects on muscle growth responses in gilthead sea bream. PLoS ONE 7 e51884. (doi:10.1371/journal.pone.0051884)
Geslin M & Auperin B 2004 Relationship between changes in mRNAs of the genes encoding steroidogenic acute regulatory protein and P450 cholesterol side chain cleavage in head kidney and plasma levels of cortisol in response to different kinds of acute stress in the rainbow trout (Oncorhynchus mykiss). General and Comparative Endocrinology
135 70–80. (doi:10.1016/S0016-6480(03)00283-1)
Gonzalez-Bulnes A, Astiz S, Ovilo C, Lopez-Bote CJ, Sanchez-Sanchez R, Perez-Solana ML, Torres-Rovira L, Ayuso M & Gonzalez J 2014 Early-postnatal changes in adiposity and lipids profile by transgenerational developmental programming in swine with obesity/leptin resistance. Journal of Endocrinology 223 M17–M29. (doi:10.1530/JOE-14-0217)
Gregori M, Miragliotta V, Leotta R, Cecchini S, Prearo M & Abramo F 2014 Morphometric evaluation of interrenal gland and kidney macrophages aggregates in normal healthy rainbow trout (Oncorhynchus mykiss) and after bacterial challenge with Yersinia ruckeri. Veterinary Medicine International 2014 7.
(doi:10.1155/2014/210625)
Harper C & Wolf JC 2009 Morphologic effects of the stress response in fish. ILAR Journal 50 387–396. (doi:10.1093/ilar.50.4.387)
Jaenisch R & Bird A 2003 Epigenetic regulation of gene expression: how the genome integrates intrinsic and environmental signals. Nature Genetics 33 245–254. (doi:10.1038/ng1089)
Johnsen L, Kongsted AH & Nielsen MO 2013 Prenatal undernutrition and postnatal overnutrition alter thyroid hormone axis function in sheep. Journal of Endocrinology 216 389–402. (doi:10.1530/JOE-12-0389)
Johnston IA 2006 Environment and plasticity of myogenesis in teleost fish. Journal of Experimental Biology 209 2249–2264. (doi:10.1242/ jeb.02153)
Kovacs D, Flori E, Maresca V, Ottaviani M, Aspite N, Dell’Anna ML, Panzella L, Napolitano A, Picardo M & d’Ischia M 2012 The eumelanin intermediate 5,6-dihydroxyindole-2-carboxylic acid is a messenger in the cross-talk among epidermal cells. Journal of Investigative Dermatology 132 1196–1205. (doi:10.1038/ jid.2011.457)
Louro B, Marques JP, Power DM & Canário AV 2016 Having a BLAST: searchable transcriptome resources for the gilthead sea bream and the European sea bass. Marine Genomics 30 67–71. (doi:10.1016/j. margen.2016.10.004)
Meseguer J, Lopez-Ruiz A & Esteban M 1994 Melano-macrophages of the seawater teleosts, sea bass (Dicentrarchus labrax) and gilthead seabream (Sparus aurata): morphology, formation and possible function. Cell and Tissue Research 277 1–10. (doi:10.1007/BF00303074)
Mommsen TP, Vijayan MM & Moon TW 1999 Cortisol in teleosts: dynamics, mechanisms of action, and metabolic regulation. Reviews in Fish Biology and Fisheries 9 211–268. (doi:10.102 3/A:1008924418720)
Montero D, Izquierdo M, Tort L, Robaina L & Vergara J 1999 High stocking density produces crowding stress altering some physiological and biochemical parameters in gilthead seabream, Sparus aurata, juveniles. Fish Physiology and Biochemistry 20 53–60. (doi:10.1023/ A:1007719928905)
Mozes N, Papandroulakis N, Vergara JM, Biswas A, Takii K & Ntatsopoulos A 2011 Production systems. In Sparidae: Biology and Aquaculture of Gilthead Sea Bream and Other Species, pp 169–198. Eds M Pavlidis & C Mylonas Chichester, West Sussex, UK: Blackwell Publishing Ltd.
(doi:10.1002/9781444392210)
Pankhurst NW 2011 The endocrinology of stress in fish: an
environmental perspective. General and Comparative Endocrinology 170 265–275. (doi:10.1016/j.ygcen.2010.07.017)
Papadopulos F, Spinelli M, Valente S, Foroni L, Orrico C, Alviano F & Pasquinelli G 2007 Common tasks in microscopic and ultrastructural image analysis using ImageJ. Ultrastructural Pathology 31 401–407.
(doi:10.1080/01913120701719189)
Pottinger T & Pickering A 1997 Genetic basis to the stress response: selective breeding for stress-tolerant fish. In Fish Stress and Health in Aquaculture, pp 171–193. Eds GK Iwama, AD Pickering, JP Sumpter & CB Schreck. Cambridge, UK: Cambridge Univ. Press.
Prunet P, Cairns MT, Winberg S & Pottinger TG 2008 Functional genomics of stress responses in fish. Reviews in Fisheries Science 16 157–166. (doi:10.1080/10641260802341838)
Roca FJ, Sepulcre MP, López-Castejón G, Meseguer J & Mulero V 2006 The colony-stimulating factor-1 receptor is a specific marker of macrophages from the bony fish gilthead seabream. Molecular Immunology 43 1418–1423. (doi:10.1016/j.molimm.2005.07.028)
Rotllant J, Balm P, Perez-Sanchez J, Wendelaar-Bonga S & Tort L 2001 Pituitary and interrenal function in gilthead sea bream (Sparus
Journal
of
Endocrinology
aurata L., Teleostei) after handling and confinement stress. General and Comparative Endocrinology 121 333–342. (doi:10.1006/ gcen.2001.7604)
Rotllant J, Redruello B, Guerreiro P, Fernandes H, Canario AV & Power D 2005 Calcium mobilization from fish scales is mediated by parathyroid hormone related protein via the parathyroid hormone type 1 receptor. Regulatory Peptides 132 33–40. (doi:10.1016/j. regpep.2005.08.004)
Schaefer J & Ryan A 2006 Developmental plasticity in the thermal tolerance of zebrafish Danio rerio. Journal of Fish Biology 69 722–734.
(doi:10.1111/j.1095-8649.2006.01145.x)
Schindelin J, Arganda-Carreras I, Frise E, Kaynig V, Longair M, Pietzsch T, Preibisch S, Rueden C, Saalfeld S & Schmid B 2012 Fiji: an open-source platform for biological-image analysis. Nature Methods 9 676–682. (doi:10.1038/nmeth.2019)
Somero GN 2010 The physiology of climate change: how potentials for acclimatization and genetic adaptation will determine ‘winners’ and ‘losers’. Journal of Experimental Biology 213 912–920. (doi:10.1242/ jeb.037473)
Steel K, Davidson DR & Jackson I 1992 TRP-2/DT, a new early
melanoblast marker, shows that steel growth factor (c-kit ligand) is a survival factor. Development 115 1111–1119.
Stocco D 2000 The role of the StAR protein in steroidogenesis: challenges for the future. Journal of Endocrinology 164 247–253. (doi:10.1677/ joe.0.1640247)
Teles M, Boltaña S, Reyes-López F, Santos MA, Mackenzie S & Tort L 2013 Effects of chronic cortisol administration on global expression of GR and the liver transcriptome in Sparus aurata. Marine Biotechnology 15 104–114. (doi:10.1007/s10126-012-9467-y)
Tort L 2011 Stress and immune modulation in fish. Developmental and Comparative Immunology 35 1366–1375. (doi:10.1016/j. dci.2011.07.002)
Tort L, Balasch J & Mackenzie S 2003 Fish immune system. A crossroads between innate and adaptive responses. Inmunología 22 277–286.
Tort L, Pavlidis M & Woo NY 2011 Stress and welfare in sparid fishes. In Sparidae: Biology and Aquaculture of Gilthead Sea Bream and Other Species, pp 75–94. Eds M Pavlidis & C Mylonas. Chichester, West Sussex, UK: Blackwell Publishing Ltd. (doi:10.1002/9781444392210.ch3)
Varsamos S, Flik G, Pepin J-F, Bonga SW & Breuil G 2006 Husbandry stress during early life stages affects the stress response and health status of juvenile sea bass, Dicentrarchus labrax. Fish and Shellfish Immunology
20 83–96. (doi:10.1016/j.fsi.2005.04.005)
Vazzana M, Vizzini A, Sanfratello MA, Celi M, Salerno G & Parrinello N 2010 Differential expression of two glucocorticoid receptors in seabass (teleost fish) head kidney after exogeneous cortisol inoculation. Comparative Biochemistry and Physiology Part A: Molecular and Integrative Physiology 157 49–54. (doi:10.1016/j.cbpa.2010.05.003)
Vieira F, Pinto P, Guerreiro P & Power D 2012a Divergent responsiveness of the dentary and vertebral bone to a selective
estrogen-receptor modulator (SERM) in the teleost Sparus aurata. General and Comparative Endocrinology 179 421–427. (doi:10.1016/j. ygcen.2012.09.018)
Vieira VL, Andree KB, Darias M, Estévez A, Gisbert E & Johnston IA 2012b Development temperature has persistent effects on muscle growth responses in gilthead sea bream. PLoS ONE 7 e51884. (doi:10.1371/ journal.pone.0051884)
Wendelaar-Bonga S 1997 The stress response in fish. Physiological Reviews
77 591–625.
Whyte SK 2007 The innate immune response of finfish – a review of current knowledge. Fish and Shellfish Immunology 23 1127–1151.
(doi:10.1016/j.fsi.2007.06.005)
Wu Y, Patchev AV, Daniel G, Almeida OF & Spengler D 2014 Early-life stress reduces DNA methylation of the Pomc gene in male mice. Endocrinology 155 1751–1762. (doi:10.1210/en.2013-1868)
Zhang T-Y, Hellstrom IC, Bagot RC, Wen X, Diorio J & Meaney MJ 2010 Maternal care and DNA methylation of a glutamic acid decarboxylase 1 promoter in rat hippocampus. Journal of Neuroscience 30
13130–13137. (doi:10.1523/JNEUROSCI.1039-10.201)
Received in final form 22 March 2017 Accepted 18 April 2017