Ciências Sociais e Humanas
Barriers to and Driving Forces for Energy
Efficiency in the Portuguese Industrial SMEs
Vasco Manuel Figueiredo Pereira
Dissertação para obtenção do Grau de Mestre em
Gestão
(2º ciclo de estudos)
Orientador: Prof. Doutor João José Matos Ferreira
iii
Abstract
Industry accounts for about one-third of global final energy use. However, despite the need for increased industrial energy efficiency, studies indicate that cost-effective energy efficiency measures are not always implemented, resulting in an ―energy efficiency gap‖, which is explained by the existence of barriers to energy efficiency. Considering that SMEs are usually less efficient than Large Enterprises (LEs), this study based on a survey among Portuguese industrial SMEs, investigates the barriers that are inhibiting the adoption of energy efficiency measures and how they vary over firm‘s characteristics and over sector. Additionally the study points some drivers that could overcome those barriers. The results support the existence of barriers to energy efficiency in Portuguese industry, where lack of capital and other investments priorities were considered the most important ones. Furthermore it concludes that factors related with public policy could overcome those barriers, suggesting the need of public intervention to increase the levels of energy efficiency in the Portuguese industry.
Keywords
v
Resumo
A indústria é responsável por cerca de um terço do consumo final de energia a nível mundial. No entanto, apesar da necessidade de aumentar a eficiência energética do sector industrial, vários estudos indicam que, apesar de rentáveis, nem sempre são adoptadas medidas de eficiência energética, originando assim, o chamado ―gap‖ de eficiência energética, que é explicado pela existência de barreiras de natureza económica, organizacional e comportamental. Considerando que as PME‘s são normalmente menos eficientes que as grandes empresas, o presente estudo baseado num questionário a PME‘s do sector industrial em Portugal, investiga as barreiras que inibem a adopção de medidas de eficiência energética e se essas barreiras diferem ou não consoante o sector de actividade e as características das empresas. Adicionalmente, o estudo aponta alguns factores impulsionadores que podem ultrapassar essas barreiras. Os resultados obtidos permitem concluir que existem barreiras à eficiência energética na indústria portuguesa, sendo as mais importantes a falta de acesso a capital e a existência de outras prioridades de investimento. Para além disso, este estudo conclui que existem alguns factores impulsionadores relacionados com políticas públicas que poderão superar as barreiras apontadas, sugerindo a necessidade de intervenção pública com o objectivo de aumentar a eficiência energética na indústria portuguesa.
Palavras Chave
vii
Table of Contents
1. Introduction ... 1
2. Energy efficiency and SMEs ... 3
3. Barriers to energy efficiency... 5
3.1 Economic Barriers ... 6
3.2 Organisational and behavioural barriers ... 9
4. Driving forces to energy efficiency ... 12
5. Methodology ... 13
6. Results ... 15
6.1 Perceived knowledge on energy efficiency... 15
6.2 Barriers to energy efficiency ... 18
6.3 Driving forces for energy efficiency ... 22
7. Conclusions ... 25 References ... 26 APPENDIXES ... 30 Appendix A ... 30 Appendix B ... 36
1
1. Introduction
The global concern due to the increase of primary energy consumption and the emissions of carbon dioxide (CO2) coming from the use of fossil fuels has driven the attention of public policy makers on energy efficiency.
Industry accounts for approximately one-third of global final energy use and almost 40% of total energy related CO2 emissions. Over last decades, industrial energy efficiency has improved and CO2 intensity has declined substantially in many sectors. However, this progress has been more than offset by growing industrial production worldwide. As a result, total industrial energy consumption and CO2 have continued to rise (IEA, 2009). With this scenario, improving energy efficiency should have high priority among policymakers. Furthermore, energy efficiency is also a question of competitiveness and cost saving at the level of firms (Worrel et al., 2009).
Current and future policy instruments may result in higher energy prices and thus further increase the demand for industrial energy efficiency. Increased globalization and the opening up of domestic markets within the European Union will make the implementation of cost-efficient energy efficiency measures within industry even more necessary (Rhodin and Thollander, 2006).
The European‘s Commission Action Plan for Energy Efficiency (2006b) aims to control and reduce energy demand and to take targeted action on consumption and supply in order to save 20% of annual consumption of primary energy by 2020 (compared to the energy consumption forecasts for 2020). This objective corresponds to achieving approximately a 1.5% saving per year up to 2020. In order to achieve substantial and sustainable energy savings, energy-efficient techniques, products and services must be developed and consumption habits must be changed so that less energy is used to maintain the same quality of life. The Plan sets out a number of short and medium-term measures to achieve this objective.
The Commission considers the biggest energy savings are to be made in the following sectors: residential and commercial buildings (tertiary), with savings potentials estimated at 27% and 30% respectively, the manufacturing industry, with the potential for a 25% reduction, and transport, with the potential for a 26% reduction in energy consumption. These sectoral reductions of energy consumption correspond to overall savings estimated at 390 million tonnes of oil equivalent (Mtoe) each year or €100 billion per year up to 2020. They would also
2 help reduce CO2 emissions by 780 million tonnes per year. These potential savings come in addition to an estimated 1.8% (or 470 Mtoe) reduction in annual consumption which would partly stem from other measures already adopted and normal replacements of material. Achieving the 20% reduction objective will help reduce the EU's impact on climate change and dependence on fossil fuel imports. The Action Plan will also boost industrial competitiveness, increase exports of new technologies and will have positive benefits in terms of employment. The savings made will, moreover, offset the investments put into innovative technologies.
Despite these objectives, recently, the European Commission (2011) estimated that is only on course to achieve only half of the 20% objective. In this way, the European Commission developed a new Energy Efficiency Plan, which determined action to tap the considerable potential for higher energy savings of buildings, transport, products and processes.
About 20% of the EU‘s primary energy consumption is accounted for by industry. This is the sector where progress in energy efficiency has been greatest. International Energy Agency (IEA, 2008) analysis show that substantial opportunities to improve industrial energy efficiency remain. Much of this potential can be captured through policies for promoting use of energy-efficient industrial equipment and improving overall efficiency through energy management. In this sector the IEA recommends policies for electric motors, enhanced energy management and policies that target small and medium sized companies (SMEs). In addition, high quality energy efficiency data for industry is required.
The new Energy Efficiency Plan (European Commission, 2011) sets that energy efficiency in industry will be tackled through energy efficiency requirements for industrial equipment, improved information provision for SMEs and measures to introduce energy audits and energy managements systems. Light industry has a high level of energy savings potential, because there is less focus on energy management practices in SMEs where energy is usually a small part of total overheads and low staffing levels result in less specialisation on particular cost-management practices (Jollands et al., 2011).
A common characteristic in the European economies is the fact that SMEs are the basis of their business structures and Portugal is not an exception to this rule. Effectively, the share of SMEs of the total enterprises in Portugal is 99.6 % (ISSMEI, 2008).
Although energy is an indispensable input in every sector of an economy, it is crucial for the industrial sector, which accounts, in Portugal for almost 28% of the total energy use at the national level (DGEG, 2009).
3 A recent study from Unión Fenosa (2010) shows that the potential energy savings in the Portuguese industrial SMEs could be up to 15,1%, representing savings of 135 million Euros and 680.000 tons of CO2 emissions avoided.
Obstacles such lack of information, lack of access to capital and short term pressure of the business environment, should be overcome in order to reduce energy bills and improve competitiveness. According to Sorrel et al. (2000) several studies show that cost efficiency conservation measures are not always implemented, implying the existence of an energy efficiency gap, explained by the existence of barriers to energy efficiency. These barriers differ depending on regional and sector-specific conditions
The purpose of this study is to investigate the existence of different barriers to the implementation of energy efficiency measures, in the industrial SMEs in Portugal and the driving forces that could overcome those barriers. Our analysis will be presented in six separate sections. The first three sections presents some literature review on the importance of the energy efficiency topic in SMEs, the barriers hindering the adoption of energy efficiency measures and the driving forces that could overcome those barriers. Section 5 gives a description of the sample and the methodology followed. Section 6 presents several results from the statistical models applied and finally, section 7 contains an evaluation and presents some conclusions for managers and policymakers.
2. Energy efficiency and SMEs
Energy efficiency means using less energy while maintaining the same level of service. It can be achieved either by decreasing total energy use or by increasing the production rate per unit of energy consumed. In a manufacturing facility, according to Önüt and Soner (2006), energy efficiency can be achieved by improving operation and maintenance practices, using higher efficiency equipments and providing advanced systems to control energy use.
The high energy cost share in companies from energy-intensive industries provides a strong economic incentive to find and realise efficiency potentials, making them quite aware of the potential cost savings from investing in energy efficiency (Schleich e Gruber, 2008).
For Cagno et al. (2010), considering that SMEs are usually less efficient than Large Enterprises (LEs), should have the attention of Governments, since they represent more than 99% of the total number of industries and consume about 40% of the total for the sector. Cagno et al. (2010) pointed six reasons why Governments should play attention towards SMEs:
1. Since in SMEs the manager/owner has to cover a number of different roles like operations, administration, sales, marketing and planning, the company does not own an internal structure able to be focused on energy consumptions.
4 2. Consequently, and related with the point above, the time devoted to energy
efficiency activities is quite limited.
3. Due to limited economical resources devoted to energy efficiency analyses and measures, compared to LEs, SMEs have a limited access to the know-how of energy management and practices.
4. Several studies identified that there is a strong financial barrier: usually payback times of more than 2-3 years are consider, as prohibitive for SMEs, while generally LE can afford investments for even more than 8-10 years.
5. Need of matching the problems emerged during an energy check-up with the respective measures that may be implemented.
6. SMEs just for their structure do present in terms of technology and processes adopted a variety of situations much more extended with respect to LEs.
In the SMEs even if energy cost is a small proportion of the operational cost, the savings made will add directly to the profit margin, but generally, energy cost is receiving relatively little attention from the managerial point of view. The most important reason is lack of the required knowledge about the SMEs, and it is often difficult to reach (Önut and Soner, 2006).
de Groot et al. (2001) conclude that the most important impediments to not (yet) investing in energy-saving technologies are the existence of other, more attractive investment opportunities, incomplete depreciation of the existing capital stock and that energy costs are not sufficiently important. Ramesohl et al. (1997), who investigated the implementation of energy efficiency in industrial, commerce and service companies, argue that the actors‘ behaviour is affected by their own perception of organisational culture and social reality and is not exclusively rational. Their results show that energy efficiency can be ignored due to factors as scarce personnel, who are concentrated on core production issues like output and quality. Zilahy (2004) find that environmental awareness is one of the most important organisational factors determining the level of environmental measures within an organisation.
In the next section, we will develop deeper the theoretical framework beyond barriers to energy efficiency.
5
3. Barriers to energy efficiency
According to Fleiter et al., (2011) many studies have presented empirical evidence for the existence of barriers to energy efficiency. The studies found that many cost-effective measures for energy efficiency are not known to firm or they are not often implemented – even when they have low payback times suggesting that there must be ―other‖ factors, than financial ones, that determine these investments.
Sorrell et al., (2000) define a barrier as ―a postulated mechanism that inhibits investment in technologies that are both energy efficient and (apparently) economically efficient‖ (p. 11). Jaffe and Stavins (1994), define market barriers as any factors that may account for the existence of the energy efficiency gap.
The implementation of technologies and practices which reduce energy consumption at the level of private and public organisations or individual households is often hindered by obstacles. Barriers such as transaction costs, hidden costs, the investor/user dilemma, technological and financial risks, or organisational and behavioural constraints may prevent energy-efficiency measures from being realised (Schleich e Gruber, 2008).
According to Weber (1997) a review of the literature leads to a broad classification of barriers into three groups: i) neoclassical; ii) behavioural; and iii) organisational. The three groups form perspectives that highlight particular aspects of a complex situation. DeCanio (1993) attributes them to the following reasons:
1) firms do not behave like individuals even though economic theory simplifies that a firm behaves so;
2) firms operate with satisficing‘ rather than ‗maximizing‘ economic theory of profit; 3) asymmetric information and divergent incentives;
4) problems of focus and attention;
5) statistical or selection bias in estimating investment returns.
According to Sardianou (2008) factors hindering industrial energy investments are mainly financial constrains, economic parameters, market imperfections, and organisational and human related factors.
For effectively dealing with barriers to electricity conservation programmes, Painuly and Reddy (1996) identified six important factors:
1) Technical—lack of availability, reliability and knowledge of efficient technology; 2) Institutional—lack of right technical input, financial support and proper programme;
6 3) Financial—lack of explicit financial mechanisms;
4) Managerial—lack of training, improper managing;
5) Pricing—lack of rational pricing of electricity and other fuels;
6) Information—lack of appropriate information, information diffusion problems.
According to mainstream economic theory, barriers related to market failures, e.g. imperfect information, split incentives, adverse selection and principal-agent relationship, justify public policy intervention in the market (Jaffe and Stavins, 1994). Moreover, barriers have shown to differ depending on regional and sector specific conditions (Sorrell et al., 2000), indicating a need for regional and sector specific studies in order to observe these barriers.
A thorough understanding of the nature of these barriers is crucial when designing cost-efficient policy measures. Most empirical analyses of barriers to energy efficiency are in the form of case studies, where theory-based hypotheses are derived from various concepts grounded in neo-classical economics, institutional economics, organizational theory, sociology, and psychology (Schleich, 2009).
3.1 Economic Barriers
Economic barriers are defined as the set of market, public policies and institutional failures that inhibit the diffusion of energy saving technology (Sathaye and Bouille, 2003).
Heterogeneity, hidden costs, lack of access to capital, and risks are barriers which may be categorized as non-market failures, i.e. these barriers exist even though the market is functioning (Jaffe and Stavins, 1994).
Heterogeneity is associated with the fact that even if a given technology is cost-effective on
average, it will most probably not be so for some firms. Heterogeneity holds in particular for production processes where firms are often specialized in one type of goods and where an energy efficiency measure is then difficult to implement in another firm. Even though very similar goods are produced, small deviances in the products such as different size and shape inhibit the measure‘s being undertaken in another firm (Jaffe and Stavins, 1994).
Hidden costs are a wider definition of the more commonly cited transaction costs (Ostertag,
1999). Hidden costs refer, for example, to the costs associated with an investment that are not reflected in commonly used investment calculations, e.g. the payback method, which causes the hidden cost to be neglected in the investment calculation.
7 Overhead costs, which incorporates costs for information systems and for the decision
making process
Specific investment costs, embeds additional costs that originate from installation costs, but also additional staff and maintenance costs.
Loss of benefits, this group includes benefits that are forgone as a result of the adoption of the new technology
Limited access to capital may prevent energy efficiency measures from being implemented (Jaffe and Stavins, 1994; DeCanio and Watkins, 1998). When access to the capital market is constrained, the allocation of funds within an organisation becomes even more important. In addition, internal decision-making and priority setting may not only depend on hard investment criteria such as the rate of return or payback time of an investment project, but also on soft factors such as the status of energy efficiency, reputation, or the relative power of those responsible for energy management within the organisation (DeCanio, 1994; Sorrell et al., 2004).
Risk is another commonly cited barrier where investments in energy efficiency technologies
are not undertaken due to different types of risk (Hirst and Brown, 1990; Jaffe and Stavins, 1994).
Sorrel et al. (2000) defined three categories of risk:
External risk, that is associated with the overall economic trend, uncertainty about
future energy prices and public policy
Business risk, regards sector and company trends and irreversibility of decisions
Technical risk, which includes unreliability surrounding new technologies
In first place, even if organisations have easy access to capital at relatively low prices, the uncertainty associated with the returns from investments may be prohibitive. For investments in energy efficiency, the uncertainty is primarily caused by stochastic future energy prices. On the one hand, risk-averse investors will demand higher returns from assets with uncertain yields. On the other hand, investments in energy efficiency lower the energy bill and thus reduce the financial risks associated with energy price uncertainty (Howarth and Sanstad, 1995). That is, if risk-averse investors consider the effects of stochastic energy prices on the returns of the investment project only, they are expected to invest less. But if they take into account the effects on company costs and profits, they may actually invest more because overall company costs and profits become less volatile. On the other hand, such investments reduce companies' ―risk exposure‖ since less emissions need to be covered once energy-efficient technologies are implemented (Schleich and Gruber, 2008).
8 Second, postponing irreversible investments in energy efficiency may be optimal if future energy prices are uncertain (Hassett and Metcalf, 1993; van Soest and Bulte, 2001). Since larger companies can diversify their portfolio at a lower cost, and since risk aversion is likely to decrease with wealth, smaller companies are expected to be more risk-averse and to demand higher returns from investments (Schleich and Gruber, 2008).
Finally, the technology risk is concerned to the fact that qualitative attributes of new technologies may make them less desirable than existent, less efficient technologies (Jaffe and Stavins, 1994). If energy-efficient technologies are unreliable, the risk of breakdown and disruption might outstrip any potential gains from reduced energy costs (Schleich, 2009).
Jaffe and Stavins, (1994) identified also market failures such split incentives, principal-agent relationship, adverse selection and imperfect information.
Split incentives are a condition where two parties have different incentives for their actions.
A commonly cited example is the landlord-tenant relationship, where the latter is not interested in energy efficiency if the energy costs are not included in the rental cost (Brown, 2001).
The principal-agent problem arises due to lack of trust between two parties at different
levels within society or a business organization. For example, the owner, who may not be as well informed about the site-specific criteria for energy efficiency investments, may demand short payback rates/high hurdle rates on energy efficiency investments due to his or her distrust in the executive‘s ability to carry out such investments. This may prevent cost-effective energy efficiency investments being undertaken (DeCanio 1993; Jaffe and Stavins, 1994).
Adverse selection is closely related to the accuracy of the information. It exists when one
party has private information, before entering into a contract to buy or sell. For example, the value of a house should reflect its energy efficiency. Despite this information is available for the seller, potential buyers have difficulty in evaluating energy savings. Thus, their bids on the house will be too low. In the end, only energy-inefficient houses (or technologies) may be on the market and investment in improving energy efficiency is lower than it would be with symmetric information (Schleich, 2007).
Yet another commonly cited market failure is imperfect information which relates to insufficient information about the energy performance of different technologies and its potential savings. Imperfect information is argued to lead to sub-optimal decisions based. Transaction costs include the costs of gathering, assessing and applying information about energy savings potentials and measures, as well as the costs associated with finding and
9 negotiating the contracts with potential suppliers, consultants or installers, or the costs of reaching, monitoring and enforcing contracts (Coase, 1991). If the transaction costs for a particular measure are high, the investment may not be profitable. For example, since gathering information about energy-efficient measures or about the energy performance of particular technologies is costly, firms may not have sufficient information about the ways to save energy.
Similarly, firms may not be aware of the savings potential because they do not–or for technical reasons cannot–measure energy consumption regularly. Even if energy consumption is measured regularly, it may not be at the level of individual buildings, rooms, or end-use equipment. Thus, if organisations do not have the relevant data on energy-efficient measures or energy use available, the savings potential from implementing energy-efficient technologies remains unknown and investments cannot be properly appraised (Schleich and Gruber, 2008).
3.2 Organisational and behavioural barriers
Organisational and human factors have also been raised in the literature as a potential explanation of unexploited profitable energy saving investments. As organisational factors are considered the size of the company, its industrial sector, the available infrastructure and human behavioural factors like the motivation and awareness of the employees and organisational culture (Zilahy, 2004).
Models of organisational barriers define firms as social systems influenced by objectives, routines, organisational structures, etc. Organisations are dominated by decision-makers. Barriers to energy efficiency in organisations may result from asymmetry of information, a trade-off with non energy specific goals or missing responsibility with regard to energy consumption. Obstacles may occur in budgeting, in acquisition of new equipment, or in operation service and maintenance (Weber, 1997).
For a theoretical explanation of the investment behaviour of firms Velthuijsen (1995) distinguishes different types of behavioural mechanisms. Where the neoclassical theory is extreme in his simplifications, the organizational theory of the firm is on the other side of the theoretical spectrum. Instead of considering firms as static points, the organizational theory regards firms as ―organizational bodies‖, consisting of several hierarchically placed but imperfectly co-ordinated sub-particles or sub-units, each with possibly differing goals, and consequently, differing views, attitudes, interests, instruments and constraints‖ (Velthuijsen, 1995). Sorrel et al. (2000) created a framework, completed with input by energy experts. The following two concepts explain the efficiency gap from an organizational perspective:
1. Organizational structure 2. Organizational culture
10 Closely related with the organizational structure is the concept of power. Power influences who gets what, when and how and can take a variety of forms, such as (Sorrel et al., 2000):
Formal authority
Control of scarce resources Structure
Information and knowledge
The second organizational aspect that hinders the implementation of energy saving technologies theory deals with organizational culture. As pointed out by Sorrel et al. (2000), whereas it cannot be drawn as a barrier, however it may be a relevant variable in explaining adoption of energy efficient measures. It is strongly related to the behavioural perspective. Culture is the core basic assumptions and beliefs of a company; the position of environmental values is a typical example of it.
Behavioural barriers focus on individuals with their values and attitudes towards energy conservation. Obstacles may occur as lack of attention towards energy consumption, lack of perceived control or a missing link between attitude and action. Social norms and lifestyle patterns may also hinder individuals to use energy more efficiently. Individuals may act as private subjects or in social roles, such as members of political party or business managers (Weber, 1997).
When faced with a complex decision structure, agents may not be able to optimise because of lack of time, attention, or the ability to adequately process information. Instead, bounded
rationality may result in using routines or rules of thumb (Simon, 1959). Similarly, when
making decisions about investment priorities, firms are likely to focus on the core production process rather than on ways to save energy costs. Likewise, in cases where investments in energy-efficient technologies are being considered, the same profitability or payback criteria may be required as for the core production technologies, although the economic risks associated with the former are much lower (Schleich and Gruber, 2008). Moreover, the form
of information given is of importance. People are more likely to act on information if it is
specific and presented in a vivid and personalized manner and comes from a person who is related to the receiver (Stern and Aronson, 1984). The latter is closely related to credibility
and trust in the information provider. It is important that a firm implementing an energy
efficiency technology can rely on the party providing the information (Stern and Aronson, 1984). Finally, if in an organization, there are individuals opponents to change, that may result in some inertia on the adoption of energy efficiency measures (Stern and Aronson, 1984).
Table 1 summarizes the economic, organizational and behavioural barriers to energy efficiency.
11
Table 1: Classification of barriers to energy efficiency based on Sorrel et al. (2000) and Rhodin et al.
(2007).
Theory Barrier Comment
Economic (Non market
failure)
Access to capital Energy efficiency measures could not be adopted because limited access to capital
Hidden costs
Examples of hidden costs are overhead costs, inconvenience, production disruptions, cost of collecting and analyzing information
Heterogeneity Energy efficiency measures could be cost-efficient, but they aren‘t applicable in the company
Risk Risk aversion may be the reason why energy efficiency measures are constrained by short pay-back criteria.
Economic (Market failure)
Imperfect Information
Lack of information on market conditions, technology and consumer‘s behavior may lead to cost-effective energy efficiency measures opportunities being missed.
Adverse selection
If suppliers know more about the energy performance of goods than purchasers, the purchasers may select goods on the basis of visible aspects such as price.
Split Incentives
If a persons or department cannot gain benefits from an energy efficiency investment, it is likely that implementation will be of less interest.
Principal-Agent Relationships
The fact that the principal cannot observe what the agent is doing could lead in strict monitoring and control by the principal and thus result in neglecting of energy efficiency measures Organizational Power
Lack of power within energy management may result in lower priority to energy issues within organizations.
Culture A group of individuals holding environmental values may encourage energy efficiency investments.
Behavioural
Bounded rationality
In theory decisions are based on perfect information, in reality they are made by the role of thumb.
Form of Information
Information should be specific, vivid, simple and personal in order to increase its chances of being accepted.
Credibility and trust
The information source should be credible and trustworthy in order to successfully deliver information regarding energy efficiency measures.
Inertia Individuals within an organization who are opponents to change may result in neglecting energy efficiency measures
Values
Efficiency improvements are most likely to be successful, if there are individuals with real ambition, preferably represented by a key individual within top management.
12
4. Driving forces to energy efficiency
As mentioned above, market failures may justify public policy intervention in the market (Jaffe and Stavins, 1994). A driving force might be seen as a factor that stresses investments in technologies that are both energy efficient and cost-effective (Thollander and Ottosson, 2008). In this paper, the driving forces were categorized into different types, namely market related driving forces, potential energy policies as well as organizational and behavioural factors, following a similar approach used by Thollander and Ottosson (2008), in a study about the Swedish paper and pulp industry.
Market related driving forces
A firm being a utility maximising unit tries to minimize its costs and in relation to energy tries to achieve cost reductions resulting from lower energy use. One market related driving force is thus cost reductions resulting from lower energy use (de Groot et al., 2001; del Rio Gonzalez, 2005). Other market related factors stressing the implementation of cost-effective energy efficiency measures include the threat of rising energy prices (Rohdin and Thollander, 2006). Moreover, energy service companies (ESCOs) and third party financing are other possible means of lowering the use of energy (European Commission, 2006b).
Potential energy policies
Potential energy policies include investment subsidies for energy efficiency technologies (Farla and Blok, 1995), offering detailed support from energy experts when implementing energy efficiency investments (Rohdin and Thollander, 2006), publicly financed energy audits by energy consultant/sector organizations (Anderson and Newell, 2004), beneficial loans for energy efficiency investments (European Commission, 2006a) and fiscal arrangements (de Groot et al., 2001)
Behavioural and organizational related driving forces
de Groot et al. (2001) found, for example, that green image of corporation was an important driving force in a Dutch study. In another related study, conducted by del Rio Gonzalez (2005), the author outlines a number of factors, both behavioural and organizational, that affect the implementation of pro-active environmental technologies such as personal commitment of managers. Other cited drivers include people with real-ambition, which is closely linked to personal commitment of managers, long-term energy strategy, environmental management systems, (Rohdin and Thollander, 2007) and improved working conditions (Masurel, 2007).
13
5. Methodology
In Portugal, official energy balances, partition final energy consumption into seven end-use sectors: Agriculture and Fishery, Mining and Quarrying, Manufacturing Industry, Construction, Private Households, Services and Transports. Manufacturing Industry accounts for about 28% of final energy consumption and industry in general accounts for almost 35% in electricity consumption (DGEG, 2010).
The study carried out, following previous studies (de Groot et al., 2001; Sardianou, 2008) models barriers to energy efficiency in Portuguese industries employing cross section data. Additionally, this study, also analyses driving forces to the adoption of energy efficiency measures, based on other previous studies, namely on Swedish industries (Rhodin and Thollander, 2006; Thollander and Ottosson, 2008). Empirical analysis was made based on a survey. The form of the survey was a questionnaire which was sent by e-mail for 1835 companies selected from a database of the Portuguese Statistical Institute. Industrial firms from six sectors where selected, namely: food and beverages, textiles, metals and machinery, paper and pulp, chemicals and other non metallic mineral products (ceramic, glass and cement industry) (See table 2 for NACE description).
Table 2 - Description of sub sectors
Sector NACE Description NACE
number
Food and Beverages Manufacture of food products Manufacture of beverages
10 11 Textiles Manufacture of textiles
Manufacture of wearing apparel
13 14 Paper and Pulp Manufacture of paper and paper products 17
Chemicals
Manufacture of chemicals and chemical products Manufacture of basic pharmaceutical products and pharmaceutical preparations
Manufacture of rubber and plastic products
20 21 22 Other non metallic
Mineral Products
Manufacture of glass and glass products
Manufacture of other porcelain and ceramic products Manufacture of cement, lime and plaster
23.1 23.4 23.5
Metals and Machinery
Manufacture of basic metals
Manufacture of fabricated metal products, except machinery and equipment
24 25
14 These industrial sectors were according with the Energy Balance (DGEG, 2010) the most energy intensive ones, representing more than 90% of energy consumption in manufacturing industry. The survey resulted in a data set of 75 industrial firms (response rate of 4,1%). It should be noted that other studies questioning barriers to energy efficiency investments were also based on small data sets and in small response rates(Harris et al., 2000; de Groot et al., 2001; Luna et al., 2007; Sardianou, 2008). The distribution by sectors and sizes of the sample firms is evidenced in Table 3.
Table 3 - Description of the sample
Variable Description Percent
Sector
Food and Beverages Textiles
Paper and pulp Chemicals
Other non-metallic products Metals and Machinery
10,67 33,33 5,33 17,33 16 17,33 Size
Less than 10 workers From 10 to 49 Workers From 50-99 Workers From 100-249 Workers 13,33 49,33 18,67 18,67
The survey asked firms about some of their characteristics like number of employees, size of establishment in square meters, year of construction of the establishment, sales, sector to which it belongs, their knowledge on energy saving measures and their perception regarding to barriers and driving forces for energy efficiency.
Based on the survey, we applied different models, supported by some descriptive statistics, to draw the main conclusions of the study.
First, in order to gather information on whether perceived knowledge on energy saving measures varies over sector and with firm characteristics we applied a chi-square test of independence and a logit model, respectively. Second, to obtain information on whether the barriers to adopt energy measures vary over sectors we applied a chi-square test of independence for each barrier and each sector. Finally, we use the Spearman rank correlation coefficient to analyze the relation between barriers and the driving forces for energy efficiency.
15
6. Results
6.1 Perceived knowledge on energy efficiency
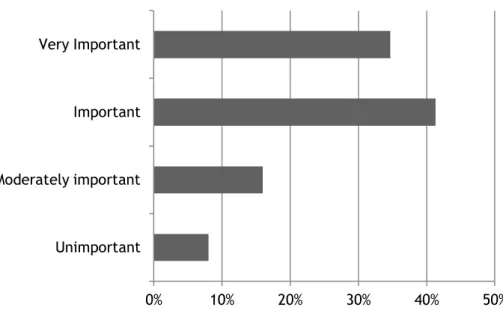
In one of the central parts of the questionnaire, firms where asked about the factors that they perceived as preventing them to adopt energy efficiency measures. Most firms in the survey considered that energy efficiency is an important factor in their investment decisions, as shown in Fig. 1.
Fig. 1 – Relative importance of energy efficiency in general investment decisions
However, despite the importance attributed by the firms to the energy topic in their investment decisions, only 58% of the firms consider that they know the energy efficiency measures that they can adopt.
Before proper investment decisions can be made, adequate knowledge is required on the various alternative investment opportunities or measures to be adopted. Lack of information, as seen in the section before, is a principal source of market failures. To obtain knowledge on suitable measures of energy efficiency, most firms, accordingly to this survey, turn out to rely on equipments suppliers. Also the workers of the firm, energy supply industry and consultants appear to be intensively used to gather information (See Fig. 2). Public organisations, like Energy Agencies and the Government play a minor role in providing firms with information on energy saving technologies.
0% 10% 20% 30% 40% 50%
Unimportant Moderately important Important Very Important
16
Average score (4 pt. scale)
Fig. 2 – Relative importance of information sources on energy saving measures. (score 1 is ‗unimportant‘, score 4 is ‗very important‘)
As far as perceived knowledge is concerned, approximately 42% of the firms indicate that they are not aware of energy efficiency measures that they could adopt. These results suggest that future policy can improve upon the situation by providing firms with relevant information on investment possibilities in energy saving measures.
In order to gather information on whether perceived knowledge varies over sectors we applied a chi-squared test of independence and we can conclude that there is a differentiated knowledge about energy efficiency measures among sectors, as shown in Table 4.
Table 4 – Perceived knowledge on energy saving measures: sectors, chi-squared independence test Independent Variables:
Sectors
Dependent Variable:
Firm’s perceived knowledge on energy saving measures
No N (%) Yes N (%) (p-value)
Food and Beverages Textiles Paper and Pulp Chemical Other Non-metallic products Metals and Machinery Total 4 (50%) 13 (52%) 0 (0%) 2 (15,4%) 5 (41,7%) 7 (53,8%) 31 (41,3%) 4 (50%) 12 (48%) 4 (100%) 11 (84,6%) 7 (58,3%) 6 (46,2%) 44 (58,7%) =10,592 (0,060**)
Note: ** denote significance at 10% level.
0 1 2 3 4 Clients Friends/Family Conferences/Seminars/Workshops Sectoral/Professional Associations Network of contacts Energy Agency/Government Internet External Consultants Energy supply industry Workers of the company Equipments Suppliers
17 We can see that firm‘s perceived knowledge on energy saving measures is especially high in Paper and Pulp industry and in Chemical industry.
Furthermore, in order to analyse the impact of firm characteristics in the perceived knowledge on energy efficiency measures we applied a logit model, where the independent variables were the following:
Sales – quantitative variable indicating the value of sales.
Square Meters – quantitative variable indicating the dimension, in square meters, of the
industrial establishment.
Number of employees – quantitative variable indicating the number of employees.
Establishment years – quantitative variable indicating the number of years of the industrial
establishment
Person – dummy variable, where 1 indicates that firm has a specific person responsible for
energy management and 0 otherwise.
Monitoring - dummy variable, where 1 indicates that energy consumption in the firm is
frequently monitored and 0 otherwise.
Audit – dummy variable, where 1 indicates that the firm realised an energy audit in the past
three years and 0 otherwise.
The results obtained are expressed in Table 5.
Table 5 – Perceived knowledge on energy saving measures: firm‘s characteristics, logit model
β S.E. Wald df Sig. Exp(β)
Sales 0,000 0,000 0,659 1 0,417 1,000 Square meters 0,000 0,000 1,365 1 0,243 1,000 Number of employees -0,002 0,008 0,042 1 0,837 0,998 Establishment year -0,049 0,027 3,321 1 0,068** 0,952 Person 0,233 0,929 0,063 1 0,802 1,263 Monitoring 1,631 0,950 2,947 1 0,086** 5,111 Audit 3,125 1,260 6,147 1 0,013* 22,761 Constant 1,217 1,104 1,216 1 0,270 3,377 pseudo- Nagelkerke 0,589
-2Log Lilekihood (sig) 50,270 (0,66)
(sig) 36,883 (0,000) N observations 75
18 Based on the results above, firms that monitor their energy consumptions and that have already done an energy audit tend to be more aware of energy saving measures, which is not surprisingly, because they have more information about their energy consumption and measures that they could adopt.
Another significant firm characteristic is the number of years of the industrial establishment. According to the results obtained, the older the industrial establishment is, lower is the perceived knowledge on energy efficiency measures.
Unlike other studies (de Groot et al., 2001; Sardianou, 2008) it was not found statistical evidence that firms with large number of employees have higher perceived knowledge on energy saving measures.
6.2 Barriers to energy efficiency
In the survey, questions on perceived barriers to energy efficiency within the organisation were not directed at specific technologies, but rather at energy efficiency measures in general. Fig. 3 shows the relative importance of barriers to adoption of energy efficient measures. A likert scale score from 1 to 4 has been assigned to each question in order to have a rank of the results from the questionnaire, where scores range from 1 (barrier is not important) to 4 (barrier is very important).
19
Fig. 3 – Relative importance of barriers to energy efficiency (score 1 is ‗unimportant‘, score 4 is ‗very important‘).
0 1 2 3 4
Conflicts of interest within the company Limited Knowledge of the owner/manager Lack of skilled staff Technical risk Energy objectives not integrated in
company's procedures Cost of staff replacement, retirement,
retraining
Technology inappropriate at this site Lack of staff awareness Lack of time/other priorities Difficulty/cost of obtaining information on
the energy consumption of purchased equipment
Lack of information on energy efficiency opportunities
Cost of production disruption/hassle/incovenience Slow rate of return of the investments Other investment priorities Lack of capital
20 The most important barrier for firms is the lack of capital. Other studies have found that limited access to capital may constitute a substantial barrier to energy efficiency (Sorrel et al., 2000; Rhodin et al., 2007; Sardianou, 2008)
.
Other major important barriers identified by the respondents are other investment priorities, slow rate of return of the investments and cost of production/disruption. The survey by Harris (2000) among Australian firms revealed that 35% the non-realized but recommended efficiency projects were not implemented because they were assigned a lower priority than investment projects in the firm‘s core business. The slow rate of return of the investments was also one of the major barriers identified by Sardianou (2008) in Greek industrial firms and cost of production/disruption was identified as major barrier in the Swedish pulp and paper industry (Thollander and Ottosson, 2008).
On the other hand, the less important barriers are: conflicts of interest within the company, limited knowledge of the owner/manager and lack of skilled staff. We can conclude by these results that the most important barriers for the firms surveyed are economic related, particularly barriers related to access to capital and hidden costs.
In order to obtain information on whether the energy efficiency barriers to adopt energy efficient measures vary over sectors we applied a chi-square test of independence for each barrier and each sector.
Table 6 shows that only two barriers could be considered to differ among sectors, namely the ―inappropriate technology at this site‖ and the ―cost of staff replacement and retraining‖. Inappropriate technology is considered of higher importance for the chemical and paper industry and less important for the food and beverages, metals and machinery sectors. The cost of staff replacement and retraining is considered of major importance in the other non-metallic and paper industries.
Since the other barriers are not statistically significant, we didn‘t present the frequencies associated in Table 6. We can conclude that they do not differ among sectors.
21
Table 6. Barriers to implementation of energy efficiency measures: sectors, chi-squared test of independence
Dependent Variables:
Barriers (1-Important; 0-Not important) Independent Variables: Sectors Food and Beverages N (%) Textiles N (%) Paper and Pulp N (%) Chemical N (%) Other non-mettalic products N (%) Metals and Machinery N (%) (p-value)
B1 [Technology inappropriate at this site]
0 1 4 (66,7%) 2 (33,3%) 9 (47,4%) 10 (52,6%) 1 (25%) 3 (75%) 2 (15,4%) 11 (84,6%) 5 (50%) 5 (50%) 8 (66,7%) 4 (33,3%) 9,434 (0,093**) B2 [Cost of production disruptions/hassle / inconvenience] --- --- --- --- --- --- 1,245 (0,941)
B3 [Cost of staff replacement, retiring, retraining]
0 1 4 (57,1%) 3 (42,9%) 13 (56,5%) 10 (43,5%) 1 (25%) 3 (75%) 8 (61,5%) 5 (38,5%) 1 (9,1%) 10 (90,9%) 8 (61,5%) 5 (38,5%) 11,513 (0,042*) B4 [Lack of capital] --- --- --- --- --- --- (0,648) 3,336
B5 [Lack of information on energy efficiency opportunities] --- --- --- --- --- --- (0,136) 8,400
B6 [Other investment priorities] --- --- --- --- --- --- (0,344) 5,721
B7 [Technical risk] --- --- --- --- --- --- (0,405) 5,093
B8 [Energy objectives not integrated in company‘s procedures] --- --- --- --- --- --- (0,659) 3,267
B9 [Slow rate of return of the investments] --- --- --- --- --- --- (0,401) 5,046
B10 [Difficulty/cost of obtaining information on the energy consumption
of purchased equipments] --- --- --- --- --- --- (0,160) 7,929
B11 [Lack of time/other priorities] --- --- --- --- --- --- (0,264) 6,456
B12 [Lack of skilled staff] --- --- --- --- --- --- 7,702
(0,173)
B13[Lack of staff awareness] --- --- --- --- --- --- (0,223) 6,962
B14 [Limited knowledge of the owner/manager] --- --- --- --- --- --- (0,192) 7,403
B15 [Conflicts of interest within the company] --- --- --- --- --- --- (0,597) 3,674
22
6.3 Driving forces for energy efficiency
Another issue addressed in this study was related to the driving forces that could overcome barriers to the implementation of energy efficiency measures. The major driving force identified by the respondents were cost reductions resulting from lower energy use followed by an increasing in energy prices, as shown in Fig. 4. These results are similar to the results obtained by Thollander and Ottosson (2008) in the Swedish paper and pulp industry.
Fig. 4 – Relative importance of drivers to energy efficiency (score 1 is ‗unimportant‘, score 4 is ‗very important‘).
Third party financing and ESCO‘s responsible for operation and maintenance of the buildings are instruments for change according to the European energy end-use efficiency and energy services directive (European Commision, 2006a) but was the lowest ranked driving forces, among all the factors investigated in this study. Another study by the energy intensive Swedish foundry industry (Rohdin et al., 2007) and Swedish paper and pulp industry (Thollander and Ottosson, 2008) also found that third party financing was ranked low, indicating that this driving force may be of insignificant importance for energy intensive industries.
0 1 2 3 4
ESCO's Information Campaigns Green image of the corporation Beneficial loans Environmental Management System Publicly financed energy audits Legal requirements Manager/owner personal commitment Investments subsidies for more efficient
technologies
Fiscal arrangements Increase in energy prices Cost reductions resulting from lower energy
23 With respect to potential energy policies, the main drivers identified by the respondents were fiscal arrangements and investment subsidies for more efficient technologies. de Groot et al. (2001) also identified fiscal arrangements as a major important driver among Dutch firms.
Finally, in order to analyze the relation between barriers to energy efficiency and the driving forces that could overcome those barriers, we calculated the Spearman Rank Correlation Coefficient. The results are presented in Table 7 from where we can extract some interesting results. Driving forces such as fiscal arrangements, investment subsidies for more efficient technologies, beneficial loans and an increase in energy prices, are seen as driving forces to bridge the main important barrier found in this study – lack of capital. In this way future energy policy could improve energy efficiency in industry by providing subsidies or favorable tax treatment for efficiency improvements. Another important barrier identified in this study was that firms have other priorities for their investments, but based on these results, a reduction of the production costs due to the adoption of energy efficiency measures could lead companies to invest in more energy efficient technologies.
Despite the fact that in this study, information campaigns are considered as a driving force of minor importance, it is interesting to see that this driving force is statistically significant correlated with 9 of the 15 barriers presented. This result suggests that it could be important to address information campaigns regarding energy efficiency opportunities. Moreover, since perceived knowledge varies between sectors, these information campaigns should face industries as subgroups with different needs.
Finally, the imposition of legal requirements concerning energy efficiency and also the adoption of an Environmental Management System are correlated with organizational barriers like energy objectives not integrated in company‘s procedures, lack of skilled staff and lack of staff awareness.
24
Table 7 –Barriers and Driving forces: Spearman rank correlation coeffcient
Notes: ** and * denote significance at the 1% and 5% level, respectively.
B1 B2 B3 B4 B5 B6 B7 B8 B9 B10 B11 B12 B13 B14 B15
[Fiscal arrangements] 0,167 -0,012 0,141 0,372** 0,152 -0,004 -0,021 0,117 0,326** 0,196 -0,005 -0,039 -0,008 0,107 -0,027 [Cost reduction resulting from
lower energy use] 0,294* -0,046 0,045 0,23 0,117 0,323** 0,206 0,16 0,109 0,018 0,027 0,059 0,011 0,093 -0,126
[Increase in energy prices] 0,135 0,047 0,175 0,419** -0,03 0,208 0,044 0,184 0,077 0,025 -0,011 0,113 -0,012 0,117 -0,053
[Investment subsidies for more
effcient technologies] 0,049 0,122 0,258* 0,324** 0,19 0,143 -0,055 0,104 0,228 0,204 0,117 0,207 0,104 0,175 0,071
[Publicly financed energy audits] 0,037 0,058 0,178 0,107 0,183 -0,074 0,092 0,121 0,037 0,255* 0,185 0,132 0,245* 0,037 -0,051
[Beneficial loans ] 0,045 -0,046 0,222 0,328** 0,053 -0,023 0,044 0,142 0,063 0,083 0,036 ,260* 0,236 0,087 0,16
[ESCO’s] 0,314* 0,055 0,144 0,223 0,191 0,063 0,165 0,195 0,058 0,136 0,077 0,136 0,192 0,087 0,068
[Green image of the corporation] 0,171 0,05 0,191 0,093 0,122 -0,045 0,121 0,159 0,129 0,319** 0,174 0,208 0,206 0,087 0,119
[Legal requirements] 0,062 -0,09 0,042 0,034 0,09 0,17 0,259* 0,351** 0,229 0,273* 0,332** 0,245* 0,290* 0,152 0,128 [Environmental Management System] 0,133 -0,058 0,233 0,142 0,143 0,028 0,11 0,257* 0,114 0,202 0,208 0,273* 0,257* 0,088 0,123 [Information Campaigns] 0,145 0,133 0,351** 0,215 0,334** -0,017 0,193 0,295* 0,14 0,298* 0,277* 0,406** 0,419** 0,382** 0,286* [Manager/owner personal commitment] 0,127 -0,101 0,167 0,258* 0,177 -0,152 0,03 0,014 0,049 0,091 -0,033 0,117 0,157 0,128 0,162
25
7. Conclusions
The energy efficiency topic is becoming crucial for the competitiveness of firms and is getting more importance also for SMEs that are usually less efficient than LEs. In order to develop efficient and environmental policies that lead to the increase of the overall industrial energy efficiency it is of fundamental importance to identify and evaluate the barriers to the adoption of energy efficiency measures.
This study presented and interpreted the results of a survey among Portuguese industrial firms and provided evidence that there is an energy efficiency gap in the Portuguese industry.
In particular, from the firms perceived knowledge perspective, we have seen some differences among sectors. Chemical and Paper industry seem to be more aware on energy saving measures than the other sectors analyzed in this study.
Concerning barriers to energy efficiency, access to capital and the existence of other, more attractive, investment opportunities seem to be the most relevant theoretical barriers. We cannot conclude that barriers to energy efficiency vary over sectors, since we only found statistical evidence for two of the fifteen barriers, which vary over sectors.
The economic potential for cost saving is the most important driving force for the adoption of energy saving measures. Future public policy should consider fiscal incentives, investment subsidies and beneficial loans, to increase the adoption of energy saving measures by the industrial SMEs. Also information campaigns on energy saving opportunities should be addressed considering sectors and firm specific factors. Moreover, managers must stop regarding energy measures as non strategic and give it higher priority when addressing their investments, because energy efficiency investments could represent an opportunity to reduce costs of the industrial firms. However, before proper decisions to be made, managers should gather all the information available and investment in human capital may be needed.
As a further research, it seems of fundamental importance to enhance the sample of analysis, in order to give more statistical importance to the conclusions drawn in this study. Furthermore, more detailed studies of the barriers should be carried out in each specific sector, in order to identify the critical barriers and suggest potential instruments to increase energy efficiency in energy intensive industries. Also, similar studies should be carried out in non energy intensive sectors like the commerce and services sector.
26
References
Anderson, S., Newell, R. (2004). Information programs for technology adoption: the case of energy-efficiency audits. Resource and Energy Economics, 26(1), 27-50.
Brown, M. (2001). Market failures and barriers as a basis for clean energy policies. Energy Policy, 29(14), 1197-1207.
Cagno, E., Trucco, A., Trianni, A., Sala, G. (2010). Quick-E-scan: a methodology for the energy scan of SMEs, Energy, 35(5),1916-1926
Coase, R. (1991). The nature of the firm - Origins, Evolution, and Development, In: Williamson, O.E., Winter, S. (Eds.), Oxford Univ. Press, New York.
DeCanio, S. (1993). Barriers within firms to energy-efficient investments. Energy Policy, 21(9), 906-15.
DeCanio, S., (1994), Agency and control problems in US corporations: The case of energy efficient investment projects. Journal of the Economics of Business, 1(1), 105–123.
DeCanio S., Watkins W. (1998). Investment in energy efficiency: do the characteristics of the firms matter? The Review of Economics and Statistics, 80(1), 95-107.
del Rio Gonzalez, P. (2005). Analysing the factors influencing clean technology adoption: a study of the Spanish pulp and paper industry. Business Strategy and the Environment, 14(1), 20–37.
de Groot, H., Verhoef, E., Nijkamp, P. (2001). Energy saving by firms: Decision making, barriers and policies. Energy Economics, 23(6), 717–740.
DGEG (Directorate General for Energy and Geology) (2009). Final Energy Consumption by energy source and sector activity in Portugal.
DGEG (Directorate General for Energy and Geology) (2010). Portuguese Energy Balance - 2008.
European Commission, (2006a). Directive 2006/32/EC of the European Parliament and of the Council of 5 April 2006 on energy end-use efficiency and energy services and repealing Council Directive 93/76/ EEC, Brussels.
27 European Commission (2006b). Action Plan for Energy Efficiency: Realising the Potential, Brussels, COM(2006) 545 final.
European Commission (2011). Energy Efficiency Plan 2011, Brussels, Com(2011) 109 final.
Farla, J., Blok, K. (1995). Energy conservation investment behaviour of firms: Business as Usual? (Paper presented at the 1995 European Council for an Energy Efficient Economy (ECEEE) summer study on energy efficiency in industry)
Fleiter T., Worrell E., Eichhammer W. (2011). Barriers to energy efficiency in industrial bottom-up energy demand models – A review. Renewable and Sustainable Energy Reviews, 15(6), 3099-3111.
Harris J., Anderson J., Shafron W. (2000). Investment in energy efficiency: a survey of Australian firms. Energy Policy, 28(12), 867-876.
Hassett, K., Metcalf, G. (1993). Energy conservation investment: do consumers discount the future correctly?, Energy Policy, 21(6), 710–716.
Hirst, E., Brown, M. (1990). Closing the efficiency gap: barriers to the efficient use of energy, Resources, Conservation and Recycling, 3(4), 267-281.
Howarth, R., Sanstad, A. (1995). Discount rates and energy efficiency, Contemporary Economic Policy, 13(3), 101–109.
ISSMEI (Institute of Support for Small and Medium Sized Enterprises and Innovation) (2008). About the SMEs in Portugal.
IEA (International Energy Agency) (2008). Energy Technology Perspectives – Scenarios and Strategies to 2050. OECD/IEA, Paris.
IEA (International Energy Agency) (2009). Energy Technology Transitions for Industry –Strategies for the next industrial revolution. OECD/IEA, Paris.
Jaffe A, Stavins R. (1994). The energy efficiency gap. What does it mean? Energy Policy, 22(10), 804- 810.
Jollands N., Waide P., Ellis M., Onoda T., Laustsen J., Tanaka K., de T‘Serclaes P., Barnsley I., Bradley R., Meier A. (2011). The 25 IEA energy efficiency policy recommendations to the G8 Gleneagles Plan of Action, Energy Policy, 38(11), 6409 – 6418.
28 Luna J., Ayerbe C., Toores, P. (2007). What prevents firms from advancing in their environmental strategy? International Advances in Economic Research, 13(1), 35 -46.
Masurel, E. (2007). Why SMEs Invest in Environmental Measures: Sustainability Evidence from Small and Medium-Sized Printing Firms. Business Strategy and the Environment, 16(3), 190–201.
Önüt S., Soner S. (2007). Analysis of energy use and efficiency in Turkish manufacturing sector SMEs, Energy Conversion and Management, 48(2), 384-394.
Painuly J., Reddy B. (1996). Electricity Conservation Programs: Barriers to Their Implementation, Energy Sources, 18(3), 257 – 267.
Ramesohl, S., Clases, C., Prose, F. (1997). Duplicating the success —From positive examples to socio-economic marketing strategies for greater energy efficiency in industry, Proceedings of the European Council for an Energy Efficient Economy (ECEEE) Summer Study, 9–14 June, Spindleruv Ml"yn, Czechia, Panel 3—ID 9, pp. 1–12.
Rohdin P., Thollander P. (2006). Barriers to and Driving Forces for Energy Efficiency in the Non-Energy Intensive Manufacturing Industry in Sweden, Non-Energy, 31(12), 1836-1844.
Rohdin P., Thollander P., Solding P. (2007). Barriers to and drivers for energy efficiency in the Swedish foundry industry. Energy Policy, 35(1), 672-677.
Sandberg P., Söderström M. (2003). Industrial energy efficiency: the need for investment decision support from a manager perspective. Energy Policy, 31(15), 1623-1634.
Sardianou E. (2008). Barriers to industrial energy efficiency investments in Greece, Journal of Cleaner Production, 16(13), 1416-1423.
Sathaie, J., Bouille, D. (2003). Barriers, Opportunities, and Market Potential of Technologies and Practices. IPCC Third Assessment Report – Climate Change 2001 – Mitigation Intergovernmental Panel on Climate Change, 347 – 391.
Schleich J. (2007). The economics of energy efficiency: barriers to profitable investments, EIB Papers, 12(2), 82-109.
29 Schleich J., Gruber E. (2008). Beyond case studies: Barriers to energy efficiency in commerce and the services sector. Energy Economics, 30(2), 449-464.
Schleich J. (2009). Barriers to energy efficiency: A comparison across the German commercial and services sector, Ecological Economics, 68(7), 2150-2159.
Simon, H. (1959). Theories of decision-making in economics and behavioural science. The American Economic Review, 49, 253-283.
Sorrell, S., Schleich, J., Scott, S., O‘Malley, E., Trace, F., Boede, E., Ostertag, K. Radgen, P. (2000). Reducing Barriers to Energy Efficiency in Public and Private Organizations, SPRU (Science and Technology Policy Research), Brighton, United Kingdom.
Sorrell, S., O‘Malley E., Schleich J., Scott S. (2004), The Economics of Energy Efficiency – Barriers to cost-effective investment, Edward Elgar Publishing, Cheltenham, United Kingdom
Stern P., Aronson E. (1984). Energy use: the human dimension, Freeman, New York.
Thollander P., Ottosson M. (2008). An energy efficient Swedish pulp and paper industry – exploring barriers to and driving forces for cost-effective energy efficiency investments, Energy Efficiency, 1(1), 21-34.
Unión Fenosa (2010), Energy efficiency índex in the Portuguese SMEs and residential homes – National Results 2009.
van Soest, D., Bulte, E. (2001). Does the energy-efficiency paradox exist? Technological progress and uncertainty. Environmental and Resource Economics, Volume 18(1), 101–112.
Velthuijsen J. (1995). Determinants of investments in energy conservation. Doctoral Thesis. Groningen: Rijksuniversiteit, The Netherlands,
Weber L. (1997). Some reflections on barriers to the efficient use of Energy, Energy Policy, 25(10), 833-835.
Worrell E., Bernstein L., Roy J. Price L., Harnisch J. (2009). Industrial energy efficiency and climate change mitigation, Energy Efficiency, 2(2), 109-123.
Zilahy G. (2004). Organisational factors determining the implementation of cleaner production measures in the corporate sector, Journal of Cleaner Production, 12(4), 311-319.