17. ARE MALES SPECIMENS MORE ADEQUATE
TO DETECT ANTROPOGENIC IMPACTS?
Chapter Objectives
To demonstrate sex effects on different aquatic
species condition and its susceptibility to
anthropogenic impacts.
Field sampling (photo Ecoreach)
EH principle: 1 – use of biota as impact indicators
INTRODUCTION
Estimates of the condition of aquatic organisms can be used to monitor the health or recovery of aquatic areas, under the ecohydrologic approach (Zalewski 2000, Chicharo et al. 2001). The ability of aquatic
organisms to cope with environmental stress may be expensive in terms of energy and this cost of tolerance have negative counterparts in growth, reproduction, recruitment, susceptibility to disease, predation and physical disturbance
(Jackson et al. 2002, Lloret et al. 2003,
Oliva-Paterna et al. 2003). Density-dependent factors
such competition and aggression can influence fitness, growth, reproduction, and survival (Hensor et al. 2005, Leitão 2006). Indices of the
condition of organisms are valuable for managers of aquatic ecosystems for assessment of the health status of populations (Brown, Austin 1996).
ELABORATING OF THE EXPERIMENT 1. General description
The relationship between the condition of adults during the months prior to spawning and the number of recruits in the following year was been significant and positive for some aquatic species (Carbonell et al. in press). This relationship was stronger when only male condition was considered, suggesting that males must be considered differently (Carbonell et al. in press). Also Chicharo et al. (2007) showed that the males of three different marine species are more susceptive to environmental changes.
Nevertheless, there is a paucity of data on the effects of sex on growth, energetics, and condition of aquatic organisms. Several studies of the growth rates and conditions of aquatic organisms assumed no differences between
males and females in the condition based on morphometric (Gerritsen, McGrath 2007) and on biochemical content of muscle tissue or of the whole organism eg.:Regnault and Luquet (1974), Paon and Kenchington (1995), Chícharo et al. (2003), and Norkko et al. (2005).
There are several methods to determine aquatic organisms condition, some of the most generalized are: the morphometric condition index (Nash et al. 2007), an indicator of the
general well-being, this index assumes that heavier organism for a given length are in better condition, and the RNA/DNA ratio, this index is based on the assumption that the amount of deoxyribonucleic acid DNA, the primary carrier of genetic information, is stable under changing environmental situations, whereas the amount of ribosomal ribonucleic acid RNA is directly involved in protein synthesis, is affected by environmental changes (Bulow 1970).
The aim of this work is to quantify differences between male and female condition of fish and aquatic invertebrate’s species, using biometric biochemical analysis.
2. Experimental design
It should be selected species with different habitats and feeding habits to negate the confounding effect of physiological, morphometric, and behavioural changes on differences in condition indices, between males and females. It can be suggested species with wide distribution such as gobiid fishes (eg
Pomatoschistus spp), crustaceans (eg Crangon spp., Carcinus maenas), and bivalves (eg Cardium spp)
The alive adult organisms can be sampled (eg fish and shrimp, in rocky or mud ponds) or buy in local market (eg bivalves). All the specimens should be submitting to cumulative stress
92 conditions in aquaria during 3-4 days, eg hypoxia
or starvation. Organisms will be frozen or preferably placed in liquid nitrogen immediately after collection.
a) Laboratory analysis
Fish, shrimp and bivalve specimens will observed, after defrost, using a dissecting microscope sex identified, total length measure, wet and dry weight determined. For all organisms macro structure maturation staged should be registered.
Condition factor will be determined based on formula K = W/L3, where W is the body mass (mg) and L is the standard length (mm).
RNA and DNA contents can be analyzed according to fluorometric methods described by
Esteves et al. (2000). Nucleic acids are extracted from a portion of 200 µg tissue in white muscle samples by adding 150 µl of 1% sarcosine and crushing the samples in ice (Figure 1).
After shaking and centrifugating, the samples are diluted to a final concentration of 0.1% using ice-cold Tris buffer. Fluorescence are measured photometrically using ethidium bromide. The amount of fluorescence originating from RNA (mainly ribosomal RNA) are calculated as the difference between total fluorescence (RNA and DNA) and fluorescence after ribonuclease A (type II-A) treatment, which are assumed to be derived from DNA. Fluorescence are determined by excitation at 365 nm and detection at 590 nm using spectrofluorometer (Photo 1). Sample concentrations of nucleic acids will determined from standard curves constructed daily using lambda DNA and ribosomal RNA of known concentration and of the appropriate range.
Photo 1. Fluorescence determination with use of
spectrofluorometer.
Figure 1. Flow-chart of sarcosine extraction
procedure and quantification methodology of nucleic acids described by Esteves et al. (2000).
Sediment (otoliths + protein)
Supernatant for further analyses Centrifuge 5 min. at 4930 rpm
Shake 1.35 ml Tris-EDTA buffer 15 min. at room temperature
Vortex vigorously, 2 min. 15 min. at room temperature
Vortex, 2 min. 0.15 ml 1% sarosine Larva (> 200 ug dry weight)
0.4 ml Tris-Base + 0.05 ml EB (DNA+RNA) 0.2 ml allow to cool + 0.05 ml EB > 15 min. at room temperature Incubation at 37ºC for 30 min. 0.35 ml Tris-Base + 0.05 ml RNase (RNA) 0.2 ml Supernatant
3. Materials and equipment
a) Field collection
You will need materials and equipment to collect water, fish, shrimps and bivalves:
• Baskets and containers for water collection and transport to the lab;
• Small hand-dredge for bivalve, crustacean and fish sampling in ponds;
• Clothing: water proof boots to walk on the margins, water proof jacket.
b) Laboratory experiments • Calliper;
• Dissecting microscope and microscope; • Owen and muffle for determination of organisms AFDW (ash free dry weight); • Fluorometer; • Centrifuge; • Water bath; • Automatic pipettes. c) Data analysis • Computer;
• Data sheet organizer.
4. Organizing the data
Basic statistical analysis
It will be necessary for morphometric condition index to organize the data according to the example in Table 1.
Table 1. Morphometric index determined in Carcinus maenas
Wet weigth (mg) Total length (mm) Sex Weigth/Length3
2120 16,72 Female 0,45 3580 19,37 Female 0,49 4050 19,48 Female 0,55 4510 20,84 Female 0,50 5780 22,38 Female 0,52 6050 24,93 Female 0,39 6570 23,52 Female 0,50 6880 23,97 Female 0,50 7350 25,72 Female 0,43 3630 19,86 Male 0,46 3650 19,87 Male 0,47 6020 23,63 Male 0,46 8700 26,27 Male 0,48 10450 29,4 Male 0,41 11990 28,36 Male 0,53 13600 31,03 Male 0,46 17700 31,72 Male 0,55
It will be necessary to perform a regression analysis between fluorescence units and acids nucleic concentrations (see Figure 2).
RNA calibration y = 300,58x + 683,45 R2 = 0,9882 0 500 1000 1500 2000 0,00 1,00 2,00 3,00 4,00 5,00 ug/ul Fl u DNA calibration y = 991,54x + 703,8 R2 = 0,9843 0 500 1000 1500 2000 0,00 0,20 0,40 0,60 0,80 1,00 1,20 ug/m l Fl u
Figure 2. Relationship between standard nucleic
acids concentration and relative fluorescence readings.
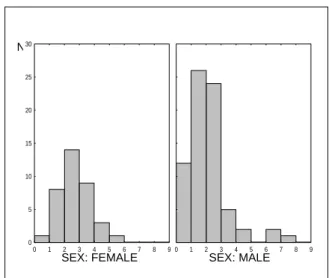
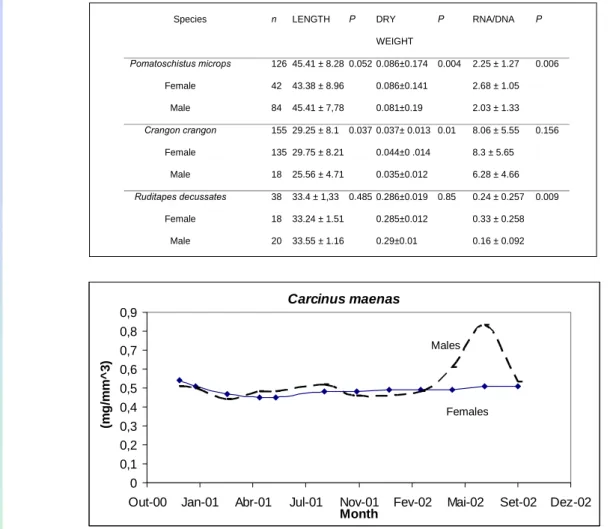
To analyse sex differences in condition indices it will be necessary to perform T- student test (p<0,05), see examples of results in Table 2 and Figure 3 and Figure 4.
Figure 3. Results of RNA/DNA ratios between males and females goby fish (Chicharo et al. 2007).
N
SEX: FEMALE SEX: MALE
0 5 10 15 20 25 30 0 1 2 3 4 5 6 7 8 9 0 1 2 3 4 5 6 7 8 9
94 Table 2. Total length (mm), Dry weight( g) (for bivalves only meat weight and nucleic acid index of three
species (mean ± standard deviation) and P values for differences between males and females of each species (P ♂♀) (Chicharo et al. 2007).
Carcinus maenas 0 0,1 0,2 0,3 0,4 0,5 0,6 0,7 0,8 0,9
Out-00 Jan-01 Abr-01 Jul-01 Nov-01 Fev-02 Mai-02 Set-02 Dez-02 Month (m g/ m m ^ 3 ) Males Females
Figure 4. Carcinus maenas variation of morphometric condition index between genders along different
seasons.
6. Analysing the results
To analyse the results try to have in consideration that your data may have been caused by sexual dimorphism, physiological or biochemical differences between sexes, or behavioral differences between sexes. Try to give especially attention to the investment of reproduction between the sexes of species analysed (Brokordt et al. 2003).
During the analysis try to answer to the following questions:
1. Which index is more sensitive to
anthropogenic impact?
2. How did these ratios vary with the sex of the organism in different species?
3. Are males specimens more adequate to
detected anthropogenic impacts?
4. If the frequencies of genders in samples are not representative of those in the population, what can happen to the analysis of population condition, eg. if females are over-represented?
Species n LENGTH P DRY
WEIGHT P RNA/DNA P Pomatoschistus microps 126 45.41 ± 8.28 0.052 0.086±0.174 0.004 2.25 ± 1.27 0.006 Female 42 43.38 ± 8.96 0.086±0.141 2.68 ± 1.05 Male 84 45.41 ± 7,78 0.081±0.19 2.03 ± 1.33 Crangon crangon 155 29.25 ± 8.1 0.037 0.037± 0.013 0.01 8.06 ± 5.55 0.156 Female 135 29.75 ± 8.21 0.044±0 .014 8.3 ± 5.65 Male 18 25.56 ± 4.71 0.035±0.012 6.28 ± 4.66 Ruditapes decussates 38 33.4 ± 1,33 0.485 0.286±0.019 0.85 0.24 ± 0.257 0.009 Female 18 33.24 ± 1.51 0.285±0.012 0.33 ± 0.258 Male 20 33.55 ± 1.16 0.29±0.01 0.16 ± 0.092
7. Discussion
Discuss the obtained results with literature concerning the topic.
REFERENCES
1. Brokordt K.B., Guderley H.E., Guay M., Gaymer C.F., Himmelman J.H. 2003. Sex differences in reproductive investment: maternal care reduces escape response capacity in the whelk Buccinum undatum.
Journal of Experimental Marine Biology and Ecology 291:161–180.
2. Brown M.L., Austin D.J. 1996. Data management and statistical techniques. In:
B.R. Murphy, D.W. Willis (eds). Fisheries Techniques. American Fisheries Society, Bethesda, Maryland. 17–61 pp.
3. Bulow F.J. 1970. RNA–DNA ratios as indicators of recent growth rates of a fish. Journal of The Fisheries Research Board of Canada 27:2343–2349.
4. Carbonell A., Lloret J. Demestre M. (in press). Relationship between condition and recruitment success of red shrimp (Aristeus
antennatus) in the Balearic Sea (Northwestern
Mediterranean). Journal of Marine Systems 0:000-000.
5. Chícharo M. A., Chícharo L., Galvão H., Barbosa A., Marques M. H., Andrade J. P., Esteves E., Miguel C., Gouveia C., Rocha C. 2001. Status of the Guadiana estuary (South Portugal) during 1996-1998: an ecohydro-logical approach. Aquatic Ecosystem Health and Management 4:73-90.
6. Chícharo M. A., Chícharo L., Morais P. 2007. Sex effect on ratios and concentrations of DNA and RNA three in marine organisms. Marine Ecology Progress Series 332:241-245. 7. Chícharo M.A., Chícharo L., Amaral A.,
Condinho S., Gaspar M. 2003. Chronic effects of dredging-induced stress on the clam (Spisula solida): nucleic acid and lipid composition. Fisheries Research 63:447–452. 8. Esteves E., Chícharo M.A., Pina T., Coelho
M.L., Andrade J.P. 2000. Comparison of RNA/DNA ratios obtained with two methods for nucleic acid quantification in gobiid larvae. Journal of Experimental Marine Biology and Ecology 245:43–55.
9. Gerritsen H.D., McGrath D. 2007. Significant differences in the length–weight relationships of neighbouring stocks can result in biased biomass estimates: Examples of haddock
(Melanogrammus aeglefinus, L.) and whiting (Merlangius merlangus, L.). Fisheries Research 85(1-2):106-111.
10. Hensor E., Couzin I.D., James R., Krause J. 2005. Modelling density-dependent fish shoal distributions in the laboratory and field. Oikos 110:344–352.
11. Jackson A.C., Rundle S.D., Attrill M.J. 2002. Fitness consequences of prey depletion for the common goby Pomatoschistus microps. Mar Ecol Progress Series 242:229–235. 12. Leitão R., Martinho F., Neto J.M., Cabral H.,
Marques J., Pardal M.A. 2006. Feeding ecology, population structure and distribution of Pomatoschistus microps (Krøyer, 1838) and Pomatoschistus minutus (Pallas, 1770) in a temperate estuary, Portugal. Estuarine Coastal Shelfish Science 66:231–239. 13. Lloret J., Planes S. 2003. Condition, feeding
and reproductive potential of white seabream Diplodus sargus as indicators of habitat quality and the effect of reserve protection in the northwestern Mediterranean. Marine Ecology Progress Series 248:197–208.
14. Nash R. D. M., Valencia A.H., Geffen A.J. 2006. Essay: Fisheries History. The Origin of Fulton’s Condition Factor - Setting the Record Straight. Fisheries 31(5):236-238. 15. Norkko J., Pilditch C.A., Thrush S.F., Wells
R.M.G. 2005. Effects of food availability hypoxia on bivalves: the value of using multiple parameters to measure bivalve condition in environmental studies. Marine Ecology Progress Series 298:205–218. 16. Oliva-Paterna F.J., Vila-Gisbert A., Torralva
M. 2003. Condition of Barbus sclateri from semiarid aquatic systems: effects of habitat quality disturbances. Journal of Fish Biology 63:1–11.
17. Paon L.A., Kenchington E.L.R. 1995. Changes in somatic and reproductive tissues during artificial conditioning of the sea scallop, Placopecten magellanicus (Gmelin,
1791). Journal of Shellfish Research 14:53– 58.
18. Regnault M., Luquet P. 1974. Study by evolution of nucleic acid content of prepubertal growth in the shrimp Crangon
vulgaris. Marine Biology 25:291–298.
19. Zalewski M. 2000. Ecohydrology-the scientific background to use ecosystem properties as management tools toward sustainability of water resources. Guest Editorial in Ecological Engineering 16:1-8.