HOLOS, Ano 36, v.1, e8858, 2020 1
CORRELAÇÃO CANÔNICA ENTRE PARÂMETROS DE QUALIDADE DA ÁGUA DO RIO
LOCALIZADO NO SUL DO RIO GRANDE DO SUL
L. N. CENTENO1, S. T. CECCONELLO2, N. B. DA SILVEIRA3 e R. V. MAZZARO4 Universidade Federal de Pelotas
Submetido 02/08/2019 - Aceito 11/12/2020 DOI: 10.15628/holos.2020.8858
RESUMO
Objetivou utilizar a análise de correlação canônica para verificar as associações existentes entre os parâmetros de qualidade da água do período primavera/verão com os estabelecidos no período outono/inverno, variáveis estas pertencentes ao Rio Tramandaí/RS. Para isto foram utilizados dados secundários de qualidade da água disponibilizados pela Fundação Estadual de Proteção Ambiental Henrique Luís Roessle, no período de 2005-1 a 2013-2. Foi aplicada a análise de correlação canônica, considerando os dados originais observados, onde foram estimadas as cargas canônicas. Ademais utilizou-se o teste multivariado de significância Lambda de Wilks, para avaliar a significância das raízes canônicas conjuntamente. Por fim, determinou-se o índice de redundância como sendo a carga canônica quadrada média vezes o R² canônico. Observou-se por meio da
técnica aplicada que somente a primeira função canônica, mostrou-se significativa. Com relação as cargas canônicas, da função: dos parâmetros de qualidade da água relacionados ao período primavera/verão os parâmetros Coliformes Totais (CT) e o Nitrogênio Total (NT) apresentaram valores mais elevados. Porquanto para os parâmetros pertencentes ao outono/inverno os CT. apresentaram cargas canônicas baixas. A quantidade de variância compartilhada explicada pela variável estatística canônica dependente foi, em média de, 9,5%. Observa-se que os CT apresentaram o maior percentual de variância explicada pela variável estatística canônica dependente, ou seja, 0,874. Estes resultados demonstram a possibilidade de utilização dessa técnica multivariada para realizar inferências a respeito da qualidade.
PALAVRAS-CHAVE: Monitoramento Ambiental, Software R e Qualidade da Àgua.
CANONIC CORRELATION BETWEEN QUALITY PARAMETERS OF RIVER WATER
LOCATED IN THE SOUTH OF RIO GRANDE DO SUL
ABSTRACT
The objective of this work was to evaluate the associations between water quality parameters in the spring/summer period and those established in the autumn/winter period, variables belonging to the Rio Tramandaí/RS. To this end, water quality secondary data provided by the State Environmental Protection Foundation Henrique Luis Roessle were used in the period from 2005-1 to 2013-2. The analysis of canonical correlation was applied, considering the original data observed, where canonical charges were estimated. In addition, Wilks' multivariate significance test was used to evaluate the significance of the canonical roots together. Finally, the redundancy index was determined as the mean square canonical charge times the canonical R². It was observed through the applied technique that only
the first canonical function was shown to be significant. In relation to the canonical loads, of the function: Of the parameters of quality of the water related to the spring/summer period, the parameters Total Coliforms (TC) and the Total Nitrogen (TN) presented higher values. Because for the parameters belonging to autumn/winter the TC presented low canonical charges. The amount of shared variance explained by the dependent canonical statistical variable was, on average, 9.5%. It is observed that the TC had the highest percentage of variance explained by the dependent canonical statistical variable, that is, 0.874. These results demonstrate the possibility of using this multivariate technique to make inferences about quality.
HOLOS, Ano 36, v.1, e8858, 2020 2
1 INTRODUÇÃO
The liminological water characteristics are strongly influenced by the anthropic activities, and thus deserve special attention when referring to the water quality for public supply (BODRUD-DOZA et al., 2016; BORA; GOSWAMI, 2016; BROWN; MCCLELLAND; DEININGER, 1970; HELLER; PÁDUA, 2010;).
In the rural area, agricultural activities cause the water bodies enrichment, when the management of the soil is carried out without proper care, as it favors the leaching of chemical fertilizers (BHUTIANI et al., 2014; MUANGTHONG; SHRESTHA, 2015; NAZIR et al., 2016). Through the nitrogen and phosphorus present in them; may also cause water salinization due to inadequate irrigation techniques and contamination due to thermotolerant coliforms present mainly in feces of warm-blooded animals and due to organic fertilization without due treatment (HASSEN; AMZAOUI-AZAZA; BOUHLILA, 2016; HELLER; PÁDUA, 2010; SPERLING, 2014).
Consequently, in urban areas, the main activities that cause water pollution sources are those resulting from urbanization processes, with the main sources being domestic and industrial effluents as well as solid waste, when they are disposed in the water bodies without the due treatments (SPERLING, 2005; TAVARES, 2014).
In addition to these factors, the seasons of the year also interfere in the water quality of the springs, because when related to hot seasons according to Sperling (2005), the temperature and dissolved oxygen content, for example, the latter tends to decrease by heating.
Another important factor are precipitations, since this is the main regulating agent of watercourses. In addition, the rainfall regime in Brazil presents marked seasonality with dry and rainy season at different times of the year according to geographic location.
In order to evaluate the water quality of a source and to identify the main anthropic activities and consequently the changes that occur in a water body, this way, it becomes necessary to research that establish the relations between the variables of water quality. (CENTENO, 2017; LIBÂNIO, 2010; MONICA; CHOI, 2015).
In view of the above, canonical correlation analysis can be used to determine the interrelationships between water quality parameters. Since this technique according to Hair et al. (2009), is a multivariate statistical procedure that allows to verify the existing linear correlations between two groups or sets of variables (X and Y). This analysis consists in obtaining a pair of latent variables, called canonical statistical variables, that are linear combinations of the variables of the two vectors (X and Y) and that the information contained in the parameters is concentrated in the correlation between these new variables (CORRAR, PAULO, DIAS FILHO, 2014; HAIR et al., 2009; VICINI, 2005;).
Where each pair of canonical statistical variables is called the canonical function (FERREIRA, 2010). In this technique of multivariate analysis, the maximum number of canonical functions that can be obtained is equal to the number of variables of the smallest set of data (LANDIM, 2011). In
HOLOS, Ano 36, v.1, e8858, 2020 3
summary, according to Mingoti et al. (2013), the canonical correlation simultaneously predicts multiple dependent variables, from multiple independent variables.
In view of the above, this work aimed to use the canonical correlation analysis to verify the associations between the water quality parameters of the spring/summer period with those established in the autumn/winter period, these variables belonging to Tramandaí River/RS.
2 METHODS AND MATERIALS
2.1 Caracterization of the study area
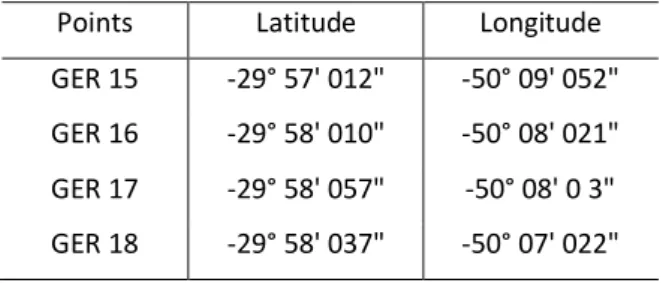
The study area (Figure 1) was the points GER 15, GER 16, GER 17 and GER 18, (geographical coordinates in Table 1) located in the Tramandaí River and inserted in the Tramandaí Basin within the Litorânea Basin Region (FEPAM, 2018).
Table 1: geodesic coordinates referring to the points of this study Points Latitude Longitude
GER 15 -29° 57' 012" -50° 09' 052" GER 16 -29° 58' 010" -50° 08' 021" GER 17 -29° 58' 057" -50° 08' 0 3" GER 18 -29° 58' 037" -50° 07' 022"
The Tramandaí River Basin (Figure 1) is located in the northeastern portion of Rio Grande do Sul, with an area of 3,144.84 km², which includes the municipalities of Capão da Canoa, Dom Pedro de Alcântara, Imbé, Maquiné, Osório, Torres, Tramandaí and Três Forquilhas. Since the main uses of water in this basin are for irrigation and public supply (SEMA, 2018; FEPAM, 2018).
HOLOS, Ano 36, v.1, e8858, 2020 4
Figure 1: Location map of the study area
2.2 Data compilation
The data used in this study were secondary, provided by FEPAM/RS, which monitors the water quality of the coastal region (FEPAM, 2018) every six months since 1992. Data from 2005 to 2013 were used, and two sample campaigns were carried out each year, so for this study, they were separated in spring summer and fall/winter. Regarding the choice of water quality parameters, it should be noted that it was carried out taking into account the lower percentage of sampling failures, due to the lack of data in certain periods.
The water quality parameters analyzed were: Biochemical Oxygen Demand (BOD5), Total
Coliforms (TC), Total Phosphorus (TP), Total Nitrogen (TN), Dissolved Oxygen (DO), Turbidity (TH), Hydrogenion Potential (HP), Water Temperature (TH2O) and Total Solids (TS).
Samples were collected by FEPAM (Fundação Estadual de Proteção Ambienta) according to the methodology described by Companhia Ambiental do Estado de São Paulo (CETESB, 1988). The
HOLOS, Ano 36, v.1, e8858, 2020 5
analytical methods, as well as the preservation of the samples, follow the procedures defined by APHA (1998).
2.3 Canonical correspondence analysis
The canonical correlation analysis was applied, considering the observed original data, to verify the associations between two groups of water quality parameters, the first one being related to spring/summer seasons and the second to autumn (fall)/winter.
In addition the first group represents the independent variables (X) and the second one the dependent ones (Y). In this way, it was possible to determine 9 canonical functions (9 pairs of canonical statistical variables). The canonical charges were estimated, that is, the correlations between the original variables and their respective canonical statistical variables and the crossed canonical charges that represent the correlation between an original variable of a given group and the canonical statistical variable of the other group.
The Wilks' multivariate Lambda significance test (F distribution approximation) was used to evaluate the significance of the canonical roots together. It should be noted that the amount of variance explained, that is, the percentage of variance in the dependent canonical statistical variable that can be explained by the independent canonical statistical variable, and vice versa, was determined by raising the canonical correlation to the square.
The amount of shared variance explained between the dependent and independent observed variables and their respective canonical statistical variables was determined by raising the canonical loads squarely. However, it is important to point out that the same was done for cross canonical charges with the purpose of estimating the shared variance explained between the dependent variable or the independent variable observed with the opposite canonical statistical variable.
The redundancy index was also determined as the mean square canonical charge times the canonical R². The redundancy index expresses the amount of variance in a canonical statistical variable (dependent or independent) explained by the other canonical statistical variable in the canonical function. In order to obtain a high index of redundancy, one must have a high canonical correlation and a high degree of shared variance explained by the canonical statistical variable. One should consider the redundancy index to overcome the bias and uncertainty inherent in the use of canonical roots (canonical correlations squared) as a measure of shared variance (BERTOSSI et al., 2013; HAIR et al., 2009; CORRAR, PAULO, DIAS FILHO, 2014).
The procedures used for the statistical analyzes were based on the work of several authors (FERREIRA, 2010; HAIR et al., 2009; MINGOTI, 2013; VICINI, 2005).
All analyzes were performed using statistical software R version 3.4.3 (R DEVELOPMENT CORE TEAM, 2018), CCA and CCP packages.
HOLOS, Ano 36, v.1, e8858, 2020 6
3 RESULTS AND DISCUSSION
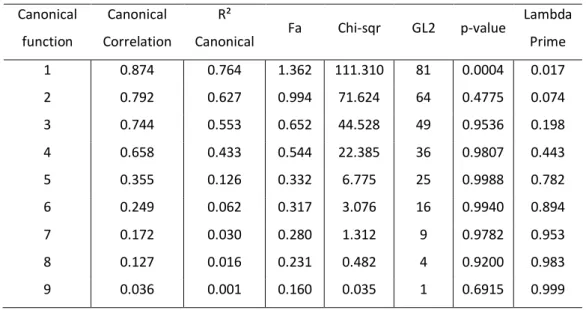
Correlations of canonical correspondences can be observed in Table 2, as well as the canonical R² and the significance test performed.
Table 2. Wilks lambda multivariate test (F distribution approximation) Canonical
function
Canonical Correlation
R²
Canonical Fa Chi-sqr GL2 p-value
Lambda Prime 1 0.874 0.764 1.362 111.310 81 0.0004 0.017 2 0.792 0.627 0.994 71.624 64 0.4775 0.074 3 0.744 0.553 0.652 44.528 49 0.9536 0.198 4 0.658 0.433 0.544 22.385 36 0.9807 0.443 5 0.355 0.126 0.332 6.775 25 0.9988 0.782 6 0.249 0.062 0.317 3.076 16 0.9940 0.894 7 0.172 0.030 0.280 1.312 9 0.9782 0.953 8 0.127 0.016 0.231 0.482 4 0.9200 0.983 9 0.036 0.001 0.160 0.035 1 0.6915 0.999
Fa: approximate F statistics; GL2: degrees of freedom regarding error.
Based on Table 2 it is possible to observe that only the first canonical function was significant. Considering that a significance level of 5% was adopted. Given that the amount of variance explained in the aforementioned function is 85.60% (observed through the square of the canonical correlation), this percentage being analyzed as a function of the canonical statistical variables independent and dependent on function 1. It should be noted that this is an indicative of the relation of similarity between the parameters related to spring/summer and autumn/winter.
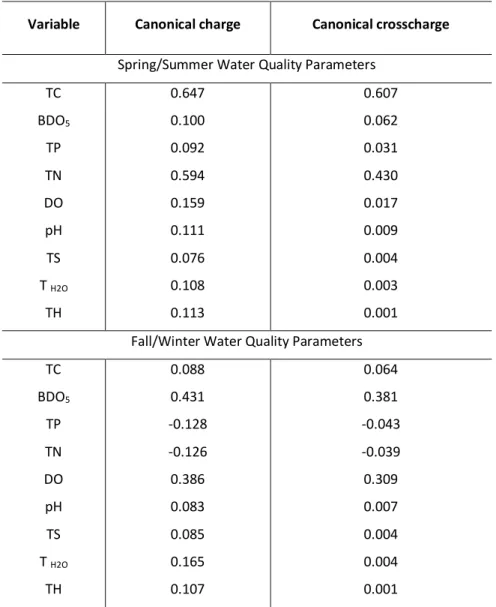
Table 3 shows the canonical charges and the cross-canonical charges for the canonical function 1. Given that according to Mingoti (2013), the higher the canonical load, the more important is the parameter to derive the canonical statistical variable.
HOLOS, Ano 36, v.1, e8858, 2020 7
Table 3: Canonical charges and canonical cross loads for the canonical function 1. Variable Canonical charge Canonical crosscharge
Spring/Summer Water Quality Parameters
TC 0.647 0.607 BDO5 0.100 0.062 TP 0.092 0.031 TN 0.594 0.430 DO 0.159 0.017 pH 0.111 0.009 TS 0.076 0.004 T H2O 0.108 0.003 TH 0.113 0.001
Fall/Winter Water Quality Parameters
TC 0.088 0.064 BDO5 0.431 0.381 TP -0.128 -0.043 TN -0.126 -0.039 DO 0.386 0.309 pH 0.083 0.007 TS 0.085 0.004 T H2O 0.165 0.004 TH 0.107 0.001
Observing (Table 3) the canonical loads of the water quality parameters related to the spring/ summer period, it is analyzed that the parameters CT, and NT presented higher values. Because for the parameters belonging to autumn/winter the TC presented low canonical loads.
For the group of parameters of water quality referring to autumn/winter, the BOD5 followed by OD in module, were the ones that presented the highest canonical loads, it is observed that when compared to the first group this one presented much lower canonical loads. This fact is possibly correlated with precipitation, since these occur more heavily in autumn/winter.
The results showed that CTs are positively correlated with all parameters in spring/summer. However, it should be noted that the relationships between CT with ST and ST, were not sufficiently explained by canonical correlation analysis due to the lower values observed for canonical PT and ST loads.
Therefore, in the autumn/winter it was observed that the CTs obtained a negative correlation with the NT and PT parameters. Possibly because they are used as nutrients for the
HOLOS, Ano 36, v.1, e8858, 2020 8
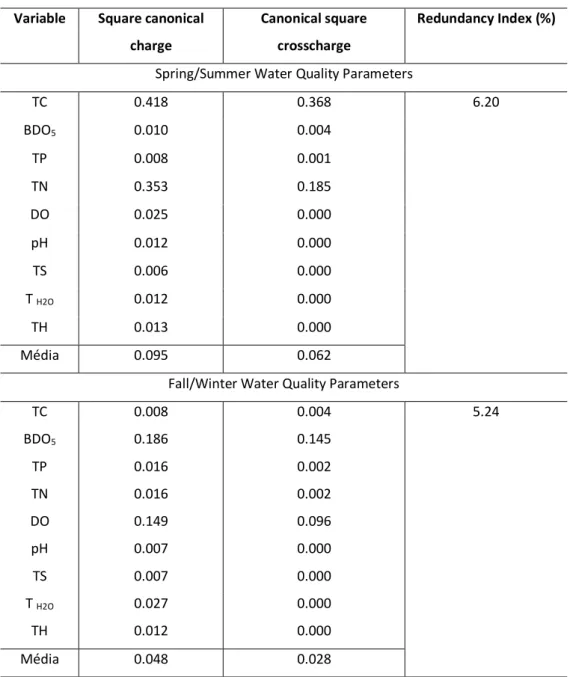
proliferation of microorganisms. Therefore, table 4 shows the calculation performed to obtain the redundancy index for the first canonical function.
Table 4: Calculation of the redundancy index for the first canonical function. Variable Square canonical
charge
Canonical square crosscharge
Redundancy Index (%)
Spring/Summer Water Quality Parameters
TC 0.418 0.368 6.20 BDO5 0.010 0.004 TP 0.008 0.001 TN 0.353 0.185 DO 0.025 0.000 pH 0.012 0.000 TS 0.006 0.000 T H2O 0.012 0.000 TH 0.013 0.000 Média 0.095 0.062
Fall/Winter Water Quality Parameters
TC 0.008 0.004 5.24 BDO5 0.186 0.145 TP 0.016 0.002 TN 0.016 0.002 DO 0.149 0.096 pH 0.007 0.000 TS 0.007 0.000 T H2O 0.027 0.000 TH 0.012 0.000 Média 0.048 0.028
The amount of shared variance explained by the dependent canonical statistical variable was, on average, 9.5%. It is observed that the TC had the highest percentage of variance explained by the dependent canonical statistical variable, that is, 0.874%. Thus, the CT in the spring/summer period can be considered the most relevant variable in the dependent canonical statistical variable. However, this result was already expected since it is related to domestic sewage and animal faces, which in sum increase its concentration in this period, since it is a period with lower occurrences of precipitation and higher temperatures.
HOLOS, Ano 36, v.1, e8858, 2020 9
Analyzing the independent canonical statistical variable, it can be observed that the concentration of BOD5 followed by the OD parameter presented the highest percentages of variance
explained by the canonical statistical variable. It is also noted that, on average, the amount of shared variance explained by the independent canonical statistical variable was 4.8%.
As to canonical cross-squares, it is observed that approximately 37% of the variance of CT in the spring / summer period can be explained by the independent canonical statistical variable, which confirm the relevance of this variable in the study. Something similar occurred with BOD5 being this one with 14.5% of the total variance.
It is important to note that as far as the acceptable minimum limit with respect to the redundancy index is concerned, no value was taken as base since in the evaluation of the canonical functions, the researcher must judge its theoretical and practical significance in the research carried out (HAIR et al., 2018, MINGOT, 2013).
In addition to the redundancy indexes found, only 6.20% of the variance in the dependent variables (parameters related to spring/summer) were explained by the independent canonical statistical variable (formed by the parameters of autumn/winter water quality). At the time, the dependent canonical variable explained 5.24% of the variance of the independent variables. This fact is explained by the low canonical charges found in the autumn/winter.
4 FINAL CONSIDERATIONS
The results obtained demonstrate the possibility of using this technique of multivariate analysis to make inferences about water quality parameters in the spring/summer period and its similarity with autumn/winter.
Acknowledgments
The present work is supported by the Coordination of Improvement of Higher Level Personnel (CAPES), State Foundation for Environmental Protection (FEPAM), Federal University of Pelotas (UFPel) and Post-Graduation Program in Water Resources (PPG Recursos Hídricos).
5 REFERENCES
AMERICAN PUBLIC HEALTH ASSOCIATION – APHA (1998). Standard methods for the examination of
water and wastewater. 20ª ed. Washington: American Public Health Association.
HOLOS, Ano 36, v.1, e8858, 2020 10
BERTOSSI, A. P. A. et al. (2013). Seleção e agrupamento de indicadores da qualidade de águas utilizando estatística multivariada. Semina: Ciências Agrárias, Londrina, v. 34, n. 5, p.2025-2036. Universidade Estadual de Londrina. http://dx.doi.org/10.5433/1679-0359
BHUTIANI, R. et al. (2014). Assessment of Ganga river ecosystem at Haridwar, Uttarakhand, India with reference to water quality indices. Applied Water Science, [s.l.], v. 6, n. 2, p.107-113, Springer Nature. http://dx.doi.org/10.1007/s13201-014-0206-6.
BODRUD-DOZA, M. D. et al. (2016). Characterization of groundwater quality using water evaluation indices, multivariate statistics and geostatistics in central Bangladesh. Water Science, [s.l.], v. 30, n. 1, p.19-40.
BORA, M.; GOSWAMI, D. C. (2016). Water quality assessment in terms of water quality index (WQI): case study of the Kolong River, Assam, India. Applied Water Science, [s.l.], v. 6, n. 1, p.1-11, Springer Nature. http://dx.doi.org/10.1007/s13201-016-0451-y.
BROWN, R. M.; MCCLELLAND, N. I.; DEININGER, RA; T., RG. (1970). A water quality index: do we dare? Water & Sewage Works, vol. 117, p. 339-343.
Companhia de Tecnologia Ambiental do estado de São Paulo - CETESB. Guia de coleta e preservação
de amostras de água. São Paulo, CETESB, 1988.
CENTENO, Luana Nunes (2017). Proposta metodológica para a construção de um índice de qualidade da água na bacia hidrográfica Piratini-São Gonçalo e Mangueira, RS. 190 f. Dissertação (Mestrado) - Curso de Ppg em Recursos Hídricos, Universidade Federal de Pelotas, Pelotas, 2017.
Companhia de Tecnologia de Saneamento Ambiental. 1987. Guia de coleta e preservação de amostras de água. CETESB, São Paulo, SP, Brasil.
CORRAR, L. J; PAULO, E.; DIAS FILHO, J. M. (2014). Análise multivariada para os cursos de
administração, ciências contábeis e economia. ed. 5 – Reimpressão. São Paulo: Atlas, 344 p.
FERREIRA, Daniel Furtado (2010). Estatística multivariada. 2. ed. Lavras: UFLA, 662 p.
Fundação Estadual de Proteção Ambiental Henrique Roessler – FEPAM (2018). Monitoramento da
qualidade da água da região hidrográfica das bacias litorâneas. Site oficial da FEPAM.
HAIR JR., J. F. et al. (2009). Análise multivariada de dados. 6. ed. Porto Alegre: Bookman, 688 p. HASSEN, I.; H. AMZAOUI-AZAZA, F.; BOUHLILA, R. (2016). Application of multivariate statistical
analysis and hydrochemical and isotopic investigations for evaluation of groundwater quality and its suitability for drinking and agriculture purposes: case of Oum Ali-Thelepte aquifer, central Tunisia. Environmental Monitoring and Assessment, [s.l.], v. 188, n. 3, p.135-155. Springer Nature. http://dx.doi.org/10.1007/s10661- 1.
HELLER, L.; PÁDUA, V. L. (2010). Abastecimento de água para consumo humano. 2. ed. Belo Horizonte: UFMG, 418 p.
HOLOS, Ano 36, v.1, e8858, 2020 11
LANDIM, P. M. B. (2011). Análise estatística de dados geológicos multivariados. São Paulo: Oficina de Textos, 209 p.
LIBÂNIO, M. (2010). Fundamentos de qualidade e tratamento de água. Campinas: Átomo. 494 p. MONICA, N.; CHOI, K. (2015). Temporal and spatial analysis of water quality in Saemangeum
watershed using multivariate statistical techniques. Paddy and Water Environment, [s.l.], v. 14, n. 1, p.3-17. Springer Nature. http://dx.doi.org/10.1007/s10333-014-0475-6. 016-5124-7. MINGOTI, S. A. (2013). Análise de dados através de métodos de estatística multivariada: uma
abordagem aplicada. 2. ed. Minas Gerais: UFMG. 297 p.
MUANGTHONG, S.; SHRESTHA, S. (2015). Assessment of surface water quality using multivariate statistical techniques: case study of the Nampong River and Songkhram River, Thailand.
Environmental Monitoring and Assessment, [s.l.], v. 187, n. 9, p.548-560. Springer Nature.
http://dx.doi.org/10.1007/s10661-015-4774-1
NAZIR, H. M.t al. (2016). Classification of drinking water quality index and identification of significant factors. Water Resources Management, [s.l.], v. 30, n. 12, p.4233-4246. Springer Nature. http://dx.doi.org/10.1007/s11269-016-1417-4.
R DEVELOPMENT CORE TEAM (2018). R: a language and environment for statistical computing.
Vienna, Austria: R Foundation for Statistical Computing. Disponível em:
<http://www.R-project.org>. Acesso em: 10 março de 2018.
Secretaria do Meio Ambiente e infraestrutura – SEMA (2018). Recursos Hídricos e Saneamento. Site oficial da SEMA.
SPERLING, M. (2014). Estudos e modelagem da qualidade da água de rios. Belo Horizonte: UFMG. 7 v. 588 p.
SPERLING, M. (2005). Introdução à qualidade das águas e ao tratamento de esgotos. Belo Horizonte: UFMG. 7 v. 452 p.
TAVARES, B. S. (2014). Qualidade de água na bacia hidrográfica do rio Una - Pernambuco. 2014. 110 f. Tese (Doutorado em Engenharia Agrícola) - Universidade Federal Rural de Pernambuco. Recife.
VICINI, L; SOUZA, A. M. (2005). Análise multivariada da teoria à pratica. Santa Maria: Biblioteca Central da UFSM. 215p.