1
Instituto Superior de Ciências do Trabalho e da Empresa
AN ANALYSIS OF THE ACS / DRAGADOS MERGER
Diogo Nuno Correia Torrado
Dissertation submitted as a partial requirement to obtain the master degree in Finance
Tutor:
Prof. Doutor Clara Raposo, ISCTE Business School, Finance Department
key words
Merger & Acquisitions Premiums
Market & Speculative Evolution Synergies
JEL Classification System
G14 - Information and Market Efficiency; Event Studies
DISSERTATION SUMMARY
This dissertation analyses the merger between ACS, Actividades de Construcción y Servicios, S.A. (“ACS”) and Dragados, S.A. (“Dragados”), which occurred between 2002 and 2003.
ACS, one of the leading construction companies in Spain, growing through acquisitions since mid 1980’s, acquired in April 19, 2002, Santander Central Hispano’s stake in the competitor Dragados (23.5% of share capital). In the following year, ACS acquired, in the market, another 10% of Dragados share capital (as of March 21, 2003) and, later in that year (as of December 15, 2003), a merger between the two companies was completed and full integration was initiated.
This dissertation characterizes both companies, goes through the mains events of the merger process, looks at the operation rationale, and tries to determine if the premiums paid by ACS versus Dragados’ closing price at (i) the date of Santander Central Hispano stake acquisition (59% premium), (ii) nine months later, at the date of the acquisition of the further 10% (36% premium) and (iii) implicit in the final merger conditions (1% premium) were, as of December 2003, positively outbalanced with stock price evolution until the merger was concluded and with future synergies to be achieved after full integration of the two companies.
The final outcome is that, as of December 31, 2003, the merger had a strong rationale and, despite the referred premiums paid by ACS, globally created value to ACS shareholders, mainly due to both stock price evolution and the future synergies to be achieved: tax savings on goodwill amortization, headcount reduction and economies of scale in cost structure. Also, I present a brief event study to show that Dragados shareholders benefited from positive speculative movements around the target stock price at the day of the first acquisition announcement (April 19, 2002).
Final Note – This dissertation contains information and forward-looking statements of the time of the merger process, with respect to ACS, Dragados and to ACS / Dragados new group (“New ACS”) compiled from different sources. Therefore, market evolution of both companies and actual results may differ materially from the information and results presented in this dissertation.
RESUMO DA DISSERTAÇÃO
Esta dissertação analisa a fusão entre a ACS e a Dragados, a qual ocorreu entre 2002 e 2003. ACS, uma das empresas espanholas de construção líderes em Espanha, a crescer via aquisições desde meados da década de 80, adquiriu, a 18 de Abril de 2002, a participação que o Banco Santander Central Hispano detinha na concorrente Dragados (23.5% do capital da empresa).No ano seguinte, a ACS adquiriu, em bolsa, outros 10% do capital da Dragados (concretizada a 21 de Março de 2003) e, mais tarde nesse ano (concretizado a 15 de Dezembro de 2003), a fusão entre as duas empresas foi concluída e deu-se início à integração total das duas empresas.
Esta dissertação caracteriza ambas as empresas, descreve os principais eventos do processo de fusão, olha em detalhe para o racional da operação e procura determinar se os prémios pagos pela ACS versus a cotação de fecho das acções da Dragados: (i) na data da aquisição da participação do Santander Central Hispano (prémio de 59%), (ii) nove meses depois, na data da aquisição dos 10% adicionais (prémio de 36%) e (iii) implícito nas condições finais da fusão (prémio de 1%) foram, a Dezembro de 2003, contrabalançados positivamente pela evolução da cotação da acções da ACS e da Dragados até à data da conclusão da fusão e pelas sinergias futuras a serem alcançadas com a integração total das duas empresas.
As conclusões obtidas com a dissertação indicam que, à data de 31 de Dezembro de 2003, a fusão possuía um forte racional e, apesar dos prémios pagos pela ACS, criou valor para os accionistas, principalmente devido à evolução da cotação de ambas as acções e às futuras sinergias a obter, nomeadamente poupanças fiscais com a amortização do goodwill, reduções na estrutura de pessoal e economias de escala na estrutura de custos.
Adicionalmente, é apresentado nesta dissertação um breve event study que demonstra o benefício obtido pelos accionistas da ACS devido a variações especulativas positivas na cotação das suas acções, no dia do anúncio da aquisição da participação do Santander Central Hispano (19 de Abril de 2002).
Nota Final – Esta dissertação contém informações e projecções da ACS, Dragados e New ACS, compiladas de diferentes fontes de informação, que se reportam ao período em que decorreu o processo de fusão. Assim, a evolução de mercado de ambas as empresas e os resultados actuais podem diferir materialmente da informação e resultados alcançados nesta dissertação.
TABLE OF CONTENTS
1. Introduction...8
2. Brief Literature Review on Takeovers...9
2.1. Efficiency of Takeovers...9
2.2. Share Blocks and Control Transfers ...13
3. ACS Description ...15
3.1. Milestones ...15
3.2. As of December 31, 2002 ...16
3.3. ACS Business Units...16
3.4. ACS Shareholder Structure...20
4. Dragados Description...21
4.1. Milestones ...21
4.2. As of December 31, 2002 ...22
4.3. Dragados Business Units ...22
4.4. Abertis...24
5. Analysis of the Deal...26
5.1. Project Thesis...26 5.2. Main Events ...27 5.3. New ACS ...31 5.4. Merger Rationale ...31 5.5. Value Creation ...33 6. Market Reaction...42 7. Conclusion ...43 8. References...44 9. Appendix...50
FIGURE INDEX
Figure 1 – ACS – Contribution to Consolidated Financials of Construction and Services...16
Figure 2 – ACS – Construction Turnover by Type of Work ...17
Figure 3 – ACS – Services Turnover by Subsidiary...18
Figure 4 – ACS Shareholders ...20
Figure 5 – Dragados Turnover by Business Area...22
TABLE INDEX
Table 1 – Premium Implicit in the Merger Deal...30
Table 2 – New ACS Turnover by Business Area ...31
Table 3 – Construction Business Plan ...33
Table 4 – Environmental Services Business Plan...34
Table 5 – Industrial Services Business Plan ...35
Table 6 – New ACS Sum of Parts Valuation...38
Table 7 – New ACS Multiples vs Main European Peers...38
Table 8 – ACS and Dragados Stock Performance ...39
Table 9 – Stock Performance of Main Spanish Construction Peers ...40
1. Introduction
ACS, as of December 31, 2002, was a Spanish reference group in the development and operation of infrastructures and services, with a skilful and talented management team, and growing by acquisitions since mid 1980’s. In that year, ACS achieved a consolidated turnover of EUR 4,400 million (growing 12.7% from previous year), and net profit of EUR 181.4 million (growing 21.6% from previous year).
In April 19, 2002, ACS initiated the most relevant corporate movement of its history, through the acquisition of a 23.5% stake in Dragados, the second largest construction group in Spain (turnover of EUR 5,542 million), with more then 60 years of operations. The investment amount, over EUR 900 million, and the strategic commitment that it implied, meaning the leadership in the Spanish construction market, shows the importance of the M&A deal. This dissertation analyses the M&A deal between ACS and Dragados, in order to assess if the merger has originated value to ACS shareholders. The main results are that:
1) The merger of ACS and Dragados had a strong rationale, based on its synergies, complementary business areas and management skills and market dimension obtained after the merger;
2) The deal created value to ACS shareholders, due to stock price evolution of both companies (even when comparing stock price evolution of the two companies with the performance of their Spanish construction peers) and also due to the synergies implicit in the merger, assessed through New ACS valuation exercise; and
3) The market responded positively to the deal announcement, from Dragados’ stock price point of view, allowing the creation of value to its shareholders.
The dissertation is organized as follows:
In Section 2, I do a brief literature review on takeovers. In Section 3 and Section 4, I give a wide characterization, as of December 31, 2002, of the two companies, ACS and Dragados. In Section 5, I analyse in detail the merger deal, describing the main process events, assessing possible economic and business motives for the operation, and providing a valuation exercise for New ACS. Afterwards, I assess the fairness of the valuation results, by comparing implicit multiples with European market comparables and calculate the value created with the
merger. In addition, I also assess value creation from the perspective of the stock price evolution of ACS and Dragados, when compared with their main Spanish construction peers. Section 6 takes a look at the market reaction to the deal, analysing possible speculative response to the deal announcement, as of April 19, 2002.
Finally, in section 7, I conclude with main results of the dissertation.
2. Brief Literature Review on Takeovers
In this Section, I make a brief literature review on Takeovers: I start by analysing the academic literature on Efficiency of Takeovers, trying to assess if these corporate movements originate wealth to shareholders and if there is evidence of efficiency gains resulting from takeovers. Following, I look at academic literature on Share Blocks and Control Transfers, trying to assess if appropriation gains takes place when an outside buyer acquires a target control block, leaving minority shareholders out of the transaction.
2.1. Efficiency of Takeovers
The academic literature on the market for corporate control and the term itself is originated from Manne (1965). In his market, shareholders can sell, possibly against the will of the target firm management, the control over the firm to an outside buyer. Given that the share price reflects projected firm performance, an outside who is better able to run the firm finds it profitable to acquire control in order to subsequently employ the firm’s assets more profitably. Moreover, a takeover typically involves much more than the mere transfer of ownership since the acquired firm subsequently undergoes a major reorganization. Its divisions are merged with or subordinated to those of the acquiring firm, divested or even dissolved. Furthermore, such restructuring takes hold of entire industries as takeovers occur in waves and are within each wave clustered by industries (Andrade et al., 2001).
Takeovers are motivated by value improvements brought about either by exploiting synergies or correcting inefficient managerial behaviour (Burkart, Gromb, and Panunzi, 2006). Disciplinary takeovers are commonly associated with hostile bids, which, initially, tend to be
opposed by target board and management. In contrast, friendly takeovers are viewed as motivated by synergies arising from combining the firms’ assets (Morck et al., 1988). In practice, many takeovers contain elements of both friendly and hostile bids. Indeed, Schwert (2000) finds hostile and friendly takeovers to be indistinguishable in economic terms, arguing that the choice of hostile or friendly offer is largely a reflection of the acquiring firm’s negotiation strategy.
In addition, competition among outsiders or, according to Jensen and Ruback (1983), competing management teams ensure that resources flow to their highest-value use. The mere threat of a takeover raises efficiency ex-ante as it disciplines managers, thereby reducing the agency costs stemming from the separation of ownership and control (Grossman and Hart, 1980a; Scharfstein, 1988).
According to Jensen (1986), the alteration of target firm managers’ strategies and their eventual replacement is particularly pertinent for cash-rich firms that enable managers to undertake unprofitable but power-enhancing investments. However, this prediction is only partly supported by the available empirical evidence. According to Burkart and Panunzi (2006), while studies on US and UK data consistently document that takeover targets are smaller than other firms, only some report that hostile takeovers tend to be directed towards poorly performing firms in troubled industries (e.g., Morck et al., 1988), suggesting that the selection process in the market for corporate control relies more on size than performance. As for poor investments by target firms, the evidence is mixed. On the one hand, takeover targets are more likely to have made poor acquisitions previously, notably poor diversification acquisitions (Mitchell and Lehn, 1990; Berger and Ofek, 1996), being the reversal of earlier unwise acquisitions a major source of gains from spin-offs (Allen et al, 1995). However, some recent studies (e.g., Campa and Keida, 2002), suggest that the diversification discount is due to the diversifying firms being different, rather than to diversification being value-destroying and, apart from large firms in the gas and oil industry, there is no systematic evidence that takeover targets over invest in internally developed projects or that capital expenditures change after the takeover (Servaes, 1994; Healy et al., 1992; Bhagat, et al.,1990).
The above line of reasoning assumes that the takeover market operates efficiently, notably that a firm whose current share price is less than it could be under the control of a different party is indeed acquired by that party. However, there are impediments to an effectively
operating takeover market, such as Grossman and Hart (1980b) free-rider problem (please see Appendix “9.7. Grossman and Hart`Free-Rider Problem” for more detail). In addition, according to Burkart and Panunzi (2006), the existence of a market for corporate control can induce behaviour that is detrimental to efficiency like managerial entrenchment or underinvestment in firm-specific human capital. Thus, the takeover mechanism gives rise to both beneficial and adverse effects: it disciplines managers and allows a more efficient use of corporate assets, but it also exacerbates agency problems.
Overall, the studies on announcement period stock returns suggest that takeovers create gains to shareholders, but that these gains accrue (almost) entirely to target shareholders. For US takeovers, average abnormal returns for target shareholders are typically found to be in the range of 15 to 30 percent (Andrade et al., 2001; Brunner, 2002). The findings for the UK are similar to those for the US (McCahery et al., 2004), while target shareholder returns in continental European takeovers are lower but still substantial at around 10 percent (Goergen and Renneboog, 2004; Campa and Hernando, 2004).
The evidence on acquiring firms’ shareholder return is far less conclusive. Some studies report positive abnormal bidder returns (e.g., Goergen and Renneboog, 2004; Schwert, 1996), others document negative bidder returns (e.g., Andrade et al., 2001), and still others find no significant effects (e.g., Stulz et al., 1990). Whether positive or negative, bidder returns are small, ranging from +5 to –5 percent. In addition, while many studies do not distinguish between (friendly) mergers and (hostile) tender offers, those that do tend to find higher target as well as bidder returns in hostile takeovers and tender offers than in friendly acquisitions and mergers (McCahery et al., 2004).
As to net shareholder wealth effect of takeovers, most studies report that the combined average abnormal returns are positive but relatively small ranging from 1 to 3 percent (e.g., Andrade et al., 2001; Campa and Hernando, 2004).
Nevertheless, irrespective of how accurately positive abnormal stock returns during the announcement period reflect the long-run wealth effects, documented shareholder gains are merely suggestive of efficiency improvements. According to Burkart and Panunzi (2006), the lack of clear evidence in support of performance improvements and in the identification of the source of shareholder gains, casts some doubt on the claim that takeovers create value. Transfers from outside buyers are one possible explanation for their low returns but high returns of target shareholders. Managers of outside buyers may overestimate their ability to
improve the target firm's operation and as a result pay a too high acquisition price (Roll, 1986). Alternatively, outside buyer’s firms tend to have large amounts of free cash flow and relatively low leverage, which tends to make them perform acquisitions with poor returns for their shareholders (Harford, 1999; Lang, et al., 1991; Bruner, 1988) or the higher levels of debt may themselves induce managers to opt for riskier ventures, further increasing the likelihood of a future bankruptcy (Jensen and Meckling, 1976). These agency problems within the acquiring firm, namely the above referred to acquisitions, can serve the purpose of empire-building (Marris, 1963, 1964), diversification of the manager's human capital risk (Amihud and Lev, 1981), or simply reflect poor application of excess cash (Jensen, 1986). Therefore, outside buyer’s returns are higher when managers of the outside buyer own larger shareholdings (Healy et al., 1997; Lewellen et al., 1985). Nevertheless, according to Burkart and Panunzi (2006) the above mentioned positive combined shareholder returns rejects the hypothesis of target shareholders gain being obtained purely at the expense of the outside buyer’s shareholders.
According to Shleifer and Summers (1988), takeovers can be a way to redistribute wealth from target stakeholders to shareholders. Outside buyers, notably in hostile bids, tend to ignore existing contracts, either explicit or implicit, and expropriate rents from the target stakeholders. Anticipating this breach of contract, target shareholders demand higher prices from the outside buyers, and thus the post-acquisition transfers show up as (part of) the takeover premium. However, the empirical evidence on transfers from stakeholders as the primary motivation for takeovers is not strong: generally neither blue-collar layoffs nor wage cuts are found to explain more than a small fraction of the takeover premium (Brown and Medoff, 1988; Kaplan, 1989a; Lichtenberg and Siegel, 1989; Rosett, 1993). In hostile takeovers cutbacks, disproportionately targeted at white-collar employees, are more important and account for 11 to 26 percent of the premium on average (Bhagat, et al., 1990). As takeovers often involve firms in the same or closely related industries (Bhagat et al., 1990), shareholder gains may also reflect increased extraction of consumer surplus. However, the empirical evidence is not conclusive. Stillman (1983) and Eckbo (1983, 1985) reject the market power hypothesis, but later studies find evidence of the extraction of consumer surplus (McAfee and Williams, 1988; Mullin et al., 1995). Nevertheless, while evidence on market power is not conclusive, according to Burkart and Panunzi (2006), transfers from consumers are most likely not an important effect of takeovers.
Alternatively, takeovers can generate tax benefits through increased utilization of tax loss and tax credit carry-forwards or through higher interest deductions associated higher debt levels. The available evidence suggests that takeovers benefited from tax savings, amounting in some cases to more than a quarter of the takeover premium (Bhagat et al., 1990). According to Kaplan (1989b, 1991), tax savings account for most of the premium in management buyouts, but these benefits are, however, significantly reduced by the rapid debt repayment. Therefore, although tax advantages are a source of takeover gains, they do not seem to be a major force behind the takeover activity.
In conclusion, according to Burkart and Panunzi (2006), a better understanding of how takeovers create shareholder wealth is important and a prerequisite for a more informed assessment of their efficiency effects.
2.2. Share Blocks and Control Transfers
The theoretical literature on takeovers suggests several ways of how the free-rider problem discussed below may be overcome. One of these proposals has in consideration takeovers where a previous control block trade takes place (in relatively dispersed shareholder structures, not necessarily holding a majority of the target firm’ shares), which allows the outside buyer to purchase shares below their post-takeover value, therefore increasing the share of the gains appropriated by the outside buyer and allowing the free-rider problem to be overcome.
As shown by Kahan (1993) and Bebchuk (1994), the incidence and efficiency of majority block transactions depend on the regulatory regime as regards the eventual obligation to buy-out minority shareholders. The appropriation on gains only takes place if the buy-outside buyer is not obliged to let the minority shareholders participate in the control transaction. Since the value of the controlling block comprises all the private benefits but only part of the firm’s market value, a surplus from a block trade does not imply efficiency nor does efficiency imply a surplus. In particular, when the target block holder’s private benefits with the takeover are relatively small compared to the outside buyer’s private benefits, a control transfer can be mutually beneficial even if the loss in share value for the block holder exceeds his increase in private benefits. In addition, according to Burkart and Panunzi (2006), inefficient control transfer can take place and efficient control transfer may fail to take place
because the trading parties do not take into account that a control transfer has a negative or positive externality on the wealth of the minority shareholders.
According to Burkart and Panunzi (2006), empirical studies on block trades in the US find that such trades are on average associated with abnormal share price increases. Moreover, the abnormal returns are smaller, but still positive, when no subsequent takeover occurs (Holderness, 2003). This evidence suggests that improved management rather than extraction of private benefits is the primary source of gains in block trades. Studies on block trades in other countries find the share price reaction to be positive or insignificant and to vary with the identity of the buyer (e.g., Banerjee et al., 1997; Trojanowski, 2002).
3. ACS Description
In this Section, I give a wide characterization of ACS, as of December 31, 2002, starting by showing the main Milestones of the group, since its creation in 1983. Then, I present ACS main business units, showing their importance in terms of economic figures and relevant projects. Finally, I present ACS shareholder structure.
3.1. Milestones
1983: A group of engineers acquires Construcciones Padrós, a mid-sized construction company with financial problems located in Badalona (Cataluña).
1986: Same strategy was repeated with the acquisition of OCISA, a prestigious construction company which was larger and already in operation for over 40 years.
1988: A diversification process was initiated through the acquisition of SEMI, a company specialized in the maintenance and installation of electric lines.
1989: Acquisition of a majority shareholding in Cobra, one of the most renown companies in the sector of support services to electric and telecommunications companies, and a market leader with over 70 years of experience.
1993: Merger of Construcciones Padrós with OCISA, creating OCP Construcciones.
1994: Divestment of non strategic assets, leading to the sale of holdings in leisure (Parque de Atracciones de Madrid) and security services (Protecsa).
1995: Total consolidation of Cobra Group in ACS is achieved, with a takeover merger. 1996: Market share in the construction business was increased with the acquisition of a significant stake in Auxini.
1997: Merger of OCP with Auxini and Ginés Navarro, creating ACS.
1999: Entering the transport sector with the acquisition of Continental Auto and consolidating a leading position in the environment sector with the acquisition of Onyx SCL and the incorporation of Vertresa.
2000: Through Xfera, ACS was awarded with an UMTS or third generation mobile telephony licence, and acquisition of Broadnet, a LMDS wireless fixed telephony operator.
2002: ACS makes a surprise purchase of 23.5% of Dragados, effectively gaining control of the company
3.2. As of December 31, 2002
In 2002, ACS had a consolidated position in the Spanish market, being a reference player in all infrastructure development chain of value, namely in the promotion, construction, management and services.
2002 was a good year for ACS. Net Turnover in that year exceeded EUR 4,400 million, a 12.7% increase from the previous year and EBITDA reached EUR 410.9 million (see Appendix “ 9.1. ACS Financials ” and “ 9.2.1. ACS Financial Evolution” for more detail). At the same time, ACS has improved profitability by the increase of its attributable net profit by 21.6% to EUR 181.4 millions, which represented a return on equity (ROE) of 19%. The number of people employed by ACS amounted to 32,555.
In April 2002, ACS acquired a 23.5% stake in Dragados at approximately EUR 900 million. Financed in equal parts with funds of ACS and with external financing, this acquisition originated Goodwill in consolidation of approximately EUR 600 million. Dragados was at the end of 2002 equity consolidated by ACS.
3.3. ACS Business Units
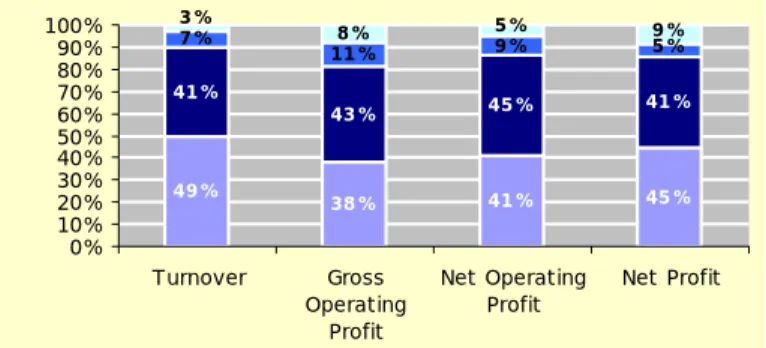
ACS activity was divided into two main business areas: Construction and Services (Cobra Group, Tecmed and Continental Auto). In addition, ACS had two business areas where strong investments were being done and future growth was expected to be achieved: Telecommunications and Concessions.
Figure 1 – ACS – Contribution to Consolidated Financials of Construction and Services
49% 38% 41% 45% 41% 43% 45% 41% 11%8% 9% 5% 7% 5% 9% 3% 0% 10% 20% 30% 40% 50% 60% 70% 80% 90% 100% Turnover Gross Operating Profit Net Operating
Profit Net Profit Construction Cobra Group Tecmed Continental Auto
3.3.1. Construction
Spanish construction output has been the main driver for GDP growth since 1999, with construction activity growing at a CAGR of 5.4%, 260 basis points ahead of GDP. This growth has been achieved due to strong residential activity backed by the Spanish Infrastructure Plan.
“2000-06 Spanish Infrastructure Plan”: EUR 113 billion to be invested up to 2006, representing the largest-ever infrastructure investment made by the Spanish Government. These funds are mainly being used for road-building (accounting for 25% of funds), rail / high-speed networks linking Madrid to the main cities in the country (25%) and hydrological planning (20%). As of 2002, the project had been a great success, with civil works output growing by 4.2% in 2000, 8.5% in 2001 and 7.4% in 2002.
To ACS, construction represented its largest business area, which includes civil works and building projects, carried out by the companies: “ACS, Proyectos, Obras y Construcciones”; “Vías” and “Construcciones and Cogesa”.
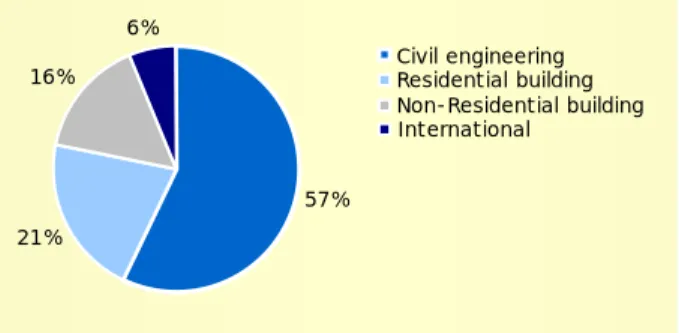
In 2002, this business area achieved a Net Turnover of EUR 2,199 million, a 16.6% increase with respect to the previous year (see Appendix “ 9.2.2. Construction Financial Evolution ” for more detail). This evolution was obtained mainly due to the domestic market (where 88% of construction revenues of ACS where generated in 2002), with International Net Turnover, developed mainly in Portugal and Chile, being 18% less than in 2001.
Figure 2 – ACS – Construction Turnover by Type of Work
57% 21% 16% 6% Civil engineering Residential building Non-Residential building International
ACS strategy in the Construction Business Area turned the Public Administration and large industrial groups into its main clients (64% and 36%, respectively, of Business Area domestic turnover).
Overall, ACS market share in the construction sector in Spain reached approximately 3% (based on a total construction output of EUR 80.65 billion in 2002, according to Euro construct).
3.3.2. Services
This Business Area covers highly diversified areas, in the fields of integral maintenance of urban and industrial infrastructure, environmental management (mainly waste management) and road passenger transportation.
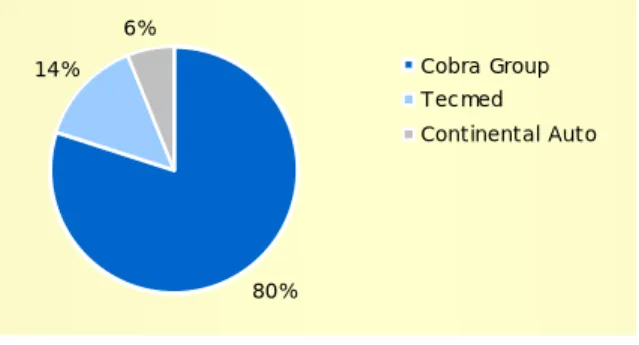
In 2002, this business area achieved a Net Turnover of EUR 2,265 million (see Appendix “ 9.2.3. Services Financial Evolution ” for more detail).
Figure 3 – ACS – Services Turnover by Subsidiary
80% 14% 6% Cobra Group Tecmed Continental Auto
As of 2002, Services Business Area integrated the following companies:
Cobra Group, including all applied engineering and complete services related to the areas of distribution networks, telecommunications, railways, industrial systems, energy projects and control systems.
Apart from first-time installation, ACS also covered the repair and maintenance of the systems or networks, an area that should account for half the Business Area Turnover (clearly a type of service less cyclical than the first-time installation).
Tecmed, deals with environmental services, mainly treatment and recycling of solid urban, special and hospital wastes. In addition to the national market, Tecmed develops its activities in France, Portugal, Morocco, Egypt and Mexico
Environmental management is a utility-like activity, in which companies obtain a contract for a number of years, generally between five and ten, with income growing in line with volumes held and tariffs being reviewed in line with inflation. For treatment plants the process is slightly different, as the companies generally obtain a concession to build it, similar to any project finance operation.
These kinds of activities are less cyclical than the Cobra Group activity and generally have a lower correlation with GDP and the investment cycle.
Continental Auto, managing ACS road passenger transportation business. Although ACS has not been able to achieve material organic growth since it first started operating in 1998, several acquisitions have followed. Despite being the least meaningful area in terms of growth and contribution to the group, the cash-flow generated by this Business Area was significant (achieving operating margin above 20%, the highest in the group).
This Business Area was also serving as a training ground for future privatisations of passenger transportation networks, such as metropolitan buses in Madrid or Barcelona, or even undergrounds.
The Services Business Area had also a wide and large experience in international markets, achieving a International Net Turnover of EUR 374 million in 2002, i.e. 16.5% of the total income of this Business Area. Of this figure, 2/3 corresponds to Portugal, where Cobra has an important presence, and the rest is divided over 40 countries.
3.3.3. Concessions
This Business Area groups all the transportation infrastructure concessions (highways, railways, public transport interchanges, etc.) and those of energy generation and distribution concessions.
3.3.4. Telecommunications
As of 2002, and due to its significance within the Spanish economy and growth prospects, ACS was also present in the Telecommunication sector:
Xfera, holding a 20% stake in Xfera, a consortium awarded with one of the third generation UMTS mobile telephony in Spain on March 10, 2000 (at that date, this technology was yet being developed, and commercialization was set only to the end of 2004).
Broadnet Consortium, holding a 20% stake in this consortium which was awarded with three wireless mobile telephony licenses (LMDS) in Spain on March 10, 2000.
Obralia, holding a 15% stake in the Spanish construction sector reference portal.
3.4. ACS Shareholder Structure
Main shareholders in ACS were Florentino Perez (Chairman of ACS), Alberto Cortina & Alberto Alcocer and the March Family. Although core shareholder for many years, as of December 31, 2002 the March Family was not involved in the company’s day-to-day management.
Figure 4 – ACS Shareholders
24% 15% 11% 5% 5% 40% March Family
Alberto Cortina & Alberto Alcocer Florentino Perez
Zaragozano Bank Chase Manhattan Free Float
4. Dragados Description
In this Section, I give a wide characterization of Dragados, as of December 31, 2002: I start by showing the main Milestones of the group, since its creation in 1941. Then, I present Dragados main business units, showing their importance in terms of economic figures and relevant projects. Finally, I present Abertis, a major project in the Spanish road building and operation market, where Dragados had, as of December 31, 2002, a crucial role in its shareholder structure.
4.1. Milestones
1941: Dragados y Construcciones is formed to dredge the Port of Tarifa. 1945: Dragados begins construction on its first hydroelectric dam projects.
1953: Dragados begins its first airport construction project at Hondarribia Airport in Guipuzcoa.
1965: The Company begins its first international project with a contract to participate in the construction of Turkey's Kadinicik Dam.
1967: Dragados takes on its first toll road construction and management concession between Seville and Cadiz.
1970: The Company begins industrial construction activities with Amposta Field offshore oil platform.
1975: A dedicated Industrial Plants Business Area is created.
1988: A Services Business Area is created as the company expands into waste and water treatment and other infrastructure services.
1995: A new subsidiary, Dragados Industrial, is formed.
1999: The Company changes its name to Grupo Dragados and acquired a 45% stake in Sopol, based in Portugal.
2001: Spin off of its real estate holdings into a merger with immobiliaria Urbis, taking a 20% share of the enlarged Urbis.
Additionally, Dragados launches a friendly takeover of Netherlands’s Hollandsche Beton Groep (for a cost of USD 655 million). These takeover doubled Dragados size, placing it as number three in Europe, behind France’s Bouygues and Vinci.
2002: ACS makes a surprise purchase of 23.5% of Dragados Group, effectively gaining control of the company
4.2. As of December 31, 2002
Dragados y Construcciones ("Dredging and Construction") was formed in 1941 as part of the effort to build the Port of Tarifa, in Cadiz. The company continued to build expertise in port and harbour dredging, construction, and services, being in the start of the XXI century one of the leading European groups in these sectors.
As of 2002, Dragados was Spain's second-largest construction and engineering company, with more than 60 years of experience, and holding an extensive portfolio of international projects and concessions (foreign operations accounting for some 20 percent of the Dragados Consolidated Turnover). The company turnover reached EUR 5,542 million and EBITDA reached EUR 378.7 million (see Appendix “ 9.3. Dragados Financials ” for more detail).
4.3. Dragados Business Units
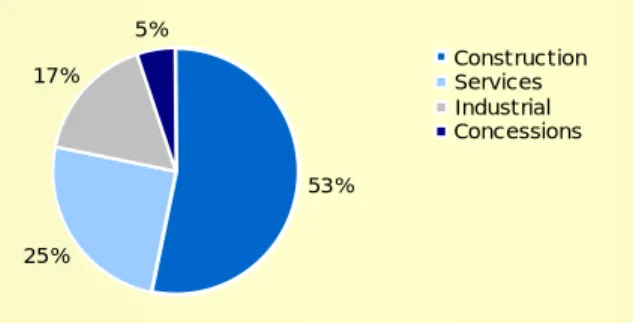
Dragados activity is divided into four business areas: Construction; Services; Industrial and Concessions.
Figure 5 – Dragados Turnover by Business Area
53% 25% 17% 5% Construction Services Industrial Concessions
The company, stood to become one of the largest in all Europe, operated under four business areas:
4.3.1. Construction
The largest division of Dragados in terms of Turnover, overall this division had a market share in the construction sector in Spain of approximately 4% (based on a total construction output of EUR 80.65 billion in 2002, according to Euro Construct).
4.3.2. Services
Ranging from street cleaning to waste treatment (mostly collecting and cleaning) to port services and facilities management.
In waste management, Dragados (and also ACS) was highly specialised, covering the whole cycle: waste collection and street cleaning, waste management and waste recycling. And, although the first three were very mature in Spain, with high levels of competition in the award of new contracts or renewals, waste recycling was a growing area.
Dragados entered seaports management in 2000, when it acquired Maritima Valenciana and, with it, the control of Valencia and Alicante ports. Up to 2002, it turned into a strategic area for the Group, through which Dragados controlled at the end of 2002 the container traffic in eight seaports. Traffic in continental seaports in Spain in the last decade (up to 2001) achieved 43% growth, with several of Dragados’s ports clearly outpacing the rest. Nevertheless, seaports and facilities management are areas of significant turnover but moderately earnings, especially in the facilities management, which achieved only about a 4% of operating margin.
4.3.3. Industrial
Grouping the company's industrial construction and engineering projects, as well as its telecommunications infrastructure operations and new technology businesses, including internet.
4.3.4. Concessions
This included an international array of toll road, airport, and railroad concessions, mostly through its participation in Abertis Infraestructuras, which oversees a network of companies engaged in toll way development and maintenance.
Dragados strategy for concessions was as follows:
1) It bids for the concessions and retains whatever stake is awarded during the building process. This involves taking a stake at the riskiest point in the project, looking for financing and handling the construction work.
2) Once the concession starts operating, Dragados sells it to a concession operator. It may not get the total return it could achieve if it waited until the end of the period, but it recovers the investment earlier and frees up capital to continue investing in new projects. Obviously, the first target for Dragados concessions divestments is Abertis, and only if it is not interested will the group need to start looking for another buyer.
4.4. Abertis
Abertis, which resulted from the merger of Aurea, Acesa and Iberpistas, represented the combination of nearly 40 years of road-building in Spain.
Dragados entered the road-building market in the mid-1960s, based on its experience paving runways for the country's airports. Dragados later emerged as a major force in the Spanish and international infrastructures market, completing more than 2,500 kilometres of highways, including toll roads, as well as more than 4,000 kilometres of other roadways, among other projects.
Dragados began shifting its strategy in the late 1990s, seeking to reduce its reliance on construction and instead focus on its other fast-growing operations, such as its Services divisions, and also to broaden its international operations. As part of this effort, Dragados spin off part of its concessions business, including its Spanish toll road operations, into a merger with another major Spanish toll road operator, Aumar, in 2000, creating Aurea Infrastructure and Concessions.
Following its merger with Dragados toll road business, the company reincorporated as the publicly listed Aurea. Dragados remained the company's largest shareholder, with a participation of 36%.
The second member of the later Abertis was Acesa, which started out as Autopistas, Concessionária Española SA, and was founded in 1967 in order to build Spain's first toll road, the highway linking Montgat and Mataró. Based in Barcelona, Acesa became a major regional player, constructing nearly 550 kilometres of roadway.
The third member of the later Abertis was Iberpistas. Owned by four families, Iberpistas originated as part of Canales y Túneles SA, which was awarded the concession to build the roadway link between Villalba and Adanero. As of 2000, Iberpistas was the country's fourth largest toll road operator with a 600-kilometer network under its control.
5. Analysis of the Deal
5.1. Project Thesis
From now on, the main focus of the dissertation is to determine whether the merger between ACS and Dragados created value to ACS Shareholders.
To achieve this goal, I start by characterizing the merger: presenting Main Process Events, since the deal between ACS and Dragados was divided in three separate operations, and briefly describing New ACS (the group that resulted from the merger).
Then, I work on the Merger Rationale, identifying possible economic and corporate reasons for this merger, and, following, I verify if the deal has created value to ACS shareholders. In the three operations, ACS paid premiums versus Dragados’ previous closing day prices, which were substantial in the two first acquisitions. Therefore, in order for this merger to create value to ACS, the future synergies implicit in the merger must have off set the premiums paid.
With the purpose of assessing value created with implicit synergies, I apply the sum of parts approach, using discounted cash flow methodology to value main business areas of New ACS. In order to verify if the valuation numbers achieved are reasonable, I compare the implicit multiples of my valuation exercise with those of the main European construction companies, as of December, 2003.
As mentioned above, the merger process was divided in three different operations: 1) Acquisition by ACS of a 23.5% stake in Dragados as of April, 2002,
2) Acquisition by ACS of an additional 10% stake in Dragados as of February, 2003,
3) Final merger between the two companies, through a share-for-share exchange, concluded in December, 2003.
Therefore, we also need to have in consideration in our value creation approach, both stock price evolution of ACS and Dragados, until the completion of the merger process. Thus, I compare stock price evolution of ACS and Dragados with their Spanish construction peers, at the time of the three different acquisitions: April 19, 2002 – March 21, 2003 – December 12, 2003.
5.2. Main Events
5.2.1. Acquisition of Santander Central Hispano Stake (April, 2002)
In April 19, 2002, two days ahead of the Dragados Shareholder General Meeting (“SGM”), ACS surprised the market by announcing the acquisition of Santander Central Hispano 23.5% stake in Dragados (corresponding to 40.502.570 shares), just under the level at which Spanish law requires it to launch a full takeover attempt, for a record amount of EUR 869,959 thousand (representing the most relevant corporate movement performed by ACS since its creation).
The price paid was EUR 22.2 per share, which implied a 59% premium versus Dragados’ previous day closing price of EUR 14.0. ACS was then trading at EUR 29.1.
Quickly, the new Dragados shareholder introduced material corporate changes to the company, sustaining that the premium paid was a controlling one:
1) A block to the votes was approved, so that no one, regardless of the amount of shares owned, could have more than 25% of voting rights, therefore turning the 23.5% stake of ACS into a controlling one.
2) Some changes were made to Dragados board of directors: the president was replaced (Mr. Perez took charge) and ACS nominated another 6 board members out of 12. The smaller ACS was able to gain a majority on Dragados board of directors, giving it effective control of the company’s day-to-day decisions.
3) Recently acquired Dutch contractor Hollandsche Beton Groep was sold to Royal BAM NM, for a little more than Dragados had paid (USD 655 million), in a clear move designed to allow the future merger.
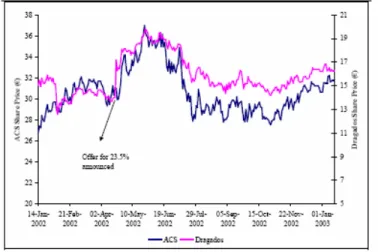
During this period both stock prices moved sideways, and no further information or strategy was provided, apart from the fact that ACS management stated, at each results publication, that they intended to increase the cooperation with Dragados.
Figure 6 – ACS vs Dragados: 1 Year Stock Price Performance
The acquisition was financed in equal parts with funds of ACS itself and with external financing through a syndicated loan (up to EUR 450 million) granted by Caja de Ahorros y Monte de Piedad de Madrid and Caixa D’ Estalvis i Pensions de Barcelona.
5.2.2. Acquisition of the additional 10% Stake (January / February, 2003)
On January 15th, 2003, ACS filed with CNMV a public share purchase offer for up to 10% of Dragados Shares. According to Spanish law, 10% was the minimum compulsory amount a company would need to launch the offer, once it surpasses a 25% stake (and as long as it remains below 50%). The law did not set out any requirements as to the price.
The prospectus, approved by the CNMV on February 14th, 2003, specified that the objective of this acquisition was to strengthen the Company’s strategic position within Dragados. No agreements were made towards the merger, only the intention of proposing a study of the advisability and desirability of such merger.
The CNMV communicated the positive result of the acceptance terms on March 21st, 2003 with 59,938 shareholders coming forward with a total of 106,763,025 shares, resulting in a demand of 619.5% above the offer. As a result, the minimum allocation for each acceptance was established at 72 shares. As a consequence of this and of the established distribution, a total of 17,221,599 shares were assigned, representing 9.99% of the capital of Dragados. The price paid was EUR 22.2 per share, the same price that ACS had paid Santander Central Hispano for the 23.5% stake. At this date, the price implied a premium of 36% versus Dragados’ previous day closing price of EUR 16.3. ACS was then trading at EUR 31.3. In terms of corporate strategy, one could question the reason why ACS management decided to raise the stake to 33.5%, paying the 36% premium, if a few months later a merger took place. The strongest explanation was that this movement was made to protect Dragados from a hostile bid by a third party:
1) As of 2002 Dragados SGM, the company was partly protected, as no single shareholder was permitted to control more than 25% of the votes. Nevertheless, this could be changed by a two-thirds majority of the board. In order to do this, a third party would have to make an offer for at least 50% of the capital. Under the Spanish takeover law, this would oblige it to bid for at least 75% of the shares.
2) Therefore with ACS upgrading its stake to 33.5%, if a third party wanted to launch a bid it would probably have to top ACS offer price by a reasonable amount, and, even in the worst case scenario where a third party would successfully bid for control of Dragados, ACS would, at least, recover its investment.
3) Thus, the premium paid by ACS was a defensive one, allowing it to strengthen the position in Dragados shareholder structure.
This acquisition was totally debt financed, through the same syndicated loan of Caja de Ahorros y Monte de Piedad de Madrid and Caixa D’ Estalvis i Pensions de Barcelona (held 50/50), increasing the commitment amount up to EUR 832,664 thousand (EUR 382,319 thousand for the acquisition of the additional 10%).
5.2.3. Final Merger Process (July / December, 2003)
On July 3, 2003, the Boards of Directors of the two companies approved the beginning of the merger process, an operation approved by both Extraordinary Shareholders' Meetings on October 14th of the same year. Soon afterwards, on December 15, 2003, the New ACS shares were floated, as a result of the merger with Dragados.
Supported by renowned international banks (Advisory: Lazard and Goldman Sachs; Fairness Opinion: Merrill Lynch and Citigroup) the terms of exchange were set as follows:
1) Exchange of 33 newly-issued ACS shares for every 68 existing Dragados shares, which equalled 2.09 relative price.
2) 54.46 million new ACS shares were issued to Dragados shareholders (in order to absorb the 65% of Dragados capital that ACS did not owned), representing 46% of the share capital of the New ACS.
3) Total number of shares of the New ACS was 118.8 million.
4) Cancellation of 35% of the share capital of Dragados (33% of Dragados share capital owned by ACS and 2% Dragados treasury stock)
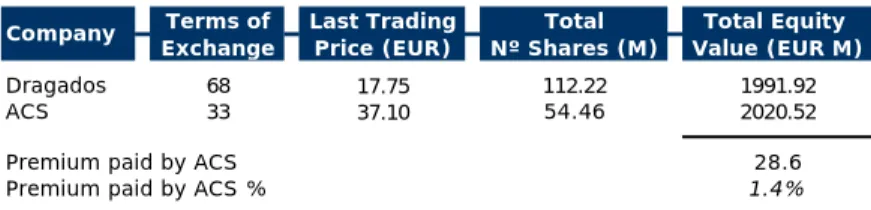
As of December 12, 2003, last trading day of Dragados shares, despite almost irrelevant when comparing to the previous operations, a premium was implicit in the terms of exchange (announced in July 3, 2003).
Table 1 – Premium Implicit in the Merger Deal Terms of Last Trading Total Total Equity Exchange Price (EUR) Nº Shares (M) Value (EUR M)
Dragados 68 17.75 112.22 1991.92
ACS 33 37.10 54.46 2020.52
Premium paid by ACS 28.6
Premium paid by ACS % 1.4%
Source: Company data - Bloomberg - author calculations
5.3. New ACS
The New ACS achieved a pro-forma Turnover of EUR 10.7 billion, EBITDA of EUR 932 million (EBITDA margin of 8.7%), Equity of EUR 1.8 billion and Net Debt of EUR 1.2 billion.
The New ACS activity was driven by construction and industrial demand, with around 52% of group turnover being construction-driven and industrial investment accounting for around 29% (please see Appendix “ 9.6. New ACS Financials (pro-forma) ” for more detail).
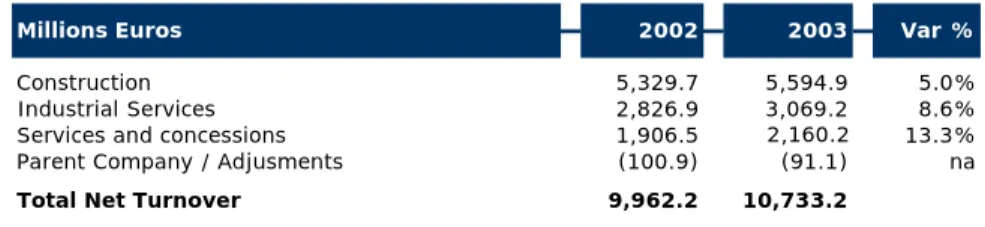
Table 2 – New ACS Turnover by Business Area
Construction 5,329.7 5,594.9 5.0%
Industrial Services 2,826.9 3,069.2 8.6%
Services and concessions 1,906.5 2,160.2 13.3% Parent Company / Adjusments (100.9) (91.1) na
Total Net Turnover 9,962.2 10,733.2
Source: ACS 2003 Annual Report
Var %
Millions Euros 2002 2003
The New ACS was to be controlled by the March family (13% of the shares), Alberto Cortina and Alberto Alcocer (9% of the shares plus voting rights of another 2.5%) and the president, Florentino Perez (5%). Both the March family and the Albertos act as financial shareholders, leaving the day-to-day management and most relevant corporate decision-making in the hands of Mr. Perez and his team.
5.4. Merger Rationale
Overall, the merger between ACS and Dragados had implicit several positive aspects:
5.4.1. Synergies
According to the management, cost savings, net of taxes, by the end of the third year post-merger could achieve up to EUR 85 million. Main drivers were tax savings on goodwill
amortisation (according to Spanish law once you merge, the goodwill previously associated with the merged company starts being tax deductible), headcount reduction and economies of scale, especially in the construction and services areas (for instance, increase of bargaining power in the acquisition of building materials).
5.4.2. Strong Management
ACS had a younger and financially-oriented management team, while Dragados management team was older and more engineering-oriented. A solid integration of both would allow for improved expertise with a more efficient cost approach.
5.4.3. Market Consolidation
The merger created a strong leader in the construction sector in Spain, which could allow a more competitive and strong commercial approach.
5.4.4. Reducing Activity Fluctuations
Activities of New ACS were going to become more balanced between cyclical business (construction and the development and installation sub areas of the services Business Area) and stable business (environmental and industrial maintenance) allowing a more defensive earnings stream. Nevertheless, the nature of ACS Group would not change, as over 50% of its EBITDA was going to continue to be generated from cyclical activities (mainly construction, but also facilities management and sea ports).
5.4.5. More Complementary Business Portfolio
With the exception of the construction area, in which Dragados had greater experience, the rest of the activities were complementary, allowing for a better integration of the value chain,
and thus potentially generating higher returns over the long term. For instance, in environmental services, Dragados was larger in waste collecting and cleaning, while ACS was more specialised in waste treatment and recycling.
5.4.6. Dimension
With almost EUR 5 billion of market cap and more than 65% free float, New ACS was going to jump into the “tier 1” group of Building & Construction stocks, most certainly improving average daily volumes and allowing the future inclusion in several major European indices.
5.5. Value Creation
5.5.1. Construction
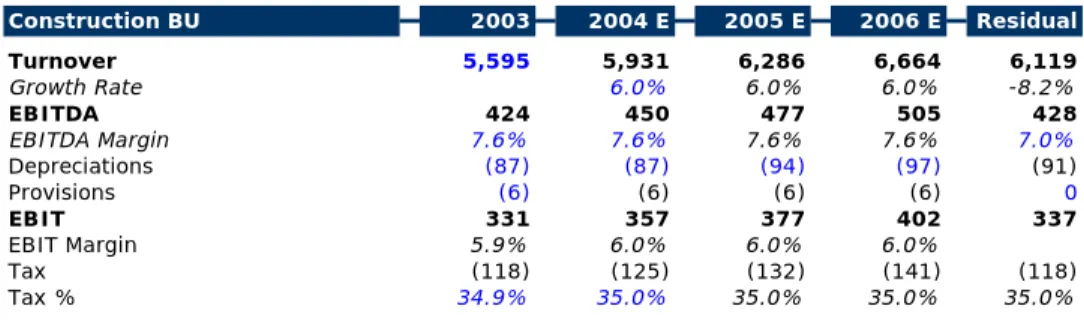
Table 3 – Construction Business Plan
(53% Turnover, 44% EBITDA, as of December 31, 2003)
Turnover 5,595 5,931 6,286 6,664 6,119 Growth Rate 6.0% 6.0% 6.0% -8.2% EBITDA 424 450 477 505 428 EBITDA Margin 7.6% 7.6% 7.6% 7.6% 7.0% Depreciations (87) (87) (94) (97) (91) Provisions (6) (6) (6) (6) 0 EBIT 331 357 377 402 337 EBIT Margin 5.9% 6.0% 6.0% 6.0% Tax (118) (125) (132) (141) (118) Tax % 34.9% 35.0% 35.0% 35.0% 35.0%
Source: ACS Annual Report 2003 - author calculations - MorganStanley report December 2003
Residual 2006 E
Construction BU 2003 2004 E 2005 E
According to Construction Business Plan, turnover will outrun past performance in the following years, although for residual value Construction Business Plan estimates a deceleration in Turnover (basically, considering an average of the four previous years).
This trend is supported by the implementation of an infrastructure plan up to 2006, which will continue to drive strong demand in the Spanish construction sector (bear in mind that, as of
December 31, 2003, civil works accounted for 59% of New ACS Construction Business Area Turnover).
Moreover, as of late 2003 there were strong reasons for believing in the implementation of the infrastructure plan in full force:
1) Spain was still benefiting from EU cohesion funds and almost 30% of the total funds used in the plan were financed by these EU funds,
2) A large part of the plan (18%) was being privately financed (toll motorways concessions, for instance),
3) Spain’s budget was still in equilibrium, and construction investment was being a strong contributor to GDP and employment (likely to account for 2% of GDP in 2003).
In addition, the increasing size of the contracts awarded was reducing competition and allowing for the projection of a higher margin for 2004 and onwards. After the end of infrastructure expenditure, the increased competition for fewer contracts should start to drive margins down for the whole industry, and Construction Business Plan predicts a margin adjustment to 7% in residual cash flow.
5.5.2. Environmental Services
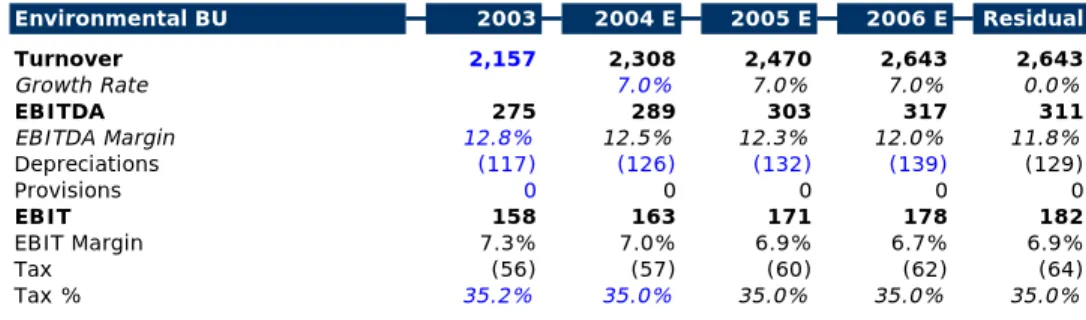
Table 4 – Environmental Services Business Plan (20% Turnover, 27% EBITDA, as of December 31, 2003)
Turnover 2,157 2,308 2,470 2,643 2,643 Growth Rate 7.0% 7.0% 7.0% 0.0% EBITDA 275 289 303 317 311 EBITDA Margin 12.8% 12.5% 12.3% 12.0% 11.8% Depreciations (117) (126) (132) (139) (129) Provisions 0 0 0 0 0 EBIT 158 163 171 178 182 EBIT Margin 7.3% 7.0% 6.9% 6.7% 6.9% Tax (56) (57) (60) (62) (64) Tax % 35.2% 35.0% 35.0% 35.0% 35.0%
Source: ACS Annual Report 2003 - author calculations - MorganStanley report December 2003
Residual 2006 E
Environmental BU 2003 2004 E 2005 E
According to Environmental Services Business Plan, turnover will exceed past performance. This growth is based in facilities management services, which will improve strongly as the
activity develops in Spain (with politicians and the EU becoming more environmentally conscious, “clean” alternatives are being strongly promoted), and sea ports management. Given that most international trade is conducted by sea, plus the number of coast kilometres in Spain and the improvement in the inland infrastructure system, with multiple highways and high-speed train kilometres being built, Environmental Services Business Plan predicts that sea port management will be one of the highest-growing areas in New ACS.
However, as both operations have the lowest EBITDA margin within the Environmental Services Business Area, growing turnover will jeopardize margins.
5.5.3. Industrial Services
Table 5 – Industrial Services Business Plan (28% Turnover, 29% EBITDA, as of December 31, 2003)
Turnover 3,069 3,284 3,514 3,760 3,407 Growth Rate 7.0% 7.0% 7.0% -10.0% EBITDA 278 295 315 337 306 EBITDA Margin 9.0% 9.0% 9.0% 9.0% 9.0% Depreciations (79) (71) (72) (77) (75) Provisions 0 0 0 0 0 EBIT 199 224 243 260 231 EBIT Margin 6.5% 6.8% 6.9% 6.9% 6.8% Tax (70) (78) (85) (91) (81) Tax % 35.3% 35.0% 35.0% 35.0% 35.0%
Source: ACS Annual Report 2003 - author calculations - MorganStanley report December 2003
Residual 2006 E
Industrial Services BU 2003 2004 E 2005 E
The previous engineering and new technologies business areas of Dragados and the support services business area of ACS (Cobra Group) were aggregated in the Industrial Services Business Area of New ACS. Moreover, this Business Area also includes design, building and/or installation of industrial plants, systems or networks, such as cogeneration plants, cable networks, oil stations and rail catenaries.
The difference between industrial services and construction, for instance, is that in the former the client is generally a private one, and in construction, since raw materials are more value-added, projects with higher technical requirements allow for higher margins.
According to the Industrial Services Business Plan, turnover will outrun past performance in the following years. Dragados clear leadership in the large oil engineering projects, as well as current existing backlog should allow for the projected turnover increase (benefiting from high energy prices, ACS strong relationships with the electrical utilities and large contracts for high-speed train and maintenance contracts).
5.5.4. New ACS Valuation, as of December 31, 2003.
In order to verify if the merger, as of December 31, 2003, created value to ACS, we need to calculate New ACS valuation, having in consideration future cash flow to be generated. In such a diversified group, an appropriate way to value it is to use the sum of parts approach: for the three main Business Units set out above – Construction, Environmental Services and Industrial Services – I used a discounted cash flow methodology, with projections up to 2006 and then considering a residual cash flow, based in the four previous projected years.
For individual DCF Valuations of Construction, Environmental Services and Industrial Services Business Areas, including detailed New ACS WACC calculation, please see Appendix “ 9.5. DCF Valuations ”.
Nevertheless, brief notes to such DCF calculations:
1) The projections are net of all merger-related costs (up to EUR 110 million net of taxes, as of December 31, 2003, according to management estimation at the date of the merger),
2) The projections take into account all forward synergies implicit in the merger,
3) The average annual aggregate investment of ACS and Dragados, between December 31, 1999 and December 31, 2003 was EUR 580 million, split between EUR 200-250 million of capex and EUR 380-330 million spent in acquisitions. The capex projections tend to follow
closely this investment trend, considering nevertheless that no more acquisitions will be made in the future.
4) Finally, we need to bear in mind that there is risk associated with integration problems, which could jeopardize the projections set out above. Nevertheless, I tried to accommodate such risk by adopting a cautious approach to ACS management projections for the following years, namely, with no residual growth (g) being considered in any of the DCF Calculations.
5.5.4.1. Concessions
Dragados historical stake in Aurea was transformed into a stake in Abertis (after merger between Aurea and its main Spanish rival Acesa). As such, the stake was diluted from 34% to 11%, and increased over the years to 12%, as of December 31, 2003.
In addition, the New ACS had direct financial stakes in 19 concessions projects: 14 motorways, 1 tunnel, 3 airports and 1 rail project (see Appendix “ 9.5.5. ACS / Dragados Concessions Portfolio (Excluding Abertis) ” for more detail).
Nevertheless, high returns were becoming harder to achieve (44% of the new kilometres to be built were going to be toll-free, reducing potential return) and bids were becoming riskier: in the bidding process of 2003 (that took place on November 6, comprising five new projects encompassing the building of 320 toll kilometres and 162 toll-free kilometres) the large construction companies decided to bid individually, instead of in consortium, assuming a much larger risk.
Therefore, the Concession Business Plan was to evaluate conservatively, with the value considered in the sum of parts (EUR 500 million) based only on Abertis market value (ACS / Dragados stake in the company represented a financial investment without effective control) plus the book value of the contracts being held by New ACS directly.
5.5.4.2. Xfera
Despite the investment made as of December 31, 2003 (EUR 200 million of capital invested in the UMTS licence), this project was not yet operational and had been put on hold by ACS
management. Therefore I consider a zero value for this Business Area, moreover the investments made were sunk costs to New ACS.
5.5.4.3. New ACS Aggregate Valuation
The following table sums up New ACS Valuation:
Table 6 – New ACS Sum of Parts Valuation Nº Shares EUR
(Million) Per Share
Construction 3,058 25.8 Environment 1,717 14.5 Industrial 1,652 14.0 Concessions 500 4.2 Core Activities 6,927 58.5 Xfera 0 0.0 Urbis 102 0.9 Abertis 727 6.1 Minorities (145) -1.2 Net Debt (1,231) -10.4
Total Equity Value 6,380 53.9
Source: ACS Annual Report 2003 - author calculations - MorganStanley report December 2003
118.4
Activity Million EUR
5.5.7. Multiples – New ACS vs Main European Peers
Comparing New ACS valuation implicit multiples with the market performance of main European construction peers, as of December 3, 2003, I try to show the fairness of New ACS valuation exercise presented above.
Table 7 – New ACS Multiples vs Main European Peers Enterprise
Value
New ACS Spain EUR 7,611 10,733 932 698 0.71 x 8.17 x 10.90 x
Acciona Spain EUR 3,148 3,865 394 255 0.81 x 7.99 x 12.36 x
FCC Spain EUR 4,608 6,050 783 500 0.76 x 5.89 x 9.22 x
Ferrovial Spain EUR 10,299 6,026 759 571 1.71 x 13.57 x 18.05 x
ACS Spain EUR 5,928 8,825 766 519 0.67 x 7.74 x 11.43 x
Vinci France EUR 8,513 18,111 1,607 982 0.47 x 5.30 x 8.67 x
Skanska Sweden SEK 25,515 132,879 6,247 4,439 0.19 x 4.08 x 5.75 x
Hochtief Germany EUR 850 10,534 384 121 0.08 x 2.22 x 7.03 x
Bouygues France EUR 12,914 21,822 2,451 1,196 0.59 x 5.27 x 10.80 x
Eiffage France EUR 1,289 7,104 370 211 0.18 x 3.48 x 6.11 x
Sacyr Spain EUR 9,784 3,334 544 446 2.93 x 18.00 x 21.95 x
Average of Main European Construction Players Multiples 0.84 x 7.35 x 11.14 x Source: Bloomberg
EBIT EV / Sales EV / EBITDA EV / EBIT
EBITDA
5.5.8. ACS and Dragados Stock Performance
In order to assess the value creation from a stock price evolution point of view, we need to have in mind the time passed between the first and second acquisitions, as of April 19, 2002 and March 21st, 2003 and the final merger date, when Dragados shares stop trading, as of December 12, 2003.
Furthermore, we need to calculate the gain / loss to ACS for deciding to acquire a 23.5% of Dragados for more or less 20 months (602 days between the acquisition day and last trading day) and to acquire additional 10% of ACS for more or less 8 months (266 days between the acquisition day and last trading day).
Overall, these acquisitions were very positive to both stocks, since ACS acquired, from the beginning, a controlling position in Dragados, and this, although not as effective as a full merger operation, created positive awareness, with analysts and investors expecting the merger to take place, sooner or later.
Table 8 – ACS and Dragados Stock Performance April 19, 2002
Price Price (EUR) Var % Price (EUR) Var %
Dragados 14.0 16.3 16.6% 17.8 26.8%
ACS 29.1 31.3 7.5% 37.1 27.6%
Source: Company data - Bloomberg - author calculations
5.5.8.1. Performance of Spanish Construction Stocks
Nevertheless, we can always question if stock performances were only due to the merger process or also due to strong macro indicators from Spanish construction sector, namely the implementation of the Infrastructure Plan 2000-2006.
One way to verify this is to compare the performance of ACS and Dragados stocks during the merger process with the market performance of their main peers.
However, the significant diversification by Spanish construction peers over the last decade limited the relevance of comparisons among companies, as the various expansion policies created very different conglomerates.
With FCC generating 37% of its operating profit from cement and with no exposure to concession business, and Acciona, also with no concession business and very exposed to logistics (21% of operating profit), the closest competitor for ACS and Dragados would be Ferrovial, specially in terms of turnover mix, as both are focused on construction, maintenance environmental services and concessions.
Table 9 – Stock Performance of Main Spanish Construction Peers April 19, 2002
Price Price (EUR) Var % Price (EUR) Var %
Dragados 14.0 16.3 16.6% 17.8 26.8%
ACS 29.1 31.3 7.5% 37.1 27.6%
Obrascon Huarte Lain 6.6 4.2 -35.9% 5.6 -15.5%
Sacyr Vallehermoso 8.8 8.4 -4.3% 10.9 24.0%
FCC 28.7 22.9 -20.3% 29.5 2.7%
Ferrovial 24.9 25.5 2.4% 26.8 7.4%
Acciona 40.9 43.8 7.0% 47.0 14.9%
Source: Company data - Bloomberg - author calculations
Company March 21, 2003 December 12, 2003
Therefore, taking into account the market evolution of Ferrovial, we can estimate, prudently, that at least 20% of total market evolution of ACS and Dragados (out of 28% and 27%, respectively) was due to the merger process.
5.5.9. Value Creation
In order to estimate total value created to ACS Shareholders with the merger, we need to have in mind the following: total merger costs, total stock performance during the merger (both of ACS and Dragados) and synergies arising from full integration, as set below:
Table 10 – Value Creation – ACS Point of View
Premium @ acquisition of 23,5% by ACS -303 Premium @ acquisition of 9,9% by ACS -102
Premium @ day of merger -29
Total Merger Premiums -434
Dragados 23,5% price increase
(20% * Dragados acquisition price * Nº shares acquired) 113 Dragados 9,9% price increase
(20% * Dragados acquisition price * Nº shares acquired) 48 ACS price increase
(20% * ACS closing price as of first acquisition * 374 * Total Nº shares of ACS )
Total Stock Performances due to Merger 536
ACS valuation pre-merger (@ EUR 37,1) -4,407
New ACS DCF valuation pos-merger 6,380
Value of merger gains 1,973
Total economic value created with merger 2,075
Source: author calculations
Value creation - ACS point if view Million Euros
According to my estimations, and bearing in mind that stock performance due exclusive to the merger process is a rather open estimation, total economic value created to ACS Shareholders with the deal was up to EUR 2.000 millions. This result supports our initial expectation that the global price paid by ACS in the merger had a positive implicit value.
6. Market Reaction
In this Section, I validate if the market responded positively to the announcement of Santander Central Hispano 23.5% stake acquisition by ACS, as of April 19, 2002, allowing short term creation of value around both stocks, especially for the target company (Dragados).
6.1. Event Study
In order to assess this market response, I have calculated the abnormal return implicit in ACS and Dragados stock price variations of the day of the announcement, based on a sample of 250 observations of IBEX 35 and ACS / Dragados stock prices, starting on April 19, 2001 until April 19, 2002.
Our 250 observations allows us to calculate a correlation between Dragados and ACS stock price variations and IBEX 35 variations, and thus estimating what should have been the price variation of the two stocks, as of April 19, 2002, considering only the IBEX 35 variation of that day. Hence, abnormal return results from the difference between real stock price variation as of April 19, 2002 – Dragados stock price increased 22,71% and ACS stock price decreased 0,23%. – and stock price variation for the two stock based on IBEX 35 daily variation (see Appendix “ 9.8. Market Reaction ” for calculations and more detail).
Thus, I achieve an abnormal return -0,8% for ACS stock price and 22,1% for Dragados stock price, which supports our initial expectation that short term value creation was achieved, due to the market response to the deal, well above IBEX 35 average return at that period.
The positive market response was obtained only in Dragados stock performance, which makes sense from a speculative point of view, since ACS stockholders, at the time of the first acquisition (23,5%), could not anticipate if the final merger terms for the operation would represent effective value to them.