Evolutionary Engines
José Fornari
1, Adolfo Maia Jr.
2and Jônatas Manzolli
21Music Cognition Group, Music Department University of Jyväskylä,
PL 35(A), 40014 University of Jyväskylä (JYU) Jyväskylä - FINLAND
2Interdisciplinary Nucleus for Sound Communications (NICS) Rua da Reitoria, 165 - Cidade Universitária "Zeferino Vaz"
State University of Campinas (UNICAMP) Phone/Fax: +55 (19) 35217923
P.O. Box 6166, ZIP:13091-970 - Campinas - SP - BRAZIL {adolfo, jonatas}@nics.unicamp.br
Received 16 February 2008; accepted 05 July 2008
Abstract
Two implementations of an Evolutionary Sound Synthesis method using the Interaural Time Difference (ITD) and psychoacoustic descriptors are presented here as a way to develop criteria for fitness evaluation. We also explore a relationship between adaptive sound evolution and three soundscape characteristics: key-sounds, key-signals and sound-marks. Sonic Localization Field is defined using a sound attenuation factor and ITD azimuth angle, respectively (Ii, Li). These pairs are used to build Spatial Sound Genotypes (SSG) and they are extracted from a waveform population set. An explanation on how our model was initially written in MATLAB is followed by a recent Pure Data (Pd) implementation. It also elucidates the development and use of: parametric scores, a triplet of psychoacoustic descriptors and the correspondent graphical user interface.
Keywords: sound synthesis, artificial evolution, genetic algorithms, sonic spatialization, acoustic descriptors.
1.
I
NTRODUCTIONWe first applied evolutionary techniques to algorithmic composition [8] and to a technique suited for composing highly textured music [9]. We also developed an Evolutionary Sound Synthesis (ESSynth) methodology [10]. Differently from others, our approach focused on the direct manipulation of waveforms. We defined crossover and mutation genetic operators to blend and distort segments of waveforms, respectively. Further, we introduced applications of artificial immune system for timbre design [13].
This article focuses on our latest studies incorporating spatial information in waveform genotypes [11,12]. We also discuss key theoretical concepts and relate them with the implemented system. Our research is based on applying concepts from the theory of complex adaptive systems [14] to sound design.
The following section presents a theoretical model based on integrating sound design with adaptive evolution. Afterward, two implementations are described:
a) MATLAB implementation that tests the sonic implications of the mathematical model presented in Section 3;
b) An ongoing Pd implementation that extends the mathematical model adding psychoacoustic descriptors and logic operators to emulate gender and sexual reproduction.
2.
B
ACKGROUND2.1.ADAPTIVE EVOLUTION
We start this section with the idea that sonic spatialization can be seen as complex adaptive systems (CAS). Emergent and macroscopic properties [14] arise from competition and cooperation within a CAS. The large-scale system behavior results from a large number of interactions made by many individuals or elements. Along time, the large number of interconnected parameters, altogether, exhibits a coherent emergent pattern.
Sonic spatialization can involve a large amount of loudspeakers, signals, acoustic cues, damping and reflections, among others. A good spatialization system has to be able to integrate all these features and handle them with a simple interface that allows the user to use a small number of parameters to control the whole system. Starting from these ideas, we developed our spatialization model to control a waveform population set. Our goal was to apply evolutionary strategies to generate emergent patterns in sonic domain. We connected these concepts in the following assumptions:
a) Target Sets will guide an evolutionary computation process based on Interaural Time Differences (ITD);
b) sonic spatialization is represented by a Sound Localization Field;
c) spatial similarities are measured by a Fitness procedure once every Iterative Evolutionary Cycle (as following described);
d) adaptation between Target Sets and the Population Set is an evolutionary process controlled by genetic operators.
2.2.INTERACTIVE SOUND SPATIALIZATION
Sound spatialization has been studied for decades [15-22]. Recently, Interactive Sound Spatialization (ISS) has been applied in hypermedia environments to develop an interactive and integrated control of several sonic features for multi-user application [18]. ISS has been applied in the context of helping people with special needs where it has been successfully used in education and rehabilitation of certain cognitive disabilities [19].
In this article we present an implementation of a sound synthesis system that takes ISS from the perspective of adaptive evolution. Since the use of adaptive evolution produces emergent and macro structure properties, we understand that the sonic result of our system, as a dynamical soundscape and as our goal, is to show how effective is this model to generate interesting sonic results.
Psychoacoustic factors can be seen as sonic cues that allow any listener to perceive and recognize a particular sound [20]. In experiments involving sound perception, it is common to take into consideration only the classical psychoacoustic factors, such as: loudness (perception of sound intensity), pitch (perception of sound fundamental frequency) and spectrum (perception of partials composition in the frequency domain), whereas it is often disregarded the importance of sound spatial positioning perception (SSPP).
However, SSPP turns to be very meaningful when we are in a space with several sound sources located in different places (ex: in a concert hall, watching a symphonic orchestra). SSPP can deliver important information not just of aesthetical meaning, but also concerning our own safety (ex: driving a car or crossing a traffic road). SSPP is given by three types of hearing cues:
a) Interaural Time differences (ITD) [20];
b) Interaural Level Differences (ILD) [21];
c) Head-Related Transfer Functions (HRTF) [22].
ITD, ILD and also taking into account the effects of the shape of listener's head, outer ears and torso. For that reason, HRTFs, differently than ITDs and ILDs, vary from person to person. ITD was used for robotic sound source localization and cross-correlation [23]. In principle, any of these spatialization functions can be used as part of the individual genotype (the waveform) belonging to a population.
2.3.SOUNDSCAPE
Schafer [24] describes soundscapes as natural, self-organizing processes usually resultants of an immense quantity of sound sources, correlated or not, but that conveys unique audible experiences that are at the same time recognizable and yet always original (as they actually never repeat themselves). It is not difficult to relate these features with those belonging to complex adaptive system (CAS), as mentioned previously. Soundscape composition can therefore aim to computationally emulate self-organized biological or natural acoustic environments [25].
Starting from the three main soundscape characteristics, defined in [24]: key-sounds, key-signals and sound-marks, we developed a system to generate sound-marks using two immersive concepts: Sonic Localization Field and Spatial Similarity. We used ITD cues to generate trajectories of evolutionary sound-marks. This evolution is controlled by spatial sound genotypes related with two parameters: sound intensity and ITD azimuth angle. Genetic operators are used to create new generations of sound populations, based on their spatial localization. Having the overall process running, it is possible to obtain a continuous audio stream resembling a soundscape.
3.
M
ODEL FORA
DAPTIVES
PATIALIZATION3.1. ITD CUES
As previously described, the ITD refers to the mechanism in which the human brain associates the binaural hearing time difference with the location of sound sources. For example, if both ears simultaneously hear a sound, the source is interpreted to be either directly in front or behind the listener. If there is a time delay of perception between ears, then the source will be perceived as coming in a horizontal angle closer to the ear that receives its sound first. These time delays are therefore significant in the localization of sound and can be easily emulated by a computational algorithm.
3.2. SOUND-MARKS IN SONIC LOCALIZATION FIELD
From the mathematical point of view our model consists of a space of triplets G={(W, I, L)}, named
Genotype Space, where 0≤ I≤1 is the waveform intensity factor and -1≤ L≤1 is the waveform ITD localization factor, given by the azimuth angle θ, where L = (90o – θ)/ 90o and 0o≤ θ ≤ 180o. For more details, see [12].
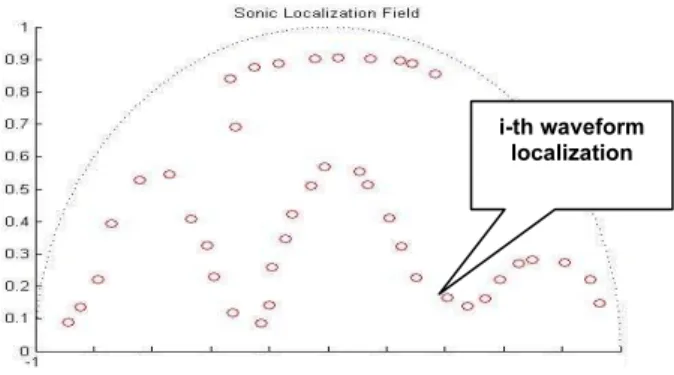
The set of all possible values of the pair (I,L) is named Sonic Localization Field (SLF). In our model it is a semicircle as shown in Fig. 1, the listener is located at the pair (0,0) and the pair (1,0) is associated with the sound of greatest intensity and it is located in front of the listener. It is possible to generalize the SLF to other geometries rather than a semi-circle. Each choice will impose limitations on the possible pairs (I,L) and possibly also including the distance between the listener and the source producing the waveform. It is interesting to mention that SLF with maximal area is the rectangle [-1,1]x[0,1] which include all directions and all intensity factors. Spatial dispersion in the SLF is characterized by the distribution of a finite set of pairs S = (I, L), as shown in Figure 1. Although our model is a two-dimensional one, the ITD localization factor can be generalized in a tri-dimensional vector L=(θ,φ,r), in spherical coordinates.
We define as population any finite subset of elements of G. In our model we start with an initial population P(0) and a target population T. Then we iteratively construct a sequence of r generations of the initial population, given by: G(1), G(2),…, G(r), where the k-th population is a subset of G with N individuals (elements) G(k)={G1(k),G2(k),…,GN(k)} and the individuals are given by triplets Gi(k) = ( Wi(k), Ii(k), Li(k)). The Target set has M individuals T= {t1, t2,…,tM} with the j-th individual given by tj = ( Wj ,Ij ,Lj). Spatial dispersion in the SLF is characterized by the distribution of the pairs set Si = (Ii, Li) as shown in figure 1. These pairs, in which Genetic Operators are applied, are named as Spatial Sound Genotypes (SSG). The Target Set T = {Tk = (Ik, Lk), for k=1,…,M} can, in principle, be generated by several gestural, or haptic, controllers associated with the position and motion of the user/musician in the space. This allows perceptual impressions to interactively guide the evolutionary process of sonic spatial distribution. Since G(k) and T are subsets of G, we define the distance between these two sets as following below:
B
L
L
A
I
I
T
G
d
j k i j k i k ij−
+
−
=
) ( ) ( ) (4
1
2
1
)
,
(
(1)dk = d(G(k), T) = j i,
min
d
(
G
(k),
T
)
ij (2)
for i=1,…,N and j=1,2,…, M. Observe that this distance function takes into account only two parameters of SSG. The best individual in the k-th population G(k), Gi*(k) = (Wi*(k), Ii*(k), Li*(k)) is that one that has the smallest distance dk. This new individual (considered to be the optimal one) is used in the Evolutionary Cycle, presented in Fig. 3, section 4.
In order to control the sonic output we use the distance function above to define Spatial ε-Similarity as follows:
Given two individuals of a population Gi(k), Gj(k) with i≠j, they are ε-similar if dk( Gi(k), Gj(k)) ≤ε , where ε is an arbitrary small number and the distance dk is defined in equation (1).
3.3. GENETIC OPERATORS FOR SOUND SPATILIZATION
To control the sonic spatialization as an evolutionary process, we define two basic operations:
CROSSOVER
Given the best individual of the k-th generation Gi*(k) = (Wi*(k), Ii*(k) , Li*(k)) and the crossover rate α, with 0 ≤ α ≤ 1, individuals in the population will be renewed by changing the values of their parameters as follows:
Ii(k+1) = α Ii*(k) + (1-α). Ii(k), and
Li(k+1) = α. Li*(k) + (1-α). Li(k)
for 1 ≤ i ≤ N, and k= 0,1,…, R.
whereRis the number of iterations.
(3)
MUTATION
Let H(k) to be a proper sub-set of the k-th generation G(k). A mutation operator with rates ß1, ß2 and
0 ≤ ß1, ß2 ≤ 1, is defined as follows:
Ii(k+1) = β1 . (rand) + (1-β1). Ii(k) and
Li(k+1) = β2 . (rand) + (1-β2). Li(k)
for 1 ≤ i ≤ Q, k=0,1,…, R
(4)
whereQ ≤ N is the number of individuals in H(k), R is the number of iterations, “rand” is a random value [0,1] and the rates β1 and β2 control the degree of randomness for this operation.
In our implementation, we have taken β1 = β2 for simplicity. The H(k) subset can be chosen of many different ways, our option was to fix a percentage and choose randomly, with a uniform distribution, individuals to be modified.
4.
M
ATLABI
MPLEMENTATIONThe first implementation of this system was done using MATLAB. In this one we have simulated the iterative evolutionary cycle (IEC) and the system interactive dataflow. The IEC consists of two main processes:
a) an evolutionary sound synthesis module, which applies the genetic operators that modify the waveform (see details in [10]);
b) an evolutionary spatial engine module, that applies crossover and mutation over the population set, as described in section 3.2.
For the interactive dataflow we simulate a user-interface that resembles the sonic localization field and we implemented also a parametric score in which the user controls the dynamic parameters changes.
4.1. WAVEFORM POPULATIONS
Starting upon waveform populations, we developed two procedures:
a) automatic segmentation of a stored sample;
b) random generation of a large population of sine waves with frequency and amplitude varying within a pre-defined range.
Samples were cut using a fixed time window presented in Table 1. Below we present our results for the sound material generated with a windows varying from 50 milliseconds to 2 seconds, thus testing the algorithm for micro and macro sound design.
4.2. EVOLUTIONARY ENGINE
The evolutionary engine is used to control the evolutionary sound trajectory of the system. The Evolutionary Sound Synthesis Engine has been presented in previous works [10] and we have modified it in order to use the distance defined in equation (2) for fitness evaluation. The Evolutionary Spatial Engine has
i-th waveform localization
also been described in [11,12] and uses genetic operators defined in equations (3) and (4).
4.3. USER-INTERFACE AND PARAMETRIC SCORE
The general idea of this system is to allow the user interaction in two ways: a) real-time interaction using any gestural device able to produce input for the Target Set that controls the fitness evaluation of the two evolutionary engines, and b) off-line interaction using a parametrical score in which the user controls the genetic operators rates, the region of the population that will be affected by them, the update time rate for each generation of the population and the delay in which new waveforms are sent to the output circular buffer.
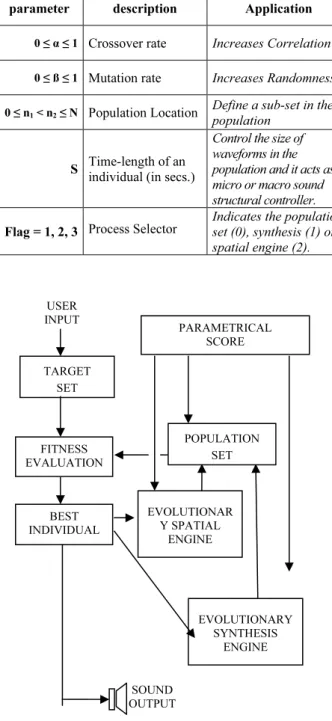
Figure 2. General diagram of the system dataflow.
The parametrical score is a text file with a sequence of lines as exemplified in Table 1. The idea is to let the user to design a general evolutionary behavior and use gestural controllers in real time to produce novelty. Since the population of individuals can be very large, we have used a parameter to control a selection of sub-sets in the population. We use two integer numbers n1 and n2 to define a
Population Segmentation Window (PSW) as the
subinterval [n1, n2] where 0 ≤ n1 < n2 ≤ N. Only the individuals belonging to the chosen PSW will be used in the IEC. In this way the parametrical score is used to give flexibility to the user to explore different regions within the sonic space.
4.4. ITERATIVE EVOLUTIONARY CYCLE
The whole iterative sound synthesis process is seen in Fig. 3. Here there are to main circuits:
a) off-line: controlled by the Parametrical Score;
b) on-line: controlled the user through a gestural controller to change the Target Set.
Both circuits are applied to the two evolutionary engines and the sound output is cyclically given by the best individual of each generation.
Table 1. Description of the Parametric Score.
parameter description Application
0 ≤ α ≤ 1 Crossover rate Increases Correlation
0 ≤ ß ≤ 1 Mutation rate Increases Randomness
0 ≤ n1 < n2 ≤ N Population Location Define a sub-set in the population
S Time-length of an
individual (in secs.)
Control the size of waveforms in the population and it acts as micro or macro sound structural controller.
Flag = 1, 2, 3 Process Selector
Indicates the population set (0), synthesis (1) or spatial engine (2).
Figure 3: Iterative Evolutionary Cycle
4.5. MATLAB RESULTS
The tested parameters and the parametric scores are presented in Table 2. Basically, we evaluated how the ITD cues work as part of the sound genotype and how the evolutionary synthesis method modifies the generated sound.
EVOLUTIONAR Y SPATIAL
ENGINE
EVOLUTIONARY SYNTHESIS
ENGINE FITNESS
EVALUATION TARGET
SET
SOUND OUTPUT USER
INPUT
POPULATION SET
BEST INDIVIDUAL
PARAMETRICAL SCORE SCORE Evolutionary
ENGINES
REAL-TIME INTERACTION
Table 2. Score used on Sound Example.
0, 0, 25, 30 0, 1, .5, .0
time, flags, alfa, beta,
0, 2, .2, .3 0, 2, .2, .3 0, 2, .2, .3 0, 2, .0, .0
time [secs]
flags= (File,Synth, Location)
alfa= crossover rate [0,1]
beta= mutation rate [0,1]
0, 6, .0, .0
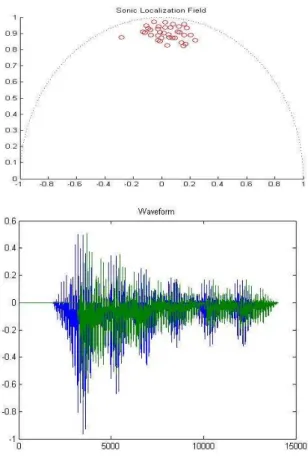
We present below, in Fig. 4 (top) a graphic result of a population generated using a sound sample of a Portuguese-spoken phrase. Depending upon the size of the time-length (S) the number of waveforms varied from dozens to thousands (see Table 1). In Fig. 4 (bottom) we show a sound example generated with a population with time-length of 0.2 seconds.
Figure 4: Sound Localization Field used to generate the sound example (top); resultant waveform (bottom).
We implemented the Evolutionary Sound Synthesis method as it was presented in [10]. This one modifies the population according to the fitness evaluation using the distance given by the equation (2). We used the notion of proximity in the sonic localization field to change also the shape of the waveforms in the population. This approach has proved to be efficient for
interactive applications because the user will have the best modified sound as it is located and perceived by ITD cues. It is simple to implement the equation (1) using MATLAB and the processing involved is not computationally expensive, what make us expect that the interactive real-time implementation is feasible.
5. P
URED
ATA(P
D)
I
MPLEMENTATIONAmong several aspects, we came to the conclusion that it was necessary to incorporate new extensions in our method. In order to control more complex sound structures, new genetic algorithms were developed to extend our method in the following directions:
a) Implement demographic variation based on the idea that individuals have a finite lifetime and so the population size varies in time.
b) Implement gender and sexual reproduction in order to get genetic dominance and recessivity.
c) Implement genotypes dependency on territorial spreading so the individuals have geographic characteristics.
So, given the extended orientation of the biological evolution model, the ongoing implementation presented in this section has a more complex generative engine and then the sound synthesis method turns out to be more appropriate for soundscape design.
5.1. SOUND PERCEPTION DESCRIPTORS
(maximum or clear presence of that sound feature). Following below are their definitions:
Onsetness is the quantity of attack (onset) present in the sound, in such a way that when onsetness is close to zero there is no perceptual attack, such as sounds played by bowed strings. In the same way, onsetness close to 1 represents pure attack such as a snapping sound, or a pulse.
Pitchnessrepresents the degree of perceived pitch in a sound. Noisy sounds, that do not present any definite perceptual pitch, have zero pitchness. The purely melodic ones, as musical tone from a melodic instrument, without any presence of noise (like the sound of a tuning fork) have pitchness near to the unit.
Loudness determines the degree of perceptible sonic intensity. It is important to emphasize that loudness is not only related to the intensity of a sound signal, but also with its attack, the frequency of its fundamental partial and also its spectral distribution.
Using four parameters (onsetness, pitchness, loudness, sound location) we implemented an elitist selection process, which can be formally described as follows:
Let x=(x1, x2,…,xn) a vector of parameters and define a threshold vector t=(t1, t2,…,tn). Now the user chooses a subset of the threshold vector. An individual only passes to the next population generation if its parameters are bounded by the threshold correspondent to the chosen subset. All other coordinates are not taken into account. Any individual that not satisfies these boundaries is discharged. In our current implementation n=4. For example, if the onsetness has a threshold limit α=0,5 then all individuals in the population with onsetness higher than 0,5, will not be part of the next generation. In addition, reproduction is determined by four factors. The first two are represented in the individual genotype: spatial location and gender. For computational simplicity they are represented in a text file where: I (intensity) and L (azimuth angle, between 0° and 180°) runs on the intervals I = [0,1] and L = [-1,1] as defined in section 3.2. Also we defined gender as follows: m (male), f (female), s (sterile) and b (both). In our model we choose the following reproduction rules:
m & f
⇒
m | f | b
[m | f | b] & b
⇒
s
where “⇒” is equivalent to logic implication; the operation x & y is equivalent to reproduction between x and y, and “| “ is equivalent to the logic connector “or”. Observe that reproduction with gender “b” generates always sterile individuals.
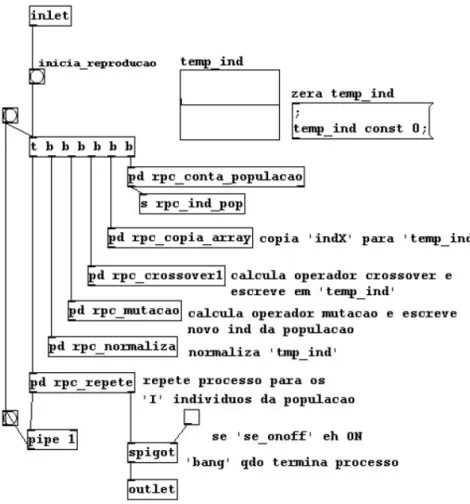
5.2. REPRODUCTION CYCLE
The sound output was expanded. Instead of using only the best individual of each generation, the output was controlled by two parameters: m (better, or nearby the aim) and p (worse, or distant from the aim) varying in the interval [0,1] describing percentage of individuals in the population. For example, m=0.3 corresponds to an output of 30% the population ordered from best to worst. It notices that for m=1.0 is equivalent to p=1; and m=0 is equal to previous implementation output, i.e., only the best individual. The graphic interface of implementation “se01.pd” is showed in Fig. 5 below.
Figure 5: Pd Interface of “se01.pd” implementation.
limitations, and to go beyond the topic of this work, the sub-patches related to this structure, as well as other patches related to this implementation are not being depicted here.
5.3. PARAMETRIC CONTROL SCORE
For soundscape composition, the control of Evolutionary Synthesis includes the genotype text file and also a parametric score in order to schedule in time the instructions. This time process is also controlled by continuous parameters such as rates of crossover and mutation and rate of population proliferation. This can
also be controlled by the user, through changing dynamically the individuals within the Target Set.
The implemented parametric score has all initial information and command lines organized in a Text File. Table 3 below is an example of a typical parametric score. Genotypes are also written in text files. It follows the Pd standard object "textfile", where each line is ended by a semicolon ";". First line of a genotype text file specifies individual spatial location. This is related to the parameters I = [0,1], and L = [-1,1], presented in section 3.2. A typical example is shown in Figure 7.
Figure 6: Pd code of the Reproduction Cycle.
location 1 -1; lifespam 0; gender m;
onsetness d .5 r .5; loudness d .1 r .9; pitchness d .9 r .1;
Figure 7. Left: Genotype Text File. Right: Equivalent Location
0
°
180
°
I
A
Table 3: An example of parametric score.
The second line in the genotype file determines the "time of life" (lifespan) of an individual, given in seconds. When this time is reached, the individual is eliminated from the population. To represent "immortal" individuals a "zero" value must be assigned. The third line determines individual gender: m (male), f (female), b (both), s (sterile). The next three lines determine which sound descriptors will be presented. This representation leads to a diploid individual for which the concept of dominance and recessivity is conveyed. Each line has the value of a given dominant named by “d”, followed by its numerical value (between [0,1]). Following these two parameters, a recessive gene is described by “r”, followed by its value also normalized. The concept of inheritance and phenotypic characterization are inspired in Mendel’s genetic theory.
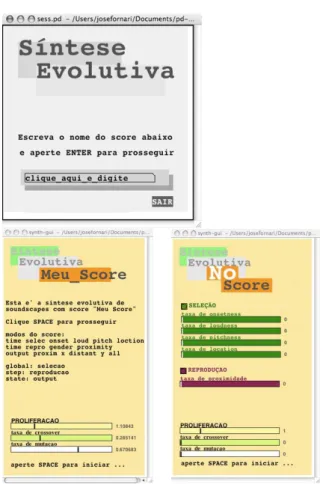
5.3.GRAPHIC INTERFACE
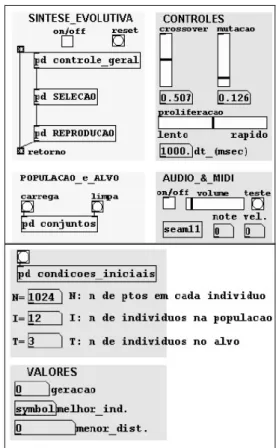
The main graphic interfaces are presented in Figure 7 (top). The user is asked to input the score name to be used in the evolutionary synthesis process. After typing the score name, a new window appears, with the score title and other parameters (fig.7 bottom left). If no name is typed, the system interprets that as the user wish to perform the processing without a score (fig.7 bottom right) where the user will be granted with access to further parameters that can also be modified while the processing is running.
The whole algorithm is enclosed in a Pd subpatch underneath the main canvas shown in Figure 7. It is called "init" subpatch in the following figure.
Figure 7: Main window (top). Window where score is presented (bottom left) window where score is not presented
(bottom right).
Title ParteTeste;
instructions
Esta eh a sintese evolutiva de \\ soundscapes com score ParteTeste\\ \\
Clique SPACE para prosseguir\\ \\
modos do score: \\
time select onset loud pitch location \\ time repro gender proximity\\
output proximity to x distant y all\\ \\
global: selection\\ step: reproduction\\ state: output\\ ;
num-pop 7; num-alvo 3; proli .5; cros .5; mut .1;
00 sel .5 .5 .5 .5; 00 rep .5;
00 out p 1; 01 out p 5; 05 out l 1; 06 out a; 10 rep 0.1;
Title: score.
Instructions: instructions that appears as a comment in a window.
Num-pop: initial number of individuals in a population.
Num-alvo: initial number of individuals in the target set.
Proli: initial value of proliferation.
Cros: initial value of crossover rate.
Mut: initial value of mutation rate.
Follows command lines ended by symbol “;”. These are ordered as follows:
Time: time delay for run the line in seconds.
Mode: mode of operation described
Figure 8: Pd subpatch “init”.
As presented, four other subpatches compose this subpatch. The subpatch "choose-who" is automatically executed at the beginning of the entire process, by the "loadbang" box. The next figure shows inside the "choose-who" subpatch.
Figure 9: Subpatch “choose-who”.
This one sets the initial conditions to start a new process of evolutionary synthesis. In its turn, “choose-who” also has two other subpatches: “first-things-first” and “trig-key-enter”.
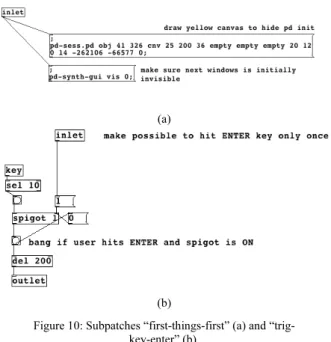
When it receives the "loadbang" command, "choose-who" executes a queue of three operations to create the initial windows, as seen in Figure 7. The first subpatch executed is "first-things-first" that draws the main canvas that hides the subpatch "init". Next, it writes the phrase in Portuguese "clique_aqui_e_digite" (meaning "click_here_and_type") inside the text box, to inform the user where to write the name of its score (if any). This is done because Pd has frugal graphics capabilities and one of its limitations is that, when the user clicks the text box to start typing, there is no visual signal to inform the user that the text box was selected and ready to receive the typing, what may mislead the first-time user. Finally, "choose-who" executes "trig-key-enter" that allows the main window to be susceptible, only once, to the ENTER key.
As the user hits this key, two things happen; first, it makes the second window visible (as shown in Figure 7 bottom), and then writes the score name, as typed by the user, through the variable "score-name". Note that "synth-gui" window will have its visual aspect slightly different if no score was selected. In the same figure, it is depicted the "trig-key-enter" subpatch showing the strategy used to let the system to be sensible the ENTER key only the first time that the user hits it.
(a)
(b)
Figure 10: Subpatches “first-things-first” (a) and “trig-key-enter” (b).
Next figure shows the subpatch "read-score" (subpatch of "init", as seen in Figure 8). It is responsible to check whether or not a score was selected. If so, this one reads a sequence of control parameters to start the evolutionary process according to the chosen score.
Figure 11: Subpatch “read-score”.
Figure 12: Subpatch “no-score”.
The subpatch “read-score”, depicted by Figure 11, receives the score name, by the variable “score-name”. This variable is initially storing the symbol “clique_aqui_e_digite” given by the subpatch “choose-who” (Figure 9). The object “textfile” in “read-score” attempts to read the score name, in a text file. If there is no text file selected by the user, “textfile” sends a “bang” message in its rightmost outlet, which is sent to “no-score” (Figure 12). If there is a score selected, “textfile” sends a “bang” through its leftmost outlet that activates the subpatch “read-header”, shown in the next figure.
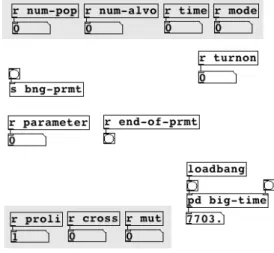
Figure 13: Subpatch “read-header”.
This subpatch reads the initial values for the synthesis process, such as: title, instructions, num-pop (initial population size) and num-alvo (initial target size). All files must be within the same folder, the main patch “se.pd”, the score text file, the and two folders: “pop” (with all wave files for the population individuals) and “alvo” (with all wave files for the target individuals). These folders also have their individual genotypes, which are text files. For convenience, individuals wave files and their genotypes text files are named as sequential numbers (e.g. 1.wav, 1.txt; 2.wav, 2.txt, etc.).
Similarly to "trig-key-enter" (Figure 10b), the subpatch "trig-key-space" receives only the first hit of SPACE key, to start the synthesis process and to draw a
canvas with the current value of the command line read in score text file. This is shown in the next figure.
Figure 14: Subpatch “trig-key-space”.
The next figure shows the subpatch “read-score-line”, subpatch of “read-score, shown in Figure 11. This one receives from “textfile” object the values read in the score text file lines.
Figure 15: Subpatch “read-score-line”.
This one first writes the values read in the score line to "rcvline" and interpret each command within the line through the "read-line" that reads first the time and mode of execution, as seen in Table 3. The following operations are standard of the evolutionary synthesis process, as described in 3 and thoroughly described in [11] and similar to the Matlab implementation described in 4. This is done by the subpatch "engine", shown in the following figure.
The major difference is the subpatch “big-time” that is in charge of the global time for the entire process. This one is depicted in the next figure.
Figure 17: Subpatch “big-time”.
6. D
ISCUSSION ANDC
ONCLUSIONWe presented here a mathematical model, a MATLAB and a Pure Data implementation of an evolutionary soundscape design system. We reviewed some applications of sonic spatialization and introduced the concept of adaptive evolution based on the theory of complex adaptive system.
The two implementations presented here are related to recent studies in which we incorporated spatial information in the sound genotype [11-12] and our results shown that the model is feasible.
In the MATLAB implementation we tested the controlling parameters using parametric scores and a simulation of the sound localization field. In the Pd implementation, although still in progress, it already allowed us to test new approaches for fitness evaluation such as the psychoacoustic descriptors. It is also possible to explore later the Interaural Level Differences (ILD). In this case, the usage of ITD and ILD will provide the localization cue of “near and far”. Also, the usage of reverb will provide extra psychoacoustic cues to better interact with the user.
The psychoacoustic descriptors used in the genotype of individuals seem to perform well as an efficient alternative to describe basic (low-level) aspects of the sound perception. In further developments, we plan to extend the method to also include high-level descriptors that convey contextual information of musical content and therefore can be used as an aesthetical measurement of fitness in an attempt to describe some principles of the human cognition, as it interprets the dynamic aspects of musical emotion.
New usages for soundscape design presented here can be thought and computationally implemented for sonification as well for compositional purposes. This we hope to be realized in the future getting feedback from users by releasing the software for free use in the internet.
Soundscape Design has a utilitarian side as to generate and control sound outputs for specific purposes such as sonification of rooms, stadiums, etc. This include, in addition to the kind of activity realized in the work place, the architecture, or the geometry of that ambient. In general this is thought as a background sound that does not disturb the attention of people in their work place. So the design, in this case, has a technical limitation of the intensity. In our model this is easily controlled restricting the values of the Intensity Factor I to small values, does not matter the location factor L.
Another issue which our model can handle is related to the creative side which will determine, in certain sense, soundscape composition under an artistic perspective. Roughly speaking we may say that most of the sound content of a soundscape is concentrated in its constitutive waveforms and how they are modified along time. In our model sonic gestures are provided by the choice of Target Set T and the Initial Population P(0). In this way, spatialization is, although very important, nothing more than a sound effect. For sonification of ambient, it is not necessary, nor desirable, great or fast changes of the sound characteristics. In our model this is obtained choosing the target set and the initial population with their own individuals being ε-similar as defined above in section 3.2 with ε a small number which can be modified ad libitum by the user.
In addition soundscape design can be thought as a compositional tool for a multimedia sound work, mixed music with electronics, or yet to purely electroacoustic music. Now spatialization, although yet an effect, has a more complex aesthetic value since it is now part of composition itself. Here we think the end-user composer can use the Sound Location Field of our model as a important compositional tool. For example, he/she can correlate the spatial position and intensity of sounds simply restricting the values of the mutation rates β1 and
β2 to sub intervals of [0, 1] or yet making these mutations rates become dependent of the crossover rate. In certain sense these choices are nothing more than composition rules, pretty the same in spirit as for the rules of harmony of the tonal system.
strategies. It will lead us to a forthcoming work about new music interfaces, adaptive strategies and composition. We already discussed this issue concerning to composition and improvisation in recent work [29]. In a piece named continuaMENTE, percussion improvisation provides input to a computer system that in turn adapted the sonic output to the real time changes produced by musicians. It is certainly interesting to enlarge the notion of composition and performance by bio-inspired adaptive computer systems.
A
CKNOWLEDGMENTSWe thank to the Brazilian Agencies CNPq that financially supports Manzolli and Maia and FAPESP that financially supported Fornari.
R
EFERENCES[1] T. Bäck, Evolutionary Algorithms in Theory and Practice: Evolution Strategies, Evolutionary Programming, Genetic Algorithms,Oxford Univ. Press. 1996.
[2] S. Todd and W. Latham. Evolutionary Art and Computers. Academic Press, 1992.
[3] D. E. Goldberg. The Race, the Hurdle, and the Sweet Spot: Lessons from Genetic Algorithms for the Automation of Design Innovation and Creativity. In: Evolutionary Design by Computers, Bentley, P. (ed.), Morgan Kaufmann Publisher, San Francisco, pages 105-118, 1999.
[4] J.A. Biles, Gen Jam: A Genetic Algorithm for Generating Jazz Solos. In Proceedings of the 1994 International Computer Music Conference, (ICMC94), pages 131-137, 1994. http://www.it.rit.edu/~jab/GenJam.html, Jan. 2008.
[5] E. R. Miranda, On the evolution of music in a society of self-taught digital creatures. Digital Creativity, 14:1:29-42, 2003.
[6] T.J. Mitchell and A.G. Pipe. Convergence Synthesis of Dynamic Frequency Modulation Tones Using an Evolution Strategy. In Applications on Evolutionary Computing, Springer Verlag, Berlin, EvoMusart Conference, Computer Lectures Vol. 3449:533-538, 2005.
[7] J. McDermott, N. J.L. Griffith and Michael O´Neill. Evolutionary Computation Applied to Sound Synthesis. In The Art of Artificial Evolution, J. Romero and P. Machado (eds.), Springer Verlag, Berlin, Natural Computing Series, ISSN 1619-7127, pages 81-101, 2008.
[8] A. Moroni, J. Manzolli, F. von Zuben, R. Gudwin. Vox Populi: An Interactive Evolutionary System for Algorithmic Music Composition. Leonardo Music Journal, San Francisco,USA, MIT Press, Vol. 10:49-54, 2000.
[9] S. Fels and J. Manzolli. Interactive, Evolutionary Textured Sound Composition. In Proceedings of the 6th Eurographics Workshop on Multimedia, pages 153-164, 2001.
[10] J. Manzolli, J. E. Fornari, A. Maia Jr. and F. Damiani. The Evolutionary Sound Synthesis Method. In Proceedings of the ACM Multimedia Conference, page 585-587, ISBN:1-58113-394-4. USA, 2001.
[11] J. Fornari, A Maia Jr., J. Manzolli. Creating Soundscapes using Evolutionary Spatial Control. In Applications of Evolutionary Computing, Lectures in Computer Science, Springer-Verlag Berlin/Heidelberg, Vol. 4448:517-526, 2007.
[12] J. Fornari, A. Maia Jr., J. Manzolli. Interactive Soundscape Design with Evolutionary Sound. In Proceedings of the 2007 International Computer
Music Conference (ICMC 2007), Copenhagen,
Denmark, pages 427-430, 2007.
[13] M. Caetano., J. Manzolli, and F. J. von Zuben, Application of an Artificial Immune System in a Compositional Timbre Design Technique. In C. Jacob et al. (eds.): ICARIS 2005, Lecture Notes in Computer Science 3627, pages 389-403, 2005.
[14] Holland, J. H. Adaptation in Natural and Artificial Systems. University of Michigan Press, 1975.
[15] J. Blauert. Spatial hearing: the psychophysics of human sound localization. Cambridge: MIT Press, 1997.
[16] V. Pulkki, Virtual sound source positioning using vector base amplitude panning. Journal of the Audio Engineering Society, Vol. 45:456-66, 1997.
[17] J. M. Chowning. The simulation of moving sound sources. In Proceedings of the Audio Engineering Society 39th Convention, New York, NY, USA, 19:1: 2-6, Jan. 1971.
[18] M. Cohen, J. Herder and W. L. Martens. Cyberspatial Audio Technology. J. Acous. Soc. Jap., 20:6:389-395, Nov. 1999.
Springer-Verlag Berlin /Heidelberg, Vol. 3118: 1054-1061, 2004.
[20] J. B. Kelly and D. P. Phillips. Coding of Interaural time differences of transients in auditory cortex of Rattus norvegicus: Implications for the evolution of mammalian sound localization. Hearing Research, 55:1:39-44. 1991.
[21] S.T. Birchfield, S.T. and R. Gangishetty. Acoustic Localization by Interaural Level Difference. In Proceedings of IEEE International Conference on Acoustics, Speech, and Signal Processing (ICASSP), Philadelphia, Pennsylvania, Vol.
4:1109-1112, D.O.I. 10.1109/ICASSP.2005.1416207, 2005.
[22] D. S. Brungart and W. M. Rabinowitz. Auditory localization of nearby sources. Head-related transfer functions. The Journal of the Acoustical Society of America, 106:3:1465-1479, Sept. 1999.
[23] J. Murray, S. Wermter, H. Erwin. Auditory robotic tracking of sound sources using hybrid cross-correlation and recurrent networks. In Proceedings of the IEEE/RSJ Intelligent Robots and Systems (IROS 2005), pages 3554-3559 D. O. I. 10.1109/IROS.2005.1545093, 2005.
[24] R. Murray Schafer. The Soundscape. ISBN 0-89281-455-1, 1977.
[25] B. Truax. Handbook for Acoustic Ecology. ISBN 0-88985-011-9, 1978.
[26] M. Leman, V. Vermeulen, L. de Voogdt, D. Moelants, D., & Lesaffre, M. Correlation of Gestural Musical Audio Cues. In Proceedings of Gesture-Based Communication in Human-Computer Interaction: 5th International Gesture Workshop, GW 2003, pages 40-54, 2004.
[27] Dahlsteds, P. Evolution in Creative Sound Design. In Evolutionary Computer Music, (ed.) E.R. Miranda & J.L. Biles, Springer-Verlag London, pages 79-99, 2007.
[28] L. H. H. Law, S. Phon-Amnuaisuk. Towards Music Fitness Evaluation with the Hierarchical SOM. In Applications of Evolutionary Computing, LNCS, Springer Berlin, Vol. 4974/2008, pages 443-452, 2008.