Positive Mental Health Scale: Validation of the
Mental Health Continuum – Short Form
Wagner de Lara Machado – Pontifícia Universidade Católica de Campinas, Campinas, São Paulo, BrasilDenise Ruschel Bandeira – Universidade Federal do Rio Grande do Sul, Porto Alegre, Brasil
Abstract
The Mental Health Continuum – Short Form (MHC-SF) is a self-reporting instrument for assessing positive mental health, which is understood as symptoms of positive affection, self-development and social connectivity. The present article describes the adap-tation and validation of the MHC-SF for the Brazilian Portuguese language in a sample of 686 adults, which included 72.7% female participants and had an average age of 33.9 (SD = 11.30) years. The various methods employed to assess the MHC-SF psychometric properties (principal component analysis, factor analysis, Item Response Theory and network analysis) indicated that a unidimensional structure is suficient to represent the structure of the instrument and its high reliability. In addition, the results showed that the individual-centered aspects of mental health are more easily manifested relative to the social-oriented aspects. The Brazilian version of the MHC-SF is a valid and reliable instrument for the assessment of positive mental health. Keywords: Mental health, well-being, exploratory factor analysis, Item Response Theory, network analysis.
Escala de Saúde Mental Positiva: Validação da Mental Health Continuum – Short Form
Resumo
O Mental Health Continuum – Short Form (MHC-SF) é um instrumento de autorrelato para avaliação da saúde mental positiva, entendida como sintomas de afetos positivos, autodesenvolvimento e conexão social. O presente artigo apresenta a adaptação e validação deste instrumento para o Português brasileiro, uma amostra de 686 adultos, sendo 72.7% mulheres e média de idade de 33.9 (SD = 11.30) anos. Diversos métodos empregados para estimar as propriedades psicométricas do instrumento (com-ponentes principais, análise fatorial, Teoria de Resposta ao Item, análise de rede) indicaram que uma estrutura unidimensional é suiciente para representar a estrutura do instrumento e sua alta idedignidade. Ainda, evidenciou-se que os aspectos da saúde mental centrados na pessoa são mais facilmente manifestos em relação àqueles de orientação social. O MHC-SF em sua versão brasileira é um instrumento válido e idedigno para avaliação da saúde mental positiva.
Palavras-chave: Saúde mental, bem-estar, análise fatorial exploratória, Teoria de Resposta ao Item, análise de rede.
Escala de Salud Mental Positiva: Validación de la Mental Health Continuum – Short Form
Resumen
La Mental Health Continuum – Short Form (MHC-SF) es un instrumento de auto relato para evaluar la salud mental positiva, que se entiende como síntomas de afecto positivo, de desarrollo personal y contexto social. El presente artículo describe la adaptación y validación del instrumento para el idioma portugués de Brasil en una muestra de 686 adultos, siendo 72.7% mujeres con edad media de 33.9 (SD = 11,3) años. Diversos métodos empleados para estimar las propiedades psicométricas del MHC-SF (análisis de componentes principales, análisis factorial, Teoría de Respuesta al Ítem y análisis de redes) indicaron que una estructura unidimensional es suiciente para representar la estructura del instrumento y su alta iabilidad. Además, los resultados mostra -ron que los aspectos de salud mental centrados en el individuo son más fácilmente manifestados en relación a los aspectos de orientación social. La versión brasileña del MHC-SF es un instrumento válido y idedigno para la evaluación de la salud mental positiva.
Palabras clave: Salud mental, bienestar, análisis factorial exploratorio, Teoría de Respuesta al Ítem, análisis de redes.
According to the deinition formulated by the
World Health Organization, mental health is not only characterized as the absence of mental disorders but also as “a state of well-being in which each individual realizes his or her own potential, can cope with the nor-mal stresses of life, and is able to make a contribution to her or his community” (World Health Organization, 2005, p. 12). In other words, mental health includes positive components, and this perspective was devel-oped as a two continua model (Keyes, 2002). The positive dimension of mental health was operational-ized by Keyes (2002, 2007; Keyes & Lopez, 2002) as
a hierarchical model with 3 interrelated second-order factors (emotional or subjective, psychological, and
social well-being) and 13 irst-order factors, which are
described below (Diener, 1984; Gurin, Veroff, & Feld, 1960; Jahoda, 1958; Keyes, 1998; Ryff, 1989).
According to Keyes (2006), the irst attempt at
systematizing the notion of positive mental health is
attributed to the Austrian psychologist Marie Jahoda
(1958) in her book entitled “Current Concepts of Positive Mental Health.” Based on a review of the literature on personality theory and clinical psychology available at
mental health: self-acceptance, personal growth or self-actualization, integration of the self, autonomy, preserved perception of reality and environmental mastery. Soon afterward in 1960, Gurin, Veroff and Feld published a report on the mental health of citizens of the United States (“Americans view their mental health”), in which they used indicators of happiness and satisfac-tion with domains of life (work, family, leisure, etc.).
The studies by Jahoda (1958) and Gurin et al.
(1960) produced two complementary ields of study of
positive mental health: psychological well-being, which was developed by Ryff (1989), and subjective (or emo-tional) well-being, which was systematized by Diener (1984). Psychological well-being, which is based on the studies by Jahoda, emphasizes the development of
deinite individual potentialities or evolutionary tasks
that occur along with development, such as possessing a positive attitude toward the self and accepting mul-tiple aspects of one’s own personality (self-acceptance); having warm, safe, intimate and satisfying relation-ships with others (positive relations with others); being self-determining and independent; assessing personal experiences by personal standards (autonomy); having a sense of mastery and competence in managing the environment to satisfy personal needs and values (envi-ronmental mastery); having a sense of directedness and aims and objectives for living (purpose in life); and having a feeling of continued development and open-ness to new experiences (personal growth) (Ryff, 1989). Subjective well-being, which is based on the studies by
Gurin et al., is deined as a set of phenomena, includ -ing emotional responses, life satisfaction domains (e.g., work, leisure, family, etc.) and global judgments on life satisfaction. Subjective well-being has three main com-ponents: life satisfaction, positive affect and negative affect. Therefore, an individual with high subjective
well-being is satisied with his or her life as a whole
and has frequent positive affect and infrequent negative affect (e.g., sadness, anger, etc.) (Diener, 1984).
Subsequently, Keyes (1998) enlarged the ield
of study of well-being by including aspects related to interpersonal and social development, which are inconsistent with the individual-centered focus of ear-lier models. Based on theories from philosophy, social psychology and cultural analysis, Keyes’ model repre-sents evolutionary tasks and their relationships with interpersonal experiences. The components of social well-being are the ability to demonstrate positive atti-tude and acceptance vis-à-vis individual differences (social acceptance); belief that society and its members
are capable of evolving positively (social actualization); perception that one’s activities are useful and relevant to society (social contribution); concern with and inter-est in society and other people (social coherence); and feeling of acceptance and support by a community (social integration).
The operationalization of positive mental health suggested by Keyes (2002) is consistent with the main
components of the deinition of mental health for -mulated by the World Health Organization, namely, feeling of well-being, effective functioning of the individual, and effective functioning within a commu-nity (Westerhof & Keyes, 2010). Within this context, effective functioning alludes to an individual’s capac-ity to fully utilize his or her skills and competence to satisfy his or her needs, objectives and personal and interpersonal values. This model was replicated in
sev-eral studies that conirmed the latent structure of the
indicators of well-being within the psychological con-text (Gallagher, Lopez, & Preacher, 2009; Keyes, 2002, 2005a, 2007; Keyes, Shmotkin, & Ryff, 2002; Linley, Maltby, Wood, Osborne, & Hurling, 2009). The dis-criminant validity of the indicators of positive mental health relative to the indicators of psychopathology
was assessed with exploratory and conirmatory fac
-tor analyses (Alterman et al. 2010; Keyes, 2005a; Massé
et al., 1998; Peter, Roberts, & Dengate 2011; Ryff & Singer, 1998; Weich et al., 2011; Westerhof & Keyes, 2010; Wilkinson & Walford, 1998). The application of both techniques showed that the full set of indica-tors is better represented by a model with two oblique factors instead of models that are unidimensional and have two orthogonal factors. Therefore, the hypothesis in which mental health dimensions are juxtaposed is
rejected. As a result, mental health, as a complete state,
can only be investigated by considering both its posi-tive and negaposi-tive components.
Psychometric Assessment of Positive Mental Health
6 that correspond to the dimension psychological well-being, and 5 that correspond to the dimension social well-being (Keyes, 2005b). Originally elaborated in the United States (Keyes, 2002, 2005b), the MHC-SF was
adapted for countries such as South Africa (Keyes et al.
2008), Canada (Peter, Roberts, & Dengate 2011), the Netherlands (Westerhof & Keyes, 2010), Italy (Petrillo, Capone, Caso, & Keyes, 2014) and Iran (Joshanloo & Nosratabadi, 2009).
Studies that have assessed the psychometric per-formance of the MHC-SF using exploratory and
conirmatory factor analyses have shown that a structure
with three oblique factors is the most parsimonious in explaining the set of items that compose the instrument (Keyes, 2005b; Keyes et al., 2008; Lamers, Westerhof, Bohlmeijer, ten Klooster, & Keyes, 2011; Robitschek & Keyes, 2009). Those studies also found that the
MHC-SF subscales have adequate reliability. Although the
correlations among factors are moderate to strong, the results indicated that the three theoretical dimensions reported in the literature (i.e., emotional, psychological and social well-being) might be distinguished. However, a recent study by Chen, Jing, Hayes and Lee (2012), who applied a bifactor model, suggested that the indi-cators of emotional and psychological well-being are
better explained by one general factor than by speciic
factors. In other words, the common variance shared by all the indicators is greater than the variance explained
by speciic factors. However, the bifactor model has not
yet been applied to a joint investigation of the three dimensions of positive mental health.
The present article describes the adaptation and validation of the MHC-SF in a sample of Brazilian adults. Following the linguistic adaptation of the instru-ment, several methods were used to test its psychometric properties, including exploratory factor analysis, item response theory and network analysis. The convergent validity was assessed by performing well-being and psy-chopathology assessments.
Method
Adaptation of the Mental Health Continuum – Short Form (MHC-SF) to the Brazilian Portuguese language
The strategy formulated for the adaptation of the MHC-SF sought to comply with the overall rec-ommendations in the literature (Beaton, Bombardier, Guillemin, & Ferraz, 2000; Borsa, Damásio, & Ban-deira, 2012; Geisinger, 1994; Sandoval & Durán, 1998). Once the author of the MHC-SF provided formal
consent, two bilingual translators independently trans-lated the English version into the Brazilian Portuguese language. Subsequently, two doctors and a doctoral candidate in psychology who are bilingual and have
signiicant experience in psychological assessment
evaluated the synthesis of the two independent
transla-tions. As a result, changes in the text of ive out of the
14 items in the MHC-SF were suggested. The changes suggested by the experts were performed, and then, a native English speaker performed the back-translation, which was evaluated by the author of the original ver-sion of the MHC-SF. Following changes in one single
item, the inal version was elaborated.
Validation and psychometric properties of the Mental Health Continuum – Short Form (MHC-SF)
Participants
The study sample consisted of 686 participants selected by convenience sampling and included 175 (27.3%) male and 466 (72.7%) female (n = 641) par-ticipants who had an average age of 33.9 years (SD = 11.3), with the age range varying from 18 to 73 years (n = 632). Seven participants (1.10%) had completed elementary school, 104 participants (16.1%) had com-pleted secondary school, 37 participants (5.70%) had completed technical, training or teaching courses, 183 participants (28.4%) had attended higher education, and 314 participants (48.7%) had attended graduate programs (n = 645). The participants’ places of resi-dence were distributed across 22 Brazilian states (n = 636) (Alagoas (AL), Amazonas (AM), Bahia (BA),
Ceará (CE), Espirito Santo (ES), Goiás (GO),
Mara-nhão (MA), Minas Gerais (MG), Mato Grasso do Sul (MS), Para (PA), Paraíba (PB), Pernambuco (PE),
Paraná (PR), Rio de Janeiro (RJ), Rio Grande do Norte (RN), Rondônia (RO), Rio Grande do Sul (RS), Santa Caterina (SC), Sergipe (SE), São Paulo (SP), and Tocan-tins (TO)) and the Federal District, mainly RS (n = 449; 70.6%), PR (n = 31; 4.9%), SP (n = 29; 4.6%), PB (n = 27; 4.2%), SC (n = 26; 4.1%) and BA (n = 15; 2.4%). The reported number of total participants among vari-ables varied because of missing data.
Instruments
(three items), psychological well-being (six items) and
social well-being (ive items). Keyes (2005b) found reli -ability values of over .80 for all the subscales as well as the global scale.
The Satisfaction with Life Scale (SLS; Diener, Emmons,
Larsen, & Grifin, 1985) consists of ive items that
are responded to on a seven-point Likert scale, which ranges from “Strongly disagree” to “Strongly agree.” Brazilian studies have reported internal consistency val-ues from .72 to .80 (Gonçalvez & Kapczinski, 2008; Gouveia et al., 2003).
The Psychological Well-being Scale (PWBS; Machado, Pawlowski, & Bandeira, 2013) is adapted from Ryff and Essex’s (1992) scales, and it consists of 36 items distributed across 6 subscales that assess the various dimensions of psychological well-being (positive rela-tions with others, autonomy, environmental mastery, personal growth, purpose in life, and self-acceptance). The items are responded to on a six-point Likert scale, which ranges from “Strongly disagree” to “Strongly agree.” The values of the composite reliability index of the subscales are over .70.
The Perceived Stress Scale (PSS-10; Cohen, Karmack, & Mermelstein, 1983) is a unidimensional instrument used to evaluate stress, and it consists of 10 items, with 6 positive and 4 negative items that are responded to on a Likert frequency scale, which ranges from “never” (0) to “very often” (4). In Brazilian studies, the values of the internal consistency of the PSS ranged from .80 to
.83 (Luft, Sanches, Mazo, & Andrade, 2007; Machado,
Damásio, Borsa, & Silva, 2014).
The General Health Questionnaire (GHQ-12; Sarriera, Schwarcz, & Câmara, 1996) consists of 12 items that are responded to on a four-point Likert scale, with the negative items ranging from 1 (not at all) to 4 (much more than usual) and the positive items ranging from 1 (more than usual) to 4 (much less than usual). There-fore, lower scores indicate a better general state of health. The value of the internal consistency of the general factor assessed by GHQ-12 is .81 (Machado, Damásio, & Silva, 2011).
The Questionnaire for Demographic and Psychosocial Fac-tors consists of closed-ended questions to collect data on gender, age, educational level, region, etc.
Procedures
Data collection was performed with an online
questionnaire on a SurveyMonkey platform, and it was announced through social networks and e-mail lists of participants from previous studies. Secrecy
and conidentiality with regards to the participants’
identity were ensured and explicitly indicated on the informed consent form, which was in compliance with the National Health Council guideline 466/12 as well as with earlier guidelines. The study was approved by the research ethics committee of the Institute of Psychology, Federal University of Rio Grande do Sul (Universidade Federal do Rio Grande do Sul - UFRGS), ruling no. 89,705 on September 3 2012.
Data Analysis
Several techniques were used to assess the
MHC-SF psychometric parameters and dimensionality. A
principal component analysis (Hotelling, 1933) with varimax rotation (Kaiser, 1958) was performed using software SPSS, and then, the observed eigenvalues and simulated eigenvalues were compared in a parallel analysis, with the results used as the criterion for com-ponent retention (Horn, 1965; Patil, Singh, Mishra, & Donovan, 2008). Subsequently, an exploratory factor analysis was performed based on a polychoric correla-tion matrix, using Minimum Rank Factor Analysis (Shapiro & ten Berge, 2002) as the extraction method. In addi-tion, Promin oblique rotation (Lorenzo-Seva, 1999) was performed with the softwareFactor 8.1(Lorenzo-Seva & Ferrando, 2006). Several methods were used to establish the number of retained factors, including the Minimum Average Partial (MAP) test (Velicer, 1976), parallel analy
-sis (PA), which utilized permutations of sample data
(Timmerman & Lorenzo-Seva, 2011), and the hull method (Lorenzo-Seva, Timmerman, & Kiers, 2011).
The it of models with one, two and three fac -tors, as well as of the bifactor model (including one
general and three speciic factors), was assessed with a conirmatory factor analysis. A polychoric correla -tion matrix and the Weighted Least Squares Mean- and Variance-adjusted (WLSMV) method were used (Muthén, Du Toit, & Spisic, 1997); this analysis was performed with the software Mplus 6.12 (Muthén & Muthén, 2010).
The goodness-of-it indexes and corresponding ref -erence values included the Comparative Fit Index and
Tukey-Lewis Index (CFI and TLI, respectively, ≥ .95), root mean square error of approximation (RMSEA, ≤ .05 or ≤ .08 with a 90% conidence interval) and chi
square (c²) test at statistical signiicance (p ≥ .05). A multigroup analysis was performed to investigate the invariance of factor loadings and thresholds as a func-tion of the participants’ gender.
software Winsteps v. 3.72.2 (Linacre, 2011). This model
can independently assess the item dificulty parameters (δ) and latent trait level (θ) in a sample of individuals
within the same linear continuum, and the results are expressed as log-odds units (logits). Although the logit scale
theoretically extends to ± ∞, in practice, the values tend
to fall within a range of ± 6 logits. The it of items to the measurement method was assessed with init and outit
residual indexes. The init and outit values are expected
to fall within the recommended interval (.50 to 1.50), with values closer to 1.0 indicating a better explanation by the model. Local independence was assessed through the residual correlations of items, and values below |.30| were expected. Differential item functioning as a function of the participants’ gender was assessed by
contrasting parameter dificulty between the groups. A
difference equal to or less than |.50| logit was used as the criterion to rule out the occurrence of differential item functioning (Linacre, 2011).
Finally, a network analysis (Borsboom & Cra-mer, 2013; Schmittmann et al., 2011) was performed to investigate the pattern of relationships among the
items in the MHC-SF. A network analysis is used to
plot a graphic (G, two-dimensional) model according to the patterns of relationships among the elements in a system. The graph includes nodes that represent the analyzed variables and lines that represent the relation-ships between nodes. In this technique, the network architecture and dynamics are latent; thus, they are unknown. The structure of the correlations among the items in the MHC-SF was analyzed with the Fruchter-man-Reingold algorithm, in which the system variables (nodes) are ordered as follows: a) after an initial state of mutual repulsion among all the variables, the variables that are mutually related are attracted; b) nodes with a greater number of relationships with the other nodes have a more central position; and c) lines represent the weighted association between nodes (e.g., correlation) such that the more intense color lines have a stronger association. The following parameters were assessed: centrality (vector extending from the most central vari-able in the system to the most peripheral varivari-able),
thresholds (τ, mean cutoff points and for each item),
density (D, ratio of the total possible and observed con-nections) and diameter (largest distance between two nodes). This analysis was performed with the software
R and qgraph package (Epskamp, Cramer, Waldorp, Schmittmann, & Borsboom, 2012). Imputation tech-niques were not used to compensate for missing data (approximately .1%).
Results
Several techniques were used to assess the psy-chometric properties and dimensionality of the MHC-SF. Stricto sensu, a principal component analysis is not recommended for latent trait models; however, it was used in the present study to establish whether the MHC-SF items could be clustered in more parsi-monious variable-index sets as a function of both the
common and speciic variance. Based on the Kaiser
criterion, two components with eigenvalues 7.26 and
1.22 were extracted, and a PA was performed with the
same number of variables and observations and 500 simulated matrixes. The second simulated eigenvalue
(1.25) obtained by the PA had a higher average value
than the second observed eigenvalue; therefore, only
the irst component should be retained, and the pattern
of dimensionality observed by the exploratory factor analysis was consistent with these results. The three methods used for factor retention indicated that only
the irst factor exhibited lower residual variance (MAP),
one common value provided a better explanation of variance compared with the factors simulated by the
sample value permutations (PA), and a better propor
-tion was observed between the it index and degrees
of freedom (hull). The criterion of unidimensionality
based on the proportion between the irst and second
eigenvalues was also met, with the proportion of the
irst eigenvalue being four-fold higher than the pro -portion of the second eigenvalue (Hattie, 1985). The component and factor loadings of items and their cor-responding reliability values are described in Table 1.
The it to previous MHC-SF models available
in the literature was tested vis-à-vis the data collected
in the present study. The it of the models with one
[c² = 1,033.48 df = 77, p < .001, CFI = .91, TLI =
.90, RMSEA = .15 (90% CI = .14 -.16)] or two [c² = 752.78, df = 76, p < .001, CFI = .93, TLI = .92,
RMSEA = .13 (90% CI = .12 -.13)] factors was poorer
than that of the model with the original three oblique factors [c² = 425.95, df = 74, p < .001, CFI = .96, TLI
= .96, RMSEA = .09 (90% CI = .08 - .10)]. In the lat -ter, the value of the correlation between factors ranged from .72 to .83. The bifactor model, which included
one general and three speciic factors [c² = 195.10,
df = 63, p < .001, CFI = .99, TLI = .98, RMSEA =
.06 (90% CI = .05 - .07)], was tested according to the
bifactor model exhibited remarkable incremental it in
terms of MHC-SF dimensionality, and it produced less residuals between the predicted model and empirical
matrix and explained a signiicantly larger amount of item variance (Δc² = 180.70, Δdf = 11, p < .001). Dif-ferences were not observed in the item factor loadings and thresholds as a function of the participants’ gender [c² = 334.56, df = 202, p < .001, CFI = .99, TLI = .99,
RMSEA = .05 (90% CI = .04 - .06)]. The item fac -tor loadings and reliability values in the bifac-tor model are described in Table 2. The item factor loadings are expressively higher in the general component, which explains approximately 50% of their variance on
aver-age. The speciic factors explain a signiicant portion
of the variance of the MHC-SF items; however, their
effect is not signiicant (M = 17%). Therefore, the full 14-item set exhibits a greater common shared variance
compared with the speciic subscales.
Because general factors of positive mental health explain most of the variance among MHC-SF
compo-nents, the it of the items to the Item Response Theory Rating Scale model was tested. All the items were it to
the unidimensional measurement model, and the corre-sponding init and outit were within the recommended
range (.50 to 1.50). Local dependence was not detected based on the criterion of residual correlations equal to or higher than .30. In addition, differences in the set were not observed for item endorsement odds or dif-ferential item functioning (DIF) as a function of the participants’ gender. The item and person reliability val-ues were adequate (over .70), which indicates that their order was highly reproducible (Linacre, 2011). These
indings are described in Table 3, and the items are ordered according to their degree of dificulty.
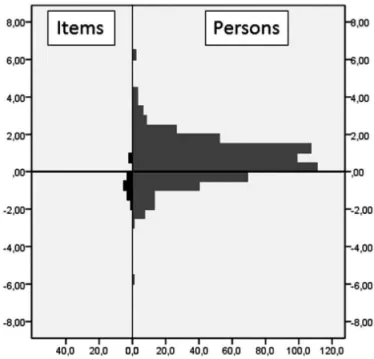
The items were located around point -.62 (SD = .65) on the logit scale and had an amplitude of approxi-mately 2.5 units (logits), which indicates that most items
pose a low degree of dificulty or are inferior to the
center of the linear continuum. Persons were mostly located above the central point of the scale (Mθ = .62,
SD = 1.16); thus, they exhibited higher levels of positive mental health on average. Figure 1 depicts the distribu-tion of item and person parameters on the logit scale.
The order of the items’ dificulty parameter (δ) provides
relevant information on the positive mental health con-tinuum as a dimensional construct. Small clusters of characteristic items can be observed in each region of the logit scale, and they represent the typical behavior of Table 1
Item Component and Factor Loadings and Reliability Measures of the MHC-SF
Item (summarized content) Component loading Factor loading
1 – Happy .74 .73
2 – Interested .77 .76
3 – Satisied .79 .78
4 – Contribute to society .67 .66
5 – Belong to community .68 .67
6 – Society is becoming a better place .67 .67
7 – People are good .68 .65
8 – Way society works makes sense .61 .59
9 – Likes own personality .78 .77
10 – Manages responsibility well .72 .69
11 – Relationships with others .74 .71
12 – Grow and become a better person .67 .66
13 – Conident to express own ideas .73 .71
14 – Life has direction or meaning .78 .80
Explained variance 51.8 Total = 56.8
Common = 70.8
Reliability α = .96 ω = .93
Table 2
Item Factor Loadings and Reliability Measures of the MHC-SF in the Bifactor Model
Item (summarized content) Factor loading
General factor EWB SWB PWB
1 – Happy .70 .65
2 – Interested .78 .32
3 – Satisied .78 .36
4 – Contribute to society .69 .07
5 – Belong to community .67 .23
6 – Society is becoming a better place .62 .63
7 – People are good .62 .41
8 – Way society works makes sense .57 .56
9 – Likes own personality .79 .21
10 – Manages responsibility well .70 .19
11 – Relationships with others .72 .24
12 – Grow and become a better person .62 .39
13 – Conident to express own ideas .68 .52
14 – Life has direction or meaning .83 .12
Average extracted variance .49 .22 .19 .10
Composite reliability .93 .43 .47 .34
Note. EWB = emotional well-being, SWB = social well-being, PWB = psychological well-being.
Table 3
Item Dificulty and it, Differential Item Functioning and Reliability of the MHC-SF
Item (summarized content) δ Rating Scale
Init Outit DIF*
8 – Way society works makes sense .80 1.10 1.10 .03
6 – Society is becoming a better place .50 1.07 1.05 -.17
7 – People are good -.06 .97 .96 .30
4 – Contribute to society -.32 1.16 1.20 -.05
5 – Belong to community -.36 1.40 1.41 .09
9 – Likes own personality -.72 .77 .72 -.04
3 – Satisied -.77 .66 .68 .00
10 – Manages responsibilities well -.77 .90 .91 .17
13 – Conident to express own ideas -.86 .90 .87 -.45
1 – Happy -.97 .68 .79 -.15
12 – Grow and become a better person -1.01 1.18 1.16 .23
11 – Relationships with others -1.18 1.08 1.10 -.04
14 – Life has direction or meaning -1.29 1.32 1.14 .05
2 – Interested -1.60 .90 .82 .00
Mean (SD) -.62 (.65) 1.01 (.21) .99 (.20) .00 (.18)
∑ = -.03
Reliability Items = .99 Persons = .89
persons with a given latent trait level (θ). The irst clus -ter is charac-terized by perceptions of personal in-terest and investment, desire for meaning and purpose in life,
and desire for safe and warm relations with signiicant
others. The next interval indicates feelings of happi-ness and satisfaction, desire for experiences of personal growth, autonomy and self-acceptance and the ability to create the environmental conditions required to satisfy personal needs. The perception of belonging and effec-tive contribution to society and increased acceptance
of and conidence in societal members are reconciled
in the next region of the logit scale. The last cluster includes the belief in the ability of society to actual-ize itself and develop greater cohesion with individuals. Therefore, one might conclude that more person-cen-tered characteristics (positive affect, meaning in life and self-acceptance) are more easily endorsed compared with the characteristics that have a social orientation.
Finally, we performed a network analysis to inves-tigate the structure and dynamics of the MHC-SF items. The graphic representation (G) was based on the tetrachoric correlation matrix and is depicted in Figure 2. The nodes present a summary of the item contents, and colors represent the original positive mental health
dimensions. A dense system (D = 1) in which all the
Figure 1. Map of items and persons. The vertical axis indicates the scale in logits. The distribution was
obtained by ixing the contrary measure so the mean
would be equal to zero.
nodes are connected and moderately interrelated (Mr²
= .28; SD = .10; diameter [G] = .78) can be observed. The items exhibit a complex pattern of association because they are not necessarily clustered per
dimen-sion or speciic subscale.
Certain items exhibit greater association with items at a subscale other than their own, such as the items “interested,” “contribution,” “acceptance,” “mastery” and “purpose.” The most central items are “purpose,” “satisfaction,” “self-acceptance” and “inter-ested,” which indicates that they are generally more correlated with the remainder of the items on the same
scale. The items’ centrality and threshold (τ) values are
described in Table 4.
Spearman’s rank correlation analysis (rho) was performed to investigate the association of the total
MHC-SF score with speciic dimensions (emotional,
social and psychological well-being) as well as with the scales for the SLS, PWBS, PSS-10 and GHQ-12. The aim of that analysis was to investigate the convergent validity of the MHC-SF because positive associations with well-being variables (SLS, PWBS) and negative associations with psychopathology variables
(PSS-10, GHQ-12) were expected. As shown in Table 5, all the correlations were signiicant and exhibited the expected direction. After analyzing the correla
-tions for speciic factors, the patterns of correlation
remained unaltered.
Discussion
All the techniques (principal component analy
-sis, exploratory and conirmatory factor analy-sis, item
One further relevant inding is that regardless
of the method used for assessment, the estimated parameters exhibited remarkable stability. Thus, both the component and factor loadings in the exploratory
and conirmatory factor analyses and centrality in the
network analysis indicated that the central items in the
MHC-SF, “purpose and meaning in life,” “satisied,”
“likes his/her personality” and “interested,” were the
most relevant. Although their interpretation, includ -ing their weight, linear relationship between items and factors, and strength of association with the remainder of the nodes in the system, differed among the various techniques, the results were consistent: these items have
the optimal ability to discriminate between levels of positive mental health. The average correlation between the estimates was Mr = .96, and such congruence was
also found relative to the item dificulty parameter. The
values resulting from the Item Response Theory Rating Scale model (δ) and item tetrachoric matrix (τ) indicated
nearly the same order of items (r = .99).
Our indings and interpretations are not inconsis -tent with or intended to modify the well-consolidated theory on positive mental health and its indicators (Gal-lagher et al., 2009; Keyes, 2002, 2005a, 2007; Keyes et al., 2002; Linley et al., 2009); rather, they are only meant to place the theory into perspective. Within this context,
Figure 2. Network of positive mental health indicators. The covariance structure indicates that the MHC-SF items are strongly associated with the others, resulting in a dense component. The items in the emotional (EWB), social (SWB) and psychological (PWB) well-being subscales exhibit moderate to strong crossed associations. Purpose in life and self-acceptance are the central nodes of the system, meaning that they are more strongly associated with the remainder
analysis of the item dificulty parameters (δ, τ) revealed
a relevant feature: the person-centered elements of pos-itive mental health are more easily perceived/endorsed than the elements related to social orientation. We
sug-gest that the original three-factor structure relects sets of items as a function of their degree of dificulty,
and similar interactions between various psychomet-ric parameters are well known (Bond, 1994; Ferguson,
1941; Guilford, 1941; Van der Ven & Ellis, 2000). In the case of the MHC-SF, this interaction was expressed by the negative correlation among measures related to the parameters of discrimination (weight, factor loading,
centrality, etc.) and parameters of item dificulty (δ, τ)
(Mr = -.72). Thus, the easier items are more correlated
with all the others, whereas the more dificult items are
less correlated with the total set of items, and items Table 4
Centrality Indexes and Thresholds of the Network Elements
Item (summarized content) Centrality eigenvector* τ
1 – Happy .90 -.77
2 – Interested .96 -1.12
3 – Satisied .97 -.57
4 – Contribute to society .84 -.24
5 – Belong to community .85 -.26
6 – Society is becoming a better place .85 .31
7 – People are good .83 -.08
8 – Way society works makes sense .79 .53
9 – Likes own personality .97 -.54
10 – Manages responsibility well .87 -.59
11 – Relationships with others .90 -.81
12 – Grow and become a better person .82 -.74
13 – Conident to express own ideas .89 -.67
14 – Life has direction or meaning 1.00 -.80
Note. *The unit represents the central node and follows a decreasing order until the most peripheral node.
Table 5
Correlation of the MHC-SF with Criterion Variables and Descriptive Statistics of Indicators
LSS PR AU EM PG PL SA PSS GHQ
MHC-SF .63 .52 .26 .56 .53 .69 .66 -.60 -.60
EWB .65 .46 .25 .50 .49 .65 .65 -.60 -.65
SWB .46 .44 .16 .39 .39 .52 .47 -.44 -.41
PWB .60 .51 .32 .62 .55 .69 .68 -.61 -.61
N 463 414 425 415 429 420 414 403 403
α .91 .78 .67 .82 .80 .85 .85 .87 .93
Note. All the correlations are statistically signiicant at p ≤ .01. The number of cases varies from 403 to 463 because of missing
data. MHC-SF = Mental Health Continuum – Short Form; EWB = emotional well-being; SWB = social well-being; PWB =
with similar parameters of item dificulty are more cor -related with the other items compared with items with less similar parameters. This hypothesis explains why previous studies (e.g., Keys, 2005b; Keyes et al., 2008; Lamers et al., 2011; Petrillo et al., 2014; Westerhof & Keyes, 2010) found that the average scores on the subscale social well-being were lower compared with the scores on the subscales emotional and psychologi-cal well-being after the MHC-SF items were separated across different factors. Separating indicators across factors also involves dividing the common shared vari-ance, which might result in biased interpretations of the relationship between positive mental health and other relevant variables (e.g., maximizing, minimizing, or even suppressing current relationships).
Conclusion
The MHC-SF is a self-reporting instrument that assesses positive mental health using 13 indicators (14 items) of psychological well-being. In the present study, several analyses were used (principal component analy-sis, factor analyanaly-sis, item response theory and network analysis) to test the psychometric properties of the Brazilian Portuguese version of the MHC-SF. In addi-tion, correlations between the MHC-SF and indicators of well-being and psychopathology were assessed. The results indicated that the MHC-SF represents a valid and reliable measurement of positive mental health accord-ing to the model formulated by Keyes (2002), and the study provided relevant information on the dimension-ality of the MHC-SF and characteristic behavior of the construct dimensional continuum. Therefore, we have concluded that the MHC-SF might be parsimoniously represented by a unidimensional structure and sug-gest that individual-centered behaviors are more easily endorsed compared with socially oriented behavior. These results were consistent when the participants were compared per gender.
Certain limitations of the present study are
deserving of mention. A non-probabilistic sample was used, and it increases the odds of type I error inla
-tion. Although we applied several strategies in our
investigative approach and used robust techniques to improve the safety of our inferences, studies with larger and probabilistic samples should be performed to verify our results and conclusions. In addition, the gender distribution of the sample was not ideal. Thus, the results of our multigroup and differential item
functioning analyses should be conirmed by future
studies with more balanced samples relative to gender, educational level, geographical distribution and
socio-economic level. A further limitation was caused by
the narrow socioeconomic range of the participants. Because many indicators of well-being are correlated with such variables, studies assessing the psychomet-ric properties of the MHC-SF in samples with lower socioeconomic levels are required. Finally, we believe that future studies should also investigate the associa-tion of positive mental health with the variables related to that process, such as personality traits, age, gender, health biological markers, self-care habits, spirituality/ religiousness, etc.
The inal adapted version of the MHC-SF,
named the Positive Mental Health Scale, is described
in Appendix A. The raw scores of the scale might be
used as indicators of positive mental health levels; however, we recommend using modeled scores (factor analysis and item response theory) whenever possible.
A normative table that includes the samples from the
present study and raw and modeled scores is presented
at the end of the article (Appendix B). Although pre -vious authorization is not required to use the Positive Mental Health Scale, we do require that proper credit be given to its authors and the present article be cited as a reference.
References
Alterman, A. I., Cacciola, J. S., Ivey, M. A., Coviello,
D. M., Lynch, K. G., Dugosh, K. L., & Habing, B. (2010). Relationship of mental health and illness in substance abuse patients. Personality and Individual Differences, 49(8), 880-884.
Andrich, D. (1978). A rating formulation for ordered
response categories. Psychometrika, 43(4), 561-573.
Beaton, D. E., Bombardier, C., Guillemin, F., & Fer-raz, M. B. (2000). Guidelines for the process of cross-cultural adaptation of self-report measures.
SPINE, 24, 3186-3191.
Bond T. G. (1994). Too many factors in Factor Analy -sis? Rasch Measurement Transactions, 8(1), 347.
Borsa, J. C., Damásio, B. F., & Bandeira, D. R. (2012)
Adaptação e validação de instrumentos psicológi
-cos entre culturas: Algumas considerações. Paidéia, 22(53), 423-432.
Borsboom, D., & Cramer, A. O. J. (2013). Network
of psychopathology. Annual Review of Clinical Psy-chology, 9, 91-121.
Chen, F. F., Jing, Y., Hayes, A., & Lee, J. M. (2012). Two concepts or two approaches? A bifactor analysis
of psychological and subjective well-being. Journal of Happiness Studies, 14(3), 1033-1068.
Cohen, S., Karmack. T., & Mermelsteinm, R. (1983).
A global measure of perceived stress. Journal of Health and Social Behavior, 24(4), 385-396.
Damásio, B. F., Machado, W. L., & Silva, J. P. (2011). Estrutura fatorial do questionário de saúde geral (QSG-12) em uma amostra de professores esco-lares. Avaliação Psicológica, 10(1), 99-105.
Diener, E. (1984). Subjective well-being. Psychological Bulletin, 95(3), 542-575.
Diener, E., Emmons, R. A., Larsen, R., & Griffin, S.
(1985). The satisfaction with life scale. Journal of Personality Assessment, 49(1), 91-95.
Epskamp, S., Cramer, A. O. J., Waldorp, L. J., Schmit -tmann, V. D., & Borsboom, D. (2012). Qgraph: Network visualizations of relationships in psy-chometric data. Journal of Statistical Software, 48, 1-18.
Ferguson G. A. (1941). The factorial interpretation of
test difficulty. Psychometrika, 6(5), 323-329.
Gallagher, M. W., Lopez, S. J., & Preacher, K. J. (2009). The hierarchical structure of well-being. Journal of Personality, 77(4), 1025-1050.
Geisinger, K. F. (1994). Cross-cultural normative as-sessment: Translation and adaptation issues influencing the normative interpretation of assess-ments instruassess-ments. Psychological Assessment, 6(4), 304-312.
Gonçalves, D. M., & Kapczinski, F. (2008). Transtorno mental, indicadores demográficos e satisfação com a vida. Revista de Saúde Pública, 42(6), 1060-1066.
Gouveia, V. V., Chaves, S. S. S., Oliveira, I. C. P., Dias,
M. R., Gouveia, R. S. V., & Andrade, P. R. (2003). A
utilização do QSG-12 na população geral: Estudo de sua validade de construto. Psicologia: Teoria e Pes-quisa, 19(3), 241-248.
Guilford J. P. (1941). The difficulty of a test and its fac-tor composition. Psychometrika6(2), 67-77.
Gurin, G., Veroff, J., & Feld, S. (1960). Americans view their mental health. New York: Basic Books.
Hattie, J. (1985). Methodology review: Assessing unidi -mensionality of tests and itens. Applied Psychological Measurement, 9(2), 139-164.
Holgado-Tello, F., Chacón-Moscoso, S.,
Barbero-Gar-cía, I., & Vila-Abad, E. (2010). Polychoric versus
Pearson correlations in exploratory and confirma-tory factor analysis of ordinal variables. Quality and Quantity, 44, 153–166.
Horn, J. L. (1965). A rationale and test for the number
of factors in factor analysis. Psychometrika, 30, 179-85.
Hotelling, H. (1933). Analysis of complex statistical
variables into principal components. Journal of Ed-ucational Psychology, 24(6), 417-441.
Jahoda, M. (1958). Current concepts of positive mental health. New York, NY: Basic Books.
Joshanloo, M., & Nosratabadi, M. (2009). Levels of mental health continuum and personality traits. So-cial Indicators Research, 90(2), 211-224.
Kaiser, H. F. (1958). The varimax criterion for analytic rotation in factor analysis. Psychometrika, 23(3), 187-200.
Keyes, C. L. M. (1998). Social well-being. Social Psychol-ogy Quarterly, 61(2), 121-140.
Keyes, C. L. M. (2002). The mental health continuum: From languishing to flourishing in life. Journal of Health and Social Research, 43(2), 207-222.
Keyes, C. L. M. (2005a). Mental illness and/or mental health? Investigating axioms of the complete state model of health. Journal of Counseling and Clinical Psychology, 73(3), 539-548.
Keyes, C. L. M. (2005b). The subjective well-being of
America’s youth: Toward a comprehensive assess -ment. Adolescent and Family Health, 4, 3-11.
Keyes, C. L. M. (2006). Subjective well-being in mental health and human development research
world-wide: An introduction. Social Indicators Research, 77, 1-10.
Keyes, C. L. M. (2007). Promoting and protecting
men-tal health as flourishing: A complementary strategy
for improving national mental health. American Psy-chologist, 62(2), 95-108.
and interventions. In C. R. Snyder & S. J. Lopez (Eds.), Handbook of positive psychology (pp. 45-62). New York, NY: Oxford University Press.
Keyes, C. L. M., Shmotkin, D., & Ryff, C. D. (2002). Optimizing well-being: The empirical encounter of two traditions. Journal of Personality and Social Psy-chology, 82(6), 1007-1022.
Keyes, C. L. M., Wissing, M., Potgieter, J.P., Temane, M.,
Kruger, A., & van Rooy, S. (2008). Evaluation of
the mental health continuum – short form
(MHC-SF) in Setswana-speaking South Africans. Clinical Psychology and Psychotherapy, 15(3), 181-192.
Lamers, S. M. A., Westerhof, G. J., Bohlmeijer, E. T., ten
Klooster, P. M., & Keyes, C. L. M. (2011). Evalu-ating the psychometric properties of the mental health continuum – short form (MHC-SF). Journal of Clinical Psychology, 67(1), 99-110.
Linacre, J. M. (2011). A user’s guide to winsteps, program manual 3.74.0. Chicago: Winsteps.com.
Linley, A., Maltby, J., Wood, A. M., Osborne, G., &
Hurling, R. (2009). Measuring happiness: The higher order factor structure of subjective and psychological well-being measures. Personality and Individual Differences, 47(8), 878-884.
Lorenzo-Seva, U. (1999). Promin: A method for oblique
factor rotation. Multivariate Behavioral Research,
34(3), 347-365.
Lorenzo-Seva, U., & Ferrando, P. J. (2006). Factor: A
computer program to fit the exploratory factor analysis model. Behavior Research Methods, 38(1), 88-91.
Lorenzo-Seva, U., Timmerman, M. E., & Kiers, H. A. L.
(2011). The hull method for selecting the number of common factors. Multivariate Behavioral Research,
46(2), 340-364.
Luft C. B., Sanches S. O., Mazo, G. Z., & Andrade A.
(2007). Versão brasileira da escala de estresse per-cebido: Tradução e validação para idosos. Revista de Saúde Pública, 41(4), 606-615.
Machado, W. L., Damásio, B. F., Borsa, J. C., & Silva, J. P. (2014). Dimensionalidade da escala de estresse percebido (Perceived Stress Scale, PSS-10) em uma amostra de professores. Psicologia: Reflexão e Crítica,
27 (1), 38-43.
Machado, W. L., Pawlowski, J., & Bandeira, D. R. (2013). Validação da psychological well-being scale em uma
amostra de estudantes universitários. Avaliação Psi-cológica, 12(2), 263-272.
Massé, R., Poulin, C., Dassa, C., Lambert, J., Bélair, S.,
& Battaglini, A. (1998). The structure of mental
health: Higher-order confirmatory factor analyses of psychological distress and well-being measures.
Social Indicators Research, 45(1-3), 475-504.
Muthén, B., Du Toit, S. H. C., & Spisic, D. (1997). Ro-bust inference using weighted least squares and quadratic estimating equations in latent variable modeling with categorical and continuous out-comes. Non-published technical report.
Muthén, L. K., & Muthén, B. O. (2010). Mplus: Statistical analysis with latent variables. User’s guide. Los Angeles:
Muthén & Muthén.
Patil, V. H., Singh S. N., Mishra S., & Donovan, T. (2008). Efficient theory development and
fac-tor retention criteria: A case for abandoning the
“eigenvalue greater than one” criterion. Journal of Business Research, 61(2), 162-170.
Peter, T., Roberts, L. W., & Dengate, J. (2011).
Flourish-ing in life: An empirical test of the dual continua
model of mental health and mental illness among Canadian university students. The International Jour-nal of Mental Health Promotion, 13(1), 13-22.
Petrillo, G., Capone, V., Caso, D., & Keyes, C. L. M. (2014). The mental health continuum short-form (MHC-SF) as a measure of well-being in the Italian context. Social Indicators Research, 22, 1-22.
Robitschek, C., & Keyes, C. L. M. (2009). Keyes’s mod-el of mental health with personal growth initiative as a parsimonious predictor. Journal of Counseling Psychology, 56(2), 321-329.
Ryff, C. D. (1989). Happiness is everything, or is it? Explorations on the meaning of psychological well-being. Journal of Personality and Social Psychology,
57(6), 1069-108.
Ryff, C. D., & Essex, M. J. (1992). The interpretation of life experience and well-being: The sample case of relocation. Psychology and Aging, 7(4), 507-517.
Ryff, C. D., & Singer B. H. (1998). The contours of positive human health. Psychological Inquiry, 9(1), 1–28.
Sheuneman & J. R. Grenier (Eds.), Test interpretation and diversity: Achieving equity in assessment wording (pp.
181-211). Washington, DC: American Psychologi
-cal Association.
Sarriera, J. C., Schwarcz, C., & Câmara, S. G. (1996).
Bem-estar psicológico: Análise fatorial da escala de
Goldberg (GHQ-12) numa amostra de jovens. Psi-cologia: Reflexão e Crítica, 9(2), 293-306.
Schmittmann, V. D., Cramer, A. O. J., Waldorp, L. J., Epskamp, S., Kievit, R. A., & Borsboom,
D. (2013). Deconstructing the construct: A network perspective on psychological phe-nomena. New Ideas in Psychology. doi: 10.1016/j. newideapsych.2011.02.007
Shapiro, A., & ten Berge, J. M. F. (2002). Statistical
inference of minimum rank factor analysis. Psy-chometrika, 67(1), 79-94.
Timmerman, M. E., & Lorenzo-Seva, U. (2011). Di-mensionality assessment of ordered polytomous items with parallel analysis. Psychological Methods, 16, 209-220.
Van der Ven, A. H. G. S., & Ellis, J. L. (2000). A Rasch
analysis of Raven’s standard progressive matrices.
Personality and Individual Differences, 29(1), 45-64.
Velicer,W. F. (1976). Determining the number of com-ponents from the matrix of partial correlations.
Psychometrika, 41, 321-327.
Weich, S., Brugha, T., King, M., McManus, S., Bed-dington, P., Jenkins, R., Cooper, C., McBride, O., & Stewart-Brown, S. (2011). Mental well-being and mental illness: Findings from the adult psychiat-ric morbidity survey for England 2007. The British Journal of Psychiatry, 199, 23-28.
Westerhof, G. J., & Keyes, C. L. M. (2010). Mental ill-ness and mental health: The two continua model across the lifespan. Journal of Adult Development,
17(2), 110-119.
Wilkinson, R. B., & Walford, W. A. (1998). The mea -surement of adolescent psychological health: One or two dimensions? Journal of Youth and Adolescence, 27(4), 443-455.
World Health Organization. (2005). Promoting mental health: Concepts, emerging evidence, practice. Geneva: WHO.
Recebido: 06/06/2014 1ª reformulação: 19/08/2014
Aprovado: 08/11/2014
Nota dos autores:
Coordenação de Aperfeiçoamento de Pessoal de Nível Superior (CAPES), Ministério da Educação, funded this research during the irst author doctoral and postdoctoral fellow.
Sobre os autores:
Denise Ruschel Bandeira é doutora em Psicologia, professora dos cursos de graduação e pós-graduação em Psico-logia da UFRGS, pesquisadora 1C do CNPq e atual coordenadora do Programa de Pós-Graduação em PsicoPsico-logia da UFRGS.
Wagner de Lara Machado é doutor em Psicologia, professor dos cursos de graduação e pós-graduação em Psicolo-gia da Pontifícia Universidade Católica de Campinas (PUC-Campinas).
Contato com os autores:
Pontifícia Universidade Católica de Campinas (PUC-Camp)
Campus II – Av. John Boyd Dunlop, s/n.º, Jd. Ipaussurama, Campinas – SP
CEP: 13060-904
Appendix A
Escala de Saúde Mental Positiva (Machado & Bandeira, 2015)
Por favor, responda às questões a seguir sobre como você tem se sentido durante o último mês. Assinale a resposta que melhor representa a frequência com que você teve a experiência ou sentiu-se da maneira descrita.
Durante o último mês, com que frequência você sentiu:
1 Nunca
2 Uma ou duas
vezes
3 Cerca de uma vez por semana
4 Cerca de 2 ou
3 vezes por semana
5
Quase todos os dias
6 Todos os dias
1 2 3 4 5 6
Feliz.
Interessada(o) pela vida.
Satisfeito(a).
Que você teve algo importante para contribuir para a sociedade.
Que você pertencia a uma comunidade (como um grupo social ou sua vizinhança).
Que nossa sociedade está se tornando um lugar melhor para pessoas como você.
Que as pessoas, em geral, são boas.
Que a forma como a nossa sociedade funciona faz sentido para você.
Que você gostava da maior parte de suas características de personalidade.
Que você administrou bem as responsabilidades do seu dia a dia.
Que você tinha relacionamentos afetuosos e de coniança com outras pessoas.
Que você teve experiências que o desaiaram a crescer e tornar-se uma pessoa melhor.
Que você foi coniante para pensar ou expressar suas ideias e opiniões próprias.
Appendix B
Positive Mental Health Scale (Machado & Bandeira, 2015) Normative table
Raw score Modeled score (Rasch) Percentile Raw score Modeled score (Rasch) Percentile 14 15 16 17 18 19 20 21 22 23 24 25 26 27 28 29 30 31 32 33 34 35 36 37 38 39 40 41 42 43 44 45 46 47 48 49 -5.75 -4.51 -3.77 -3.32 -2.99 -2.73 -2.51 -2.32 -2.16 -2.01 -1.88 -1.76 -1.66 -1.55 -1.46 -1.37 -1.29 -1.21 -1.14 -1.07 -1.00 -0.93 -0.86 -0.80 -0.74 -0.68 -0.62 -0.56 -0.50 -0.44 -0.38 -0.33 -0.27 -0.21 -0.15 -0.09 1 1 1 1 1 1 1 1 1 2 2 2 3 4 4 4 5 5 6 6 7 7 8 9 10 11 12 13 14 15 16 18 19 20 21 23 50 51 52 53 54 55 56 57 58 59 60 61 62 63 64 65 66 67 68 69 70 71 72 73 74 75 76 77 78 79 80 81 82 83 84 -0.03 0.02 0.09 0.15 0.21 0.27 0.34 0.40 0.47 0.54 0.61 0.69 0.76 0.84 0.92 1.01 1.09 1.19 1.28 1.38 1.49 1.60 1.72 1.85 1.99 2.14 2.30 2.49 2.70 2.94 3.22 3.58 4.05 4.82 6.07 25 27 29 31 32 35 38 42 44 47 50 54 57 59 62 65 68 71 74 78 81 84 87 89 91 93 94 95 97 97 98 99 99 99 99