R E S E A R C H A R T I C L E
Open Access
The Maristán stigma scale: a standardized
international measure of the stigma of
schizophrenia and other psychoses
Sandra Saldivia
1*, Ariadne Runte-Geidel
2, Pamela Grandón
3, Francisco Torres-González
4, Miguel Xavier
5,
Claudio Antonioli
6, Dinarte A Ballester
7, Roberto Melipillán
1, Emiliano Galende
6, Benjamín Vicente
1,
José Miguel Caldas
5, Helen Killaspy
8, Rachel Gibbons
9and Michael King
8Abstract
Background:People with schizophrenia face prejudice and discrimination from a number of sources including professionals and families. The degree of stigma perceived and experienced varies across cultures and communities. We aimed to develop a cross-cultural measure of the stigma perceived by people with schizophrenia.
Method:Items for the scale were developed from qualitative group interviews with people with schizophrenia in six countries. The scale was then applied in face-to-face interviews with 164 participants, 103 of which were repeated after 30 days. Principal Axis Factoring and Promax rotation evaluated the structure of the scale; Horn’s parallel combined with bootstrapping determined the number of factors; and intra-class correlation assessed test-retest reliability.
Results:The final scale has 31 items and four factors: informal social networks, socio-institutional, health professionals and self-stigma. Cronbach’s alpha was 0.84 for the Factor 1; 0.81 for Factor 2; 0.74 for Factor 3, and 0.75 for Factor 4. Correlation matrix among factors revealed that most were in the moderate range [0.31-0.49], with the strongest occurring between perception of stigma in the informal network and self-stigma and there was also a weaker correlation between stigma from health professionals and self-stigma. Test-retest reliability was highest for informal networks [ICC 0.76 [0.67 -0.83]] and self-stigma [ICC 0.74 [0.64-0.81]]. There were no significant differences in the scoring due to sex or age. Service users in Argentina had the highest scores in almost all dimensions.
Conclusions:The MARISTAN stigma scale is a reliable measure of the stigma of schizophrenia and related psychoses across several cultures. A confirmatory factor analysis is needed to assess the stability of its factor structure.
Keywords:Stigma, Questionnaire, Psychometrics, Rating scale schizophrenia
Background
People with schizophrenia and other psychoses face a range of problems, some arising directly from the illness and others from the stigma of the disorder. Stigma can best be understood as the loss of status by, or discrimination of, a person because of an attribute that others evaluate disap-provingly [1]. Stigma complicates recovery, thereby redu-cing self-esteem and access to social networks [2,3]. It has a particularly severe impact on patients’quality of life [4].
For this reason stigma has generated considerable interest in recent decades [3,5].
Given that it is the result of a social interaction, stigma’s manifestations vary from one culture to another [6,7]; each society determines what is considered abnormal, how illness is defined and how and where help is sought [8].
An increasing number of studies have assessed stigma and its consequences. Some of them have focused on pub-lic attitudes to people with mental illness [9-11], others have considered the perception of the families or carers and professional groups, and others have measured the personal experience of those who suffer stigma [12-14]. Even psychiatrists have been shown to stigmatise patients * Correspondence:ssaldivi@udec.cl
1Department of Psychiatry and Mental Health, Faculty of Medicine, University
of Concepcion, Concepcion, Chile
Full list of author information is available at the end of the article
with mental illness. For example, 42% of psychiatrists sur-veyed recently in Brazil negatively stereotyped people with schizophrenia, agreed with some restrictions on their civil liberties (e.g. the right to vote) and scored highly on attitudes reflecting prejudice and a need to keep a social distance [15]. Although qualitative studies of interviews with people with mental illness have shown that stigma can occur in a variety of forms [16], the main distinction made by service users is between acts of discrimination and feelings of stigma. The first concerns actual social re-jection, while the second refers to feelings of inferiority and shame, and fear of provoking negative responses in others [16].
A further element is self-stigma when the person seems to accept a negative stereotype and either becomes ashamed or simply hides some element of their make-up that they perceive is unacceptable to others. This happens when the mentally ill person internalizes the stereotypes and negative social attitudes associated with people with mental disorders to the extent that they shape his/her own identity [17,18]. High self-stigma appears to be at the opposite pole to a sense of personal empowerment and control [19]. Self-stigma also occurs in family members, particularly those with full insight into the mental illness and possibly its gravity [20].
Most instruments used in measuring personal stigma of mental illness have considered different ways in which stigma is experienced; some are focused on stigmatisation of the self [3,21], others are based in the direct experience of discrimination [13,22], some on the perception of stigma [23,24], and more recent studies have considered the anticipated discrimination [5,25]. Most instruments evaluate both perception and experience of the stigma and some consider self-stigma [26]. People’s experience of stigma is considered mainly in terms of perceived discrim-ination and stereotypes about the population with mental illness [26].
Only a few instruments have based the development of their scale on qualitative data about people’s experiences and views. Angermeyer et al. [27] developed a scale from results of focus groups conducted in Germany [27,28]. An instrument developed by Stuart et al. [12] also started with a qualitative approach; it has two scales, one of which assesses the experience of stigma in a number of life’s domains and the other evaluates its impact [12]. Differ-ences in the response format and number of items make it difficult to make comparisons with other instruments and reduce the possibility of exploring the complexity of the experience. Finally, Thornicroft et al. [5] developed an instrument starting with a qualitative step but this step was limited to obtaining the views of people to a number of items already extracted from the literature. The result-ing scale, the DISC is a long and complex instrument that measures a number of domains. Its main advantage is that
it was developed across a number of European countries [5]. Its disadvantage is lack of detailed psychometric data. A recent systematic review compared instruments devel-oped up until 2009. It is clear in this review that nearly all were developed in a single culture [26].
Few studies have been multi-cultural [5,25]. Some re-searchers have found that there are no differences on the stigma in different places [29], whereas others show a lower discrimination in certain sites [30]. Cheon and Chiao [31] reaffirm the importance of taking account of cross-cultural factors in the study of stigma, because cultural variations may be important even in societies with low overall stigma [31,32]. Furthermore, given that few cross-cultural studies use the perceptions of affected persons [33], there is the need to focus more on this approach.
The Maristán Network is an international group of mental health professionals who collaborate on research and teaching in Europe and Latin America (http://www. redmaristan.org/). Our objective was to develop an instru-ment to evaluate stigma in people with schizophrenia and other psychoses that would have validity across cultures. We aimed to construct a broad measure of stigma whose component parts could assess perceived stigma from family, friends, colleagues and professionals, stigma in its more institutional form and self-stigma if it were evident. We did not have the resources to recruit enough people to compare the degree and type of stigma between countries (with appropriate statistical power). Rather, our aim was to include all countries to ensure that the psycho-metric properties of the instrument would have relevance to all.
Methods
then agreed a first version of the instrument. This penul-timate version was then sent back to the expert group members who carried out a final assessment by scoring the relevance of each statement from 1 (not at all relevant) up to 5 (highly relevant); the score three, as the median, was established as the cut-off point and the items that scored less were considered of little or no relevance [34]. This led to a final draft of the questionnaire, which was tested in a new sample of patients in Buenos Aires, Argentina; Porto Alegre, Brazil; Concepción, Chile; Granada, Spain; Lisbon, Portugal; and London, England, using the appropriate versions in Spanish, Portuguese and English.
Participants
The aim in this final phase of the study was to recruit up to 30 patients from each country, aged 18 years and over whose diagnoses of schizophrenia and related psychoses [F20-F29, International Classification of Disease version 10] was confirmed by the responsible psychiatrists. Partici-pants were attending outpatient psychiatric services or day centres, had experienced a minimum of three years since the first known contact with services and had at least one year of continuous contact with the service. We chose three years to be sure that the diagnosis was estab-lished and stable, and for sufficient time to have passed for patients to have lived with the diagnosis and expe-rienced stigma. Participants with moderate or profound intellectual disability and those with a history of illness of over 15 years since first contact with services were ex-cluded. The latter was to restrict the sample to people with lesser degrees of institutionalisation, who receive care in model of community mental health. It was also our clinical observation that patients with longer term illness become accustomed or resigned to stigma and may be less likely to notice its effects on a day-to-day basis. Partici-pants were identified from the clinical service registers in each participating centre. In the UK a key clinician invited patients to participate and if they agreed they were put in contact with a researcher who confirmed the diagnosis and inclusion criteria. In other countries researchers used a mixture of direct contact with patients and recruitment via clinicians. A written informed consent was obtained in keeping with each country’s guidance for good clinical practice in research. The study was approved by appro-priate research ethical committees of the Faculties of Medicine and local health services in each country (Ethic Committees in National University of Lanus, Argentina, Maternal and Children’s Hospital Presidente Vargas, Porto Alegre, Brazil, Faculty of Medical Sciences in Nova University of Lisbon, Portugal, Faculty of Medicine in University of Concepcion, Chile, Ethic Committee in Human Research (CEIH) in Granada, Spain; and Camden and Islington Local Research Ethics Committee in UCL Medical School, UK).
Instrument
The first draft of the Maristán Questionnaire that was developed for testing consisted of 38 statements to which the respondents indicate their degree of agreement. The statements concerned stigma in personal, family and social life, the attitudes of health professionals, and stigma in the public sphere and work. The format was a Likert scale with a score of 1 indicating complete disagreement and 7 indicating complete agreement with each statement. Where appropriate, the direction of scoring was reversed so that a high score indicates a high level of stigma. In all countries, the questionnaire was read out by an inter-viewer to make sure the meaning was clear.
Procedure
As described, participants took part in individual face-to-face interviews in which the questionnaire was delivered by professionals who had clinical or other experience in the care of people with severe mental illness. All of the in-terviewees were invited to answer the questionnaire again after 30 days in order to estimate temporal stability. Each investigator kept field notes regarding the application of the questionnaire, including the degree of comprehension of each statement, the language terms used, views on the length of the interviews and any adverse comments about them.
Data analysis
Results
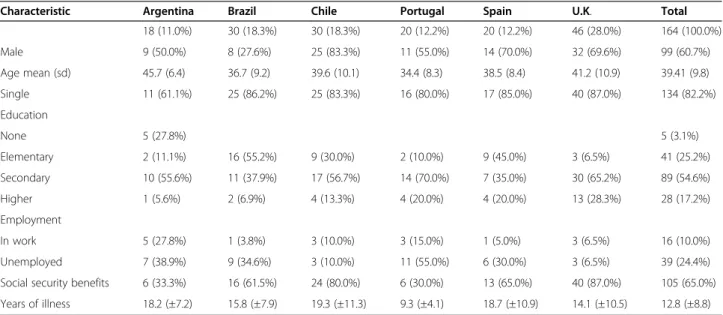
164 interviews were undertaken, of which 103 repeated the scale after about 30 days. Socio-demographic charac-teristics of participants in each country are given in Table 1. 60.4% of participants were men, 82.2% were sin-gle, 54.6% had completed secondary schooling and 54.9% were in receipt of Social Security payments. Mean age was 39 years (sd 9.8), while mean years of illness was 12.8 (sd 8.8). Patients interviewed in Argentina were older, had greater involvement in work (27.8%) and in-cluded fewer single persons (61.1%). Brazil was the only country where the proportions of women and patients with only basic education were the greatest, 72.4% and 55.2% respectively. Patients in the sample from Spain had a low level of education (45% with basic schooling), and Argentina and Portugal had the lowest proportion of patients classified as disabled by Social Security.
Results obtained from Horn’s Parallel Analysis on 5,000 bootstrap samples revealed that only the first four eigenvalues of the correlation matrix of the stigma scale [eigenvalues 7.86, 2.97, 2.07, and 1.85] were greater than the 95 percentile of the eigenvalues obtained from the bootstrap samples [values 2.20, 2.03, 1.91 and 1.81]. This result revealed that there were four main factors in the scale. For the purposes of comparison, application of the Kaiser Guttman criterion identified 12 factors, while the analysis utilizing the scree plot revealed a sharp break after the second factor.
Given the above, it was decided to extract four factors followed by a Promax rotation. The analysis of the pat-tern matrix revealed that six items had coefficients less than 0.3 on any of the four factors and thus these were removed and the extraction repeated. The results of the second analysis showed that one additional item had a
coefficient of less than 0.3. This item was also removed and the analysis repeated once again, resulting in all remaining items having coefficients greater than 0.3. Thus this was accepted as the final factor solution for interpretation [see Table 2].
Following this analysis the scale contained 31 items and four factors. We called factor 1 "informal networks”
as it contains 11 items on perception of stigmatizing attitudes of people closest to the patient, including the family, partner and friends. The second factor, namely
“socio-institutional”, consists of 12 items on the stigma in health services, the communication media, people who have close contact with patients, and mental health law. The third factor“health professionals”was composed of four items concerning cold and impersonal attitudes of professionals with regard to patients. The fourth factor which we called “self-stigma” concerned four items on patients’ feelings of inferiority and low expectations of their own performance.
With regard to internal consistency of each factor, Factor 1 had a Cronbach’s Alpha coefficient of 0.84, with values of corrected item - total correlation ranging from 0.43 to 0.64. Items in the Factor 2 had a Cronbach’s Alpha of 0.81 with corrected item - total correlations from 0.34 to 0.54. Cronbach’s alpha for the Factor 3 was 0.74 with corrected item - total correlations varying between 0.34 and 0.65. Finally, the internal consistency of Factor 4 was 0.75 with corrected item - total correlations ranging from 0.44 to 0.62.
Analyzing the correlation matrix between factors [see Table 3] revealed that most were in the moderate range [0.31-0.49], with the strongest occurring between per-ception of stigma in the informal network [factor 1] and self-stigma [factor 4]. Conversely there was a weaker
Table 1 Sample socio-demographic characteristics by country
Characteristic Argentina Brazil Chile Portugal Spain U.K. Total
18 (11.0%) 30 (18.3%) 30 (18.3%) 20 (12.2%) 20 (12.2%) 46 (28.0%) 164 (100.0%)
Male 9 (50.0%) 8 (27.6%) 25 (83.3%) 11 (55.0%) 14 (70.0%) 32 (69.6%) 99 (60.7%)
Age mean (sd) 45.7 (6.4) 36.7 (9.2) 39.6 (10.1) 34.4 (8.3) 38.5 (8.4) 41.2 (10.9) 39.41 (9.8)
Single 11 (61.1%) 25 (86.2%) 25 (83.3%) 16 (80.0%) 17 (85.0%) 40 (87.0%) 134 (82.2%)
Education
None 5 (27.8%) 5 (3.1%)
Elementary 2 (11.1%) 16 (55.2%) 9 (30.0%) 2 (10.0%) 9 (45.0%) 3 (6.5%) 41 (25.2%)
Secondary 10 (55.6%) 11 (37.9%) 17 (56.7%) 14 (70.0%) 7 (35.0%) 30 (65.2%) 89 (54.6%)
Higher 1 (5.6%) 2 (6.9%) 4 (13.3%) 4 (20.0%) 4 (20.0%) 13 (28.3%) 28 (17.2%)
Employment
In work 5 (27.8%) 1 (3.8%) 3 (10.0%) 3 (15.0%) 1 (5.0%) 3 (6.5%) 16 (10.0%)
Unemployed 7 (38.9%) 9 (34.6%) 3 (10.0%) 11 (55.0%) 6 (30.0%) 3 (6.5%) 39 (24.4%)
Social security benefits 6 (33.3%) 16 (61.5%) 24 (80.0%) 6 (30.0%) 13 (65.0%) 40 (87.0%) 105 (65.0%)
correlation between stigma from health professionals [factor 3] and self-stigma [factor 4].
Intra-class correlation coefficients for test-retest reli-ability for each factor were as follows: informal networks [ICC 0.76 [IC 95% 0.67 -0.83]]; socio-institutional [ICC 0.62 [IC 95% 0.49-0.73]]; health professionals [ICC 0.62
[IC 95% 0.48-0.72]]; and self-stigma [ICC 0.74 [IC 95% 0.64-0.81]].
There were no significant differences in scoring with sex or age. Descriptively, service users in Argentina had the highest scores on almost all dimensions. As noted above, our study was not powered to explore differences Table 2 Pattern matrix for the MARISTAN Stigma Scale
Item Informal
networks
Socio
-institutional
Health professionals
Self-stigma
10 I have been hidden away by my family 0,76 −0,10 0,01 −0,02
16 Due to my illness people close to me have become more distant 0,60 0,02 0,03 −0,08
8 My family doesn’t take me seriously 0,59 0,14 0,06 −0,03
15 People look at me as if I am odd 0,57 0,08 −0,06 0,18
18 People always expect me to behave and talk in an odd way 0,57 −0,04 −0,06 −0,01
12 My family is afraid of me 0,56 −0,20 −0,07 0,02
19 People don’t respect me 0,56 0,04 0,09 0,00
9 I have been ill-treated by my family (abandoned, locked in my own home, etc.). 0,48 −0,15 0,13 0,11
7 My family criticises me for everything 0,45 0,11 0,07 0,04
20 People are not tolerant with me 0,44 0,11 0,16 0,08
11 My family hides my illness from others 0,40 −0,02 0,00 0,20
29 Health Problems of people with mental health problems are not taken seriously, as they tend to be understood as part of the mental illness
0,12 0,66 −0,17 −0,14
28 The opinion of people with mental health problems is not so well considered whenever decisions about their treatment (hospital admission) are taken, unlike in the case of other illnesses
0,05 0,62 −0,02 −0,13
35 There are not enough services for people with mental health problems −0,09 0,58 0,12 −0,05
31 Mental health services have fewer staff than other health services −0,30 0,57 0,13 0,18
26 Medical services try to avoid having to deal with people with mental health problems
0,10 0,55 0,05 −0,02
27 The emergency services don’t look after people with mental health problems in the same way as people with other illnesses.
0,09 0,53 −0,01 0,04
33 Government policy has not supported the development of mental
health services compared to other health services −
0,12 0,46 0,06 0,13
14 People use unpleasant words when talking about people with mental health problems
0,19 0,43 −0,14 0,06
34 Mental health law excessively restricts the rights of people with mental
health problems −
0,11 0,42 −0,08 0,23
30 Mental health facilities are in a worse state than other health service facilities. −0,12 0,41 0,22 0,14
21 The media portray a poor image of people with mental health problems 0,36 0,40 −0,09 −0,11
32 Psychiatric medication is not as well funded as medication for other illnesses −0,14 0,36 0,25 −0,08
23 Mental health professionals are cold and impersonal towards me 0,11 −0,10 0,84 −0,01
22 General practice staff are cold and impersonal towards me −0,02 −0,02 0,76 −0,02
24 Professionals from the emergency services are cold and impersonal towards me
0,10 0,20 0,53 −0,06
25 Professionals in psychiatric units are cold and impersonal towards me 0,08 0,27 0,33 −0,04
2 The illness makes me feel inferior 0,09 −0,20 0,11 0,76
1 I avoid relating to others because I feel different 0,03 0,02 −0,05 0,67
3 I’m afraid that I might disappoint others 0,05 0,13 −0,11 0,61
5 At times I think that I am not normal 0,11 0,22 −0,08 0,42
in scoring between countries. However, for informal networks [Factor 1] this score was significantly higher than in Spain, Brazil and the UK; for socio-institutional stigma [Factor 2] this was higher than in the UK, Spain or Portugal; and for the factor health professionals stigma [Factor 3] the difference was significant in com-parison to all the other countries [Table 4).
Discussion
We have developed a reliable instrument to measure the stigma of severe mental illness across six countries, and its cross-cultural, bottom-up development provides the validity needed to compare different dimensions of the stigma across cultures. It has moderate to high internal consistency [Cronbach’s Alpha 0.89] and moderate test-retest reliability [ICC 0.77]. There are four factors in the scale, namely ‘informal networks’, ‘socio-institutional’,
‘health professionals’and ‘self-stigma’. However, because of highly variable correlations between them we recom-mend using the four separate subscale scores rather than
a total score from the sum of all of them. Given that the
‘self-stigma’subscale contains only four items, it could also be argued that an alternative scale (e.g. Ritsher et al.) [21] should be used if this were the main focus of a study. However, it is worth cautioning that test-retest reliability of this instrument was assessed in only 16 participants.
The questionnaire was applied by interviewers to make sure the items were understood and to help with any diffi-culties. Although this increased both time and costs asso-ciated with its application, it standardized data collection in diverse contexts, where the cultural background of the patients was very different. It now needs to be tested in a pure self-report format.
Social networks
Patients’social networks can be both a source of support and of stigma. Stigma complicates recovery and reduces self- esteem. When it arises in a person’s close relation-ships, it can have a severe knock-on effect on the take-up of opportunities for work, use of services, symptoms, hospitalization, trajectory of the illness, and quality of life. Although the family may be victim of stigma because one of its members has a mental illness [20], family members themselves can hold stigmatizing attitudes. The relation-ship between both processes is not yet clear; however recent research indicates that as people with schizophre-nia become increasingly isolated, their family becomes the closest and most important support network. This may mean that patients are focused on this intimate relation-ship, even when it risks becoming a source of difficulties
Table 4 MARISTAN Stigma Scale–Factor scores by demography [Mean item score and (sd)]
Informal networks Socio-institutional Health professionals Self-stigma
M(SD) F M(SD) F M(SD) F M(SD) F
Total sample 2.9 (1.3) 3.7 (1.3) 2.5 (1.5) 3.7 (1.7)
Gender
Men 2.8 (1.3) 0.55 3.7 (1.3) 0.06 2.6 (1.5) 0.28 3.6 (1.6) 1.34
Women 3.0 (1.4) 3.6 (1.3) 2.5 (1.6) 3.9 (1,9)
Age group
18-29 2.4 (1.1) 2.50 3.5 (1.4) 0.73 2.2 (1.4) 1.93 3.5 (1.4) 1.43
30-39 2.8 (1.4) 3.6 (1.4) 2.5 (1.5) 3.4 (1.6)
40-49 3.2 (1.3) 3.9 (1.3) 2.8 (1.6) 3.9 (1.8)
50 and more 3.0 (1.3) 3.6 (1.2) 2.0 (1.3) 4.1 (1.8)
Country
Argentina 3.9 (1.2) 3.10* 4.7 (0.8) 3.36** 3.9 (1.1) 4.28** 4.1 (1.9) 2.08
Brazil 2.6 (1.2) 3.9 (1.5) 2.6 (1.7) 3.5 (1.8)
Chile 3.2 (1.4) 4.0 (1.1) 2.7 (1.5) 4.4 (1.5)
Portugal 2.9 (1.4) 3.6 (1.3) 2.3 (1.2) 3.2 (1.3)
Spain 2.6 (1.1) 3.3 (1.3) 2.6 (1.3) 3.2 (1.7)
UK 2.7 (1.3) 3.3 (1.4) 2.0 (1.5) 3.6 (1.8)
*p < 0.05; **p < 0.01; ***p < 0.001.
Table 3 Pearson correlation between the MARISTAN Stigma Scale total score and factor scores
Informal networks
Socio
-institutional Health professionals
Self
-stigma
Informal networks 1.00 0.42*** 0.31*** 0.49***
Socio-institutional 1.00 0.41*** 0.32***
Health professionals 1.00 0.18*
Self-stigma 1.00
[33]. Few scales cover this issue in detail and it might be most relevant in societies with a lesser developed commu-nity mental health system.
Stigma in the area of professional care
Unfortunately, formal care givers appear to be an im-portant source of stigma. Two of the factors [socio-insti-tutional and stigma from health professionals] touched on this source of stigma. Thus it may be important to in-clude both the system and professionals when developing strategies to reduce stigma. A frequent complaint against health professionals concerns their attitudes, while per-ceptions of socio-institutional stigma concern processes of care and scarcity of resources. The latter requires political and public health solutions in each country. Stigma arising from professionals and institutions may be less likely to be experienced by patients with less than three years of illness or those who have never been institutionalised. One modification when applying the Maristán scale to this group is to use only the subscales ‘informal social networks’ and ‘self-stigma’, both of which were strongly correlated with each other and both of which tapped important, albeit incomplete elements, of perceived stigma in this group of people.
The relation between stigma and the demand for mental health care does not appear to be direct. A number of authors have suggested that perceived stigma may not affect demand for mental health care in particular popula-tions, but this may vary with the characteristics of the population affected [46]. Furthermore, people with schizo-phrenia are in long-term contact with specialized services and if they perceive stigma arising from such institutions and from health professionals, specific measures need to be taken to address it.
Both families and professionals were sources of stigma. Previous research is contradictory on this issue. There have been suggestions that close interaction with patients will reduce stigmatising or negative attitudes [47], how-ever more recent research indicate that those with the closest contact may be the most discriminating of all [33]. Thus, we need closer study of just how the degree of intimacy leads to an increase or decrease in stigma.
Types of stigma and scoring
Of the four factors we derived, three identify sources of stigma, while self-stigma, one of the most commonly found in other instruments to measure stigma [12,21], is the internalization of the public stigma; it is the experience of the self [17]. Our qualitative work however, showed that the other three areas of stigma were of much greater concern to patients and carers and thus this section of the scale is brief. The items in the self-stigma subscale capture internalized or subjective stigma and they reflect the preju-dice which people with mental illness may turn against
themselves [21], rather than explicit behaviours which give rise to discrimination. Although it includes a general item
“people don’t respect me”, stigma perceived as arising from informal social networks included mainly family and other close persons and reflects the limited social networks which patients with psychotic mental illness can depend on. The fact that both factors [self-stigma and informal networks] are the most stable over time and have the greatest intra-factor correlation suggests they are closely related.
As opposed to other scales [14] there were no positive elements associated with suffering a severe mental illness. This may reflect the way in which the qualitative data were collected. In focus group discussions about stigma; patients and carers may be most concerned about dis-cussing what is wrong in their lives rather than what is going well.
Users of services in Argentina, a country where psy-chiatric care is still largely concentrated in hospitals, had higher (worse) mean scores on the factors‘informal net-works’,‘socio-institutional’and‘health professionals’than users in the United Kingdom, Spain, Portugal and Brazil, where community care appears to be better developed. This suggests that community based service provision is less stigmatising and professionals’ attitudes are less institutionalised and hierarchical, than in hospital based services.
Limitations
There are a number of limitations to our study. First, the instrument has been tested in patients in contact with mental health services, a population that may have different perceptions of stigma than those who have no contact with services. Second, the questionnaire was val-idated in a relatively middle aged population that had been in contact with community services for a mean of over 12 years but had not had experience of long stay hospital care. We explain our reasons for that above. Third, the interviewers noted that a 5 point response scale might be simpler and thus the pattern of scoring may be revised in later testing of the instrument. Finally although we did not include any measure of criterion validity, we omitted this for two reasons: 1. No stigma scale exists that has universal application across these six cultures and 2. We believe that its multicultural, bottom-up development provides the validity needed.
Future work
Conclusion
The MARISTAN stigma scale is a reliable measure of the stigma of schizophrenia and related psychoses across several cultures. A confirmatory factor analysis is needed to assess the stability of its factor structure.
Competing interests
The authors declare that they have no competing interests.
Authors’contributions
FT-G, MK, SS, MX, EG, JMC, AR-G, BV: Conceived of and designed the study. MK, HK, RG, AR-G, MX, PG, CA, DAB: Coordinated the collection of data in each country. SS and MK: wrote the article and PG worked on the draft. FT-G, EG, BV, JMC, AR-G, MX, PG, CA, DAB: Gave final approval of the version to be published. RM: undertook the statistical analysis and helped to interpret the findings. All authors read and approved the final manuscript.
Acknowledgements
We are grateful to all the patients, carers and professionals who took part and also to Dr Dominic Bishop. We are also grateful for support from the Pan-American Health Office (PAHO), Camden and Islington NHS Foundation Trust and University College London (UCL).
Author details
1Department of Psychiatry and Mental Health, Faculty of Medicine, University
of Concepcion, Concepcion, Chile.2Department of Pedagogy, University of
Jaen, Jaen, Spain.3Department of Psychology, Faculty of Social Sciences,
University of Concepcion, Concepcion, Chile.4Centre of Bio-Medical Research
in Network of Mental Health (CIBERSAM), Section of Psychiatry and Medical Psychology, University of Granada, Granada, Spain.5Faculty of Medical
Sciences, University Nova of Lisbon, Lisbon, Portugal.6Department of
Community Health, University National of Lanus, Buenos Aires, Argentina.
7University State of Londrina, Londrina, Brazil.8Division of Psychiatry, Faculty
of Brain Sciences, UCL Medical School, London, UK.9Camden and Islington
NHS Foundation Trust, London, UK.
Received: 30 July 2013 Accepted: 4 June 2014 Published: 18 June 2014
References
1. Link BG, Phelan J:Conceptualizing stigma.Annu Rev Sociol2001, 27:363–385.
2. Rüsch N, Corrigan P, Wassel A, Michaels P, Larson JE:Self-stigma, group identification, perceived legitimacy of discrimination and mental health service use.Br J Psychiatry2009,195:551–552.
3. Karidi MV, Stefanis C, Theleritis C, Tzedaki M, Rabavilas A, Stefanis N: Perceived social stigma, self-concept, and self-stigmatization of patient with schizophrenia.Compr Psychiatry2010,51:19–30.
4. Corrigan PW, Sokol KA, Rüsch N:The Impact of Self-Stigma and Mutual Help Programs on the Quality of Life of People with Serious Mental Illnesses.Community Mental Health J2013,49:1–6.
5. Thornicroft G, Brohan E, Rose D, Sartorius N, Leese M, INDIGO Study Group: Global pattern of experienced and anticipated discrimination against people with schizophrenia: A cross cultural survey.Lancet2009, 373:408–415.
6. Arboleda-Flórez J:Stigma and discrimination: An overview. World Psychiatry2005,4:8–10.
7. Bauman AE, Rocjter L, Belevsla D, Zäske H, Gaebel W, Niklewski G, Bajraktarov S, Ortakov V, Wahlberg H:Attitudes of the public towards people with schizophrenia: comparison between Macedonia and Germany.World Psychiatry2005,4:55–57.
8. Bhugra D:Severe mental illness across cultures.Acta Psychiat Scand2006, 113:17–23.
9. Link BG, Mirotznik J, Cullen FT:The effectiveness of stigma coping orientations: can negative consequences of mental illness labelling be avoided?J Health Soc Behav1991,32:302–320.
10. Knifton L, Gervais M, Newbigging K, Mirza N, Quinn N, Wilson N, Hunkins-Hutchison E:Community conversation: addressing mental health stigma with ethnic minority communities.Soc Psychiatry Psychiatr Epidemiol2010,45:497–504.
11. Schomerus G, Schwahn C, Holzinger A, Corrigan PW, Grabe HJ, Carta MG, Angermeyer MC:Evolution of public attitudes about mental illness: A systematic review and meta-analysis.Acta Psychiatr Scand2012, 125:440–452.
12. Stuart H, Milev R, Koller M:The inventory of stigmatizing experiences: its development and reliability.World Psychiatry2005,4:35–39.
13. Wahl OF:Mental health consumers’experience of stigma. Schizophr Bull1999,25:467–478.
14. King M, Dinos S, Shaw J, Watson R, Stevens S, Passetti F, Weich S, Serfaty M: The Stigma Scale: development of a standardised measure of the stigma of mental illness.Br J Psychiatry2007,190:248–254.
15. Loch AA, Guarniero FB, Lawson FL, Hengartner MP, Rossler W, Gattaz WF, Wang YP:Stigma toward schizophrenia: do all psychiatrists behave the same? Latent profile analysis of a national sample of psychiatrists in Brazil.BMC Psychiatry2013,13:92.
16. Dinos S, Stevens S, Serfaty M, Phil M, Weich S, King M:Stigma: the feelings and experiences of 46 people with mental illness.Br J Psychiatry2004, 184:176–181.
17. Jenkins JH, Carpenter-Song EA:Awareness of Stigma Among Persons with Schizophrenia Marking the Contexts of Lived Experience.J Nerv Ment Dis 2009,197(7):520–529.
18. Williams CC:Insight, Stigma, and Post-Diagnosis Identities in Schizophrenia.Psychiatry2008,71(3):246–256.
19. Watson A, Corrigan P, Larson J, Sells M:Self-stigma in people with mental illness.Schizophr Bull2007,36:1312–1318.
20. Hasson-Ohayon I, Levy I, Kravetz S, Vollanski-Narkis A, Roe D:Insight into mental illness, self-stigma, and the family burden of parents of persons with a severe mental illness.Comp Psychiatry2011,52(1):75–80. 21. Ritsher JB, Poorni GO, Grajales M:Internalized stigma of mental illness:
Psychometric properties of a new measure.Psychiatry Res2003, 121:31–49.
22. Lundberg B, Hansson L, Wentz E, Bjorkman T:Sociodemographic and clinical factors related to devaluation/discrimination and rejection experiences among users of mental health services.Soc Psychiatry Psychiatr Epidemiol2007,42:295–300.
23. Alonso J, Buron A, Rojas-Farrera S, De Graap J, Haro JM, De Girolamo G, Bruffaerts R, Kovess V, Matschinger H, Vilagut G:Perceived stigma among individuals with common mental disorders.J Affect Disord2009, 118:180–186.
24. Bagley C, King M:Exploration of three stigma scales in 83 users of mental health services: Implication for campaigns to reduce stigma.J Men Heal 2005,14:343–355.
25. Üçok A, Brohan E, Rose D, Sartorius N, Leese M, Yoon CK, Plooy A, Ertekin BA, Milev R, Thornicroft G:The INDIGO Study Group. Anticipated discrimination among people with schizophrenia.Acta Psychiatr Scand 2012,125:77–83.
26. Brohan E, Slade M, Clement S, Thornicroft G:Experiences of mental illness stigma, prejudice and discrimination: a review of measures.BMC Health Serv Res2010,10:80.
27. Angermeyer M, Beck M, Deitriech S, Holzinger A:The stigma of mental illness: patients’anticipations and experiences.Int J Soc Psychiatry2004, 50:153–162.
28. Schulze B, Angermeyer M:Subjective experiences of stigma. A focus group study of schizophrenic patients, their relatives and mental health professionals.Soc Sci Med2003,56:299–312.
29. Schomerus G, Matschinger H, Kenzin D, Breier P, Angermeyer MC: Public attitudes towards mental patients: a comparison between Novosibirsk. Bratislava and German cities.Eur Psychiat2006, 21:436–441.
30. Kurihara T, Kato M, Sakamoto S, Reverges R, Kitamara T:Public attitudes towards the mental ill: a cross-cultural study between Bali and Tokyo. Psychiatry Clin Neurosci2000,54:547–552.
31. Cheon B, Chiao J:Cultural variation in implicit mental illness stigma. J Cross Cult Psychol2012,43:1058–1062.
32. Lauber C, Rössler W:Stigma towards people with mental illness in developing countries in Asia.Int Rev Psychiatry2007,19(2):157–178. doi:10.1080/09540260701278903.
34. Torres-Gonzalez F, Runte-Geidel A, Antonioli C, Wagner LC, Ballester D, de Almeida JM C, Galende E, Vicente B, Xavier M, Gómez-Beneyto M, King M, Saldivia S:Standardized measures of needs, stigma and informal care in schizophrenia using a bottom-up, cross-cultural approach.Ment Health Fam Med2012,9:125–134.
35. Wagner LC, King M:Existential needs of people with psychotic disorders in Porto Alegre. Brazil.Br J Psychiatry2005,186:141–145.
36. Afifi AA, Clark V:Computer–aided multivariate analysis.3rd edition. Chapman
& Hall/CRC: Florida; 1999.
37. Hair JF, Black WC, Babin BJ, Anderson RE, Tatham RL:Multivariate data analysis.6th edition. New Jersey: Prentice Hall; 2005.
38. Tabachnick BG, Fidell LS:Using multivariate statistics.5th edition. Boston: Allyn and Bacon; 2006.
39. Buja A, Eyuboglu N:Remarks on parallel analysis.Multivar Behav Res1992, 27:509–540.
40. Lattin J, Carroll JD, Green PE:Analyzing multivariate data.Belmont, CA: Duxbury; 2003.
41. Thompson B:Exploratory and confirmatory factor analysis.Washington DC: American Psychological Association; 2005.
42. Floyd FJ, Widaman KF:Factor analysis in the development and refinement of clinical assessment instruments.Psychol Assess1995, 7:286–299.
43. Hong S, Mitchell SK, Harshman RA:Bootstrap scree tests: a Monte Carlo simulation and applications to published data.Br J Math Stat Psychol 2006,59:35–57.
44. O’Connor BP:SPSS and SAS programs for determining the number of components using parallel analysis and Velicer’s MAP test.Behav Res Methods Instrum Comput2000,32:396–402.
45. Reise SP, Waller NG, Comrey AL:Factor analysis and scale revision. Psychol Assess2000,12:287–297.
46. Golberstein E, Eisenberg D, Gollust S:Perceived stigma and mental health care seeking.Psychiatr Serv2008,59:392–399.
47. Pinto-Foltz M, Logsdon M:Reducing Stigma Related to Mental Disorders: Initiatives, interventions, and recommendations for nursing.
Arch Psychiatr Nurs2009,23:32–40.
doi:10.1186/1471-244X-14-182
Cite this article as:Saldiviaet al.:The Maristán stigma scale: a
standardized international measure of the stigma of schizophrenia and other psychoses.BMC Psychiatry201414:182.
Submit your next manuscript to BioMed Central and take full advantage of:
• Convenient online submission
• Thorough peer review
• No space constraints or color figure charges
• Immediate publication on acceptance
• Inclusion in PubMed, CAS, Scopus and Google Scholar
• Research which is freely available for redistribution