High Resolution Zero Degree Electron Spectroscopy of
Argon Ions through Carbon Foil
M. Imai1, M. Sataka2, K. Kawatsura3, K. Takahiro3,4, K. Komaki5, and H. Shibata1
1 Department of Nuclear Engineering, Kyoto University, Sakyo, Kyoto 606-8501, Japan
2Department of Materials Science, Japan Atomic Energy Research Institute, Tokai, Ibaraki 319-1195, Japan 3 Department of Chemistry and Materials Technology,
Kyoto Institute of Technology, Sakyo, Kyoto 606-8585, Japan
4II. Institute of Physics, University of G¨ottingen, Friedrich-Hund-Platz 1, D-37077 G ¨ottingen, Germany 5Institute of Physics, Graduate School of Arts and Sciences, University of Tokyo, Meguro, Tokyo 153-8902, Japan
Received on 29 July, 2005
Electrons emitted from high Rydberg states formed by penetration of 2.0 MeV/u Ar6,13,14,15+ions through C-foil targets of various thicknesses (4.0 - 20 µg/cm2) have been measured with high resolution utilizing zero-degree electron spectroscopy. Intense series of Coster-Kronig peaks due to Ar14+ 1s22p(2P3/2,1/2)nl
-1s22s(2S1/2)εl′ and Ar13+ 1s22s2p(3P2,1,0)nl - 1s22s2 (1S0)εl′ transitions, in which the principal quantum
number,n, starts at 10 and increases with increasing peak energy, have been observed for every combination of initial charge state and foil thickness, and quite a few number of other peaks remain unassigned in the electron energy region investigated. Intensities of each series of Coster-Kronig electron peaks follow then−3law. The
mean charge states after the foil penetration have been found to be the same within 10% uncertainty and the to-tal intensity of the Coster-Kronig transitions including Ar15+1s22p(2P) and Ar14+1s22s2p(3P) cores have also been found to remain constant for all the collision systems investigated. The total Ar15+1s22p(2P) population derived fromn=10 transition peaks is found to be almost the same as those of Ar14+1s22s2p(3P), which is in contrast to the ratio of Ar15+to Ar14+fractions measured downstream the foil.
Keywords: Rydberg state; Coster-Kronig transition; Charge state; Density effect
I. INTRODUCTION
Dynamic properties of the collision processes inside a solid target have been one of the major interests in ion-solid inter-actions and the penetration of ions through solid target has been investigated in many aspects. A cusp-shaped secondary electron peak in the forward direction and a series of electron peaks emitted from Rydberg states of fast projectile can also be observed in much simpler gas collisions. In the ion-solid collision, on the contrary, more intense series of Coster-Kronig (C-K) electron peaks from Rydberg states have been observed than expected by Coulomb capture of target elec-tron or by bound-bound excitation of projectile elecelec-trons at the last layer collisions on the exit surface, although the Ry-dberg state can not survive inside the solid because the or-bital radius of Rydberg electron is far larger than the lattice spacing of the solid target [1]-[3]. This indicates that the Ry-dberg states are formed upon or near the exiting surface of the solid, capturing electrons which have been accumulated to follow the projectile at the same velocity by being released from projectile bound states or captured from the target dur-ing foil penetration. A model for producdur-ing such Rydberg or convoy electrons has been introduced by Rothermel et al. [1] and concluded by Burgd¨orfer and Bottcher [4] as a three-step transport model. In their model, electrons in near-threshold projectile continuum move at the projectile velocity while in-side solids and, upon leaving the foil, a part of such electrons are re-captured to form the Rydberg states, shaken by a sudden switch of projectile potential from screened to bare Coulomb potential. Consequently, the formation of the Rydberg states is inferred to be strongly related to that of the “cusp”
elec-trons, depending on whether the electron is captured to bound states or stays on the continuum state.
So far the zero-degree electron spectroscopy [5],[6] has been proven to be a powerful tool to study these Rydberg state ions consisting of the excited ion core and Rydberg electron, through observing the C-K electrons ejected at zero degrees with high resolution. Another advantage in precise measure-ments of C-K electron energy is that the ion configurations inside the solid can partly be probed by identifying the core configurations of the observed Rydberg states. Moreover, as C-K electron energy can be determined free from contact po-tentials of the surrounding equipments by zero-degree elec-tron spectroscopy, non-equilibrium collision phenomena can be investigated using a very thin foil as target.
foil targets.
II. EXPERIMENTS
The present experiments were performed at the tandem ac-celerator facility at the Japan Atomic Energy Research Insti-tute (JAERI), Tokai. As the detailed description of the ex-perimental apparatus has been presented previously [7]-[12], only some major parameters are given here. A beam of 80 MeV (2.0 MeV/u) Ar6+ ion was obtained from the tandem accelerator using the terminal ECR ion source [13]. The pri-mary Ar6+or post-stripped Arq+(q=13-15) ions were guided into the target foils inside a collision chamber kept at the base pressure of 10−8 Torr and finally collected at a Fara-day cup. Electrons emitted from the projectile ions passing through self-supported C-foil targets of 4.0 - 20µg/cm2were energy-analyzed with a tandem electrostatic analyzer located at zero degrees with respect to the ion beam direction. The electron-pass energy for the second analyzer was set at 50 eV to improve the resolution and also to keep its transmis-sion constant. Electron spectra in the laboratory frame were obtained by scanning the retarding potential between the first and the second analyzers with 1 or 0.5 eV steps for a fixed integrated ion beam current at the Faraday cup. The observed electron spectra were dominated by the so-called cusp peak at around 1.11 keV and a series of Coster-Kronig electron peaks was superposed on the low and high energy wings of the cusp, corresponding to the backward and forward ejected electrons, respectively, from the moving projectile (see Fig. 1(a) or Fig. 1 of the reference [11]). Two spectra for the backward and forward ejected electrons were obtained by converting data points into the projectile rest frame from the laboratory frame (Bw and Fw spectra (raw) in Fig. 1(b)). This conversion re-sulted in the energy resolution of∼0.3 eV for the electron en-ergy region of our interest (∼15 eV) including the spectrome-ter’s resolution. The spectrum from the high energy wing has an almost constant background which comes from a part of the cusp electrons, meanwhile the low energy wing spectrum has an additional background coming from soft collisions. Af-ter subtracting these backgrounds, these two spectra have been found to be practically the same in peak energies and intensity distributions (Bw and Fw spectra (bg) in the Fig. 1(b)), show-ing that the transmission of our electron analyzer system re-mains constant in the present energy region. The combination of the projectile charge states and the target foil thicknesses studied are shown in table I with the precise centroid energy values of the cusp.
III. RESULTS AND DISCUSSION
The beam current in the Faraday cup is found to be the same within 10% uncertainty in switching the target foil thickness for all the charge states investigated. Our separate measure-ment of the charge state distribution and mean charge state for 2.0 MeV/u S6+ion through carbon foil target [14] shows that the projectile mean charge state rapidly grows until 5µg/cm2
FIG. 1: (a) Electron energy spectrum in the laboratory frame for 80 MeV (2.0 MeV/u) Ar6+ion passing through a 4.0µg/cm2 carbon-foil measured at zero degrees. (b) Electron energy spectra trans-formed into the projectile rest frame. Thin dotted curves corre-spond to the energy spectra from the forward and backward (de-noted Fw and Bw, respectively) ejections, and the solid curves are background-subtracted spectra. (c) Background-subtracted electron energy spectrum ejected at zero-degrees from 80 MeV Ar6+ ion transmitted through 4.0µg/cm2 carbon-foil. Energy refers to the projectile rest frame. Five series of repetitive peaks are assigned to originate from Coster-Kronig transitions Ar14+1s22p(2P3/2,1/2)nl
-1s22s(2S1/2)εl′ for (a), (a’) and Ar13+ 1s22s2p(3P2,1,0)nl - 1s22s2
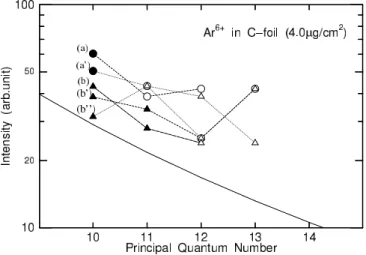
FIG. 2: Dependence of the Coster-Kronig peak intensity on the prin-cipal quantum numbernof the Rydberg electron emitted from 2.0 MeV/u Ar6+ion penetrating through a 4.0µg/cm2carbon foil. Full symbols denote well-separated peak intensities, while open symbols denote combined ones. Marks (a), (a’), (b), (b’) and (b”) denote Coster-Kronig transition series as indicated in the text and Fig. 1(c). Full line shows then−3dependence.
FIG. 3: Coster-Kronig peak intensity ofn=10 transitions after back-ground subtraction. Marks (a), (a’), (b), (b’) and (b”) denote C-K transition series as indicated in the text and in Fig. 1(c).
TABLE I: The combination of the projectile charge states and the tar-get foil thicknesses investigated in the present work. Also tabulated are the centroid energy values of the cusp for each measurement. The data with the same symbols (daggers, double daggers and sec-tion symbols) were obtained within the same machine time period.
Projectile Target Foil Centroid Energy Charge State Thickness of the Cusp
(µg/cm2) (keV) 6+ 4.0 1.1086† 6+ 10 1.1070† 13+ 6.9 1.1018‡ 13+ 10 1.1030§ 13+ 20 1.1015§ 14+ 6.9 1.1026‡ 14+ 10 1.1037§ 15+ 10 1.1030§
and then attains equilibrium values. The same beam current after foil penetration indicates that the projectile mean charge state reaches an equilibrium value within all target thicknesses studied even for the Ar6+projectile. We therefore assume that the measured electron spectra in the laboratory frame and the derived projectile rest frame (P-frame) spectra can be normal-ized to within 10% by the integrated Faraday cup currents, regardless of the projectile charge state or the foil thickness. In Fig. 1(c) the high energy wing of the electron energy spec-tra is shown, converted into the P-frame and background sub-tracted, from 2.0 MeV/u Ar6+traveling through a carbon foil of 4.0µg/cm2in thickness. The repetitive peaks are assigned to originate from 5 series of Coster-Kronig (C-K) transitions, indicated by the vertical bars marked (a), (a’), (b), (b’) and (b”) in the figure. Each series comes from transitions of
(a) Ar14+1s22p(2Po3/2)nl- 1s22s(2S1/2)εl′, (35.04eV) (a’) Ar14+1s22p(2Po1/2)nl- 1s22s(2S1/2)εl′, (31.87eV) (b) Ar13+1s22s2p(3Po
2)nl- 1s22s2(1S0)εl′, (31.33eV) (b’) Ar13+1s22s2p(3Po
1)nl- 1s22s2(1S0)εl′, (29.24eV) (b”) Ar13+1s22s2p(3Po
0)nl- 1s22s2(1S0)εl′, (28.35eV) where the principal quantum number,n, of the Rydberg elec-trons starts at 10 and increases with increasing peak energy for each series. The energy values in parenthesis give the series limits. The marked energies are obtained with the formula
taken from the high energy wings of the 8 measured electron spectra tabulated in the table I also show significant contri-butions from the 5 C-K transitions identified above. How-ever, the spectra also show the presence of a few further peaks which remain unassigned within the present investigated en-ergy range. These assignments indicate that at least Ar15+ 1s22p(2P) and Ar14+1s22s2p(3P) states play an important role for argon ion in penetrating through carbon foils in near equi-librium thickness region.
FIG. 4: Cusp electron intensity (left-side axis; full symbols) and summed Coster-Kronig electron peak intensity (right-hand axis; open symbols) for Ar6,13,14,15+ions after penetrating carbon foil
tar-gets of 4.0 - 20µg/cm2. Full line denotes cusp intensity, and long and short dashed lines denote summed Coster-Kronig peak intensity for the initial states of Ar14+ 1s22p(2P)10l((a)+(a’) in the text for
n=10) and Ar13+1s22s2p(3P)10l ((b)+(b’)+(b”) forn=10), re-spectively.
These repetitive peaks of C-K electrons are found to follow then−3law, as illustrated in Fig. 2, as has been pointed out by Breinig et al. [16]. Taking into account that some very closely located C-K peaks appear as a combined peak, such asn=11 of (a’) andn=11 of (b”), well-separated peaks and appropri-ate division of combined peak heights lead us to then−3law. It can be seen in Figs. 1(c) and 2 that then=10 peaks are well-separated for all the 5 C-K series and their peak height can be an index to describe the collision phenomena. From this point of view, then=10 peak heights taken from the (background subtracted) P-frame spectra are plotted in Fig. 3 versus the foil thickness. According to the three-step transport model, the population of the Rydberg state is ruled both by the popu-lation of appropriate ion core state(s) and the intensity of the near-threshold continuum electrons traveling within the solid alongside the projectile (the entrained electrons), because the number of the entrained electrons is not large enough to form the Rydberg state on every possible occasion. It is clear that the number of the entrained electrons is strongly correlated with the cusp electron yields. Fig. 4 plots cusp electron inten-sity measured in the laboratory frame (Fig. 1(a)) and summed
FIG. 5: Population of Ar15+1s22p(2P) and Ar14+1s22s2p(3P) states derived by the intensities of Coster-Kronig and cusp electron peaks for Ar6,13,14,15+ions after penetrating carbon foil targets of 4.0 - 20
µg/cm2.
intensities ofn=10 C-K peaks over differentJvalues of the Ar15+and Ar14+cores (for (a)+(a’) and (b)+(b’)+(b”), respec-tively) as functions of the foil thickness. The C-K peak inten-sity for each initial charge state was found to show very good agreement with the cusp intensity. These facts imply that the entrained electron intensity exerts a major influence compared to the ion core population on the Rydberg peak intensity, and the Ar15+ 1s22p(2P) and Ar14+1s22s2p(3P) ion core popu-lations seem to take nearly the same values except for Ar15+ core for Ar15+incidence (Fig. 5). This result is consistent with our separate measurement of charge fractions of 2.0 MeV/u S ions penetrating carbon foils [14], which concluded that the processes involving L-shell electrons are equilibrated within the target thickness of∼5µg/cm2and the charge equilibration beyond this thickness is ruled by K-shell processes. Compari-son of the peak intensities of (a) and (a’) for Ar13+projectile at foil thickness 10 and 20µg/cm2(Fig. 3) gave a tentative sce-nario that the spin quantum number of the L-shell electrons (J for coupled states) increased during the continual excitation of the electrons through collisions with the target electrons. The total intensity of (a) and (a’) were found to remain constant as the target thickness increased from 10 to 20µg/cm2as did the total and relative intensities of (b), (b’) and (b”).
frac-tion after exiting the foil target [17]. This would constitute another qualitative proof that the projectile charge states shift
downwards upon exiting the solid.
[1] J. Rothermal, H.-D. Betz, F. Bell, and V. Zacek, Nucl. Instr. and Meth194, 341 (1982).
[2] H.-D. Betz, J. Rothermal, D. R¨oschenthaler, F. Bell, R. Schuch, and G. Nolte, Phys. Lett.91A, 12 (1982).
[3] Y. Yamazakiet al., Phys. Rev. Lett.61, 2913 (1988).
[4] J. Burgd¨orfer and C. Bottcher, Phys. Rev. Lett.61, 2917 (1988). [5] N. Stolterfoht, Phys. Rep.146, 315 (1987).
[6] A. Itoh, T. Schneider, G. Schiwietz, Z. Roller, H. Platten, G. Nolte, D. Schneider, and N. Stolterfoht, J. Phys. B16, 3965 (1983).
[7] K. Kawatsuraet al., Nucl. Instr. and Meth. B53, 421 (1991). [8] M. Imai, M. Sataka, Y. Yamazaki, K. Komaki, K. Kawatsura,
and Y. Kanai, Physica ScriptaT73, 93 (1997).
[9] M. Sataka, M. Imai, K. Kawatsura, K. Komaki, H. Tawara, A. Vasilyev, and U. I. Safronova, J. Phys. B16, 267 (2002). [10] M. Sataka, M. Imai, K. Kawatsura, K. Komaki, H. Tawara, A.
Vasilyev, and U. I. Safronova, Phys. Rev. A65, 052704 (2002). [11] M. Imai, M. Sataka, S. Kitazawa, K. Komaki, K. Kawatsura, H. Shibata, H. Tawara, T. Azuma, Y. Kanai, and Y. Yamazaki, Nucl. Instr. and Meth. B193, 674 (2002).
[12] K. Kawatsura, K. Takahiro, M. Imai, M. Sataka, K. Komaki, and H. Shibata, Nucl. Instr. and Meth. B205, 528 (2003). [13] M. Matsuda, C. Kobayashi, and S. Takeuchi, in: K. W.
Shep-ard (Ed.),Heavy Ion Accelerator Technology, AIP, New York, 1999, p. 65 (1999).
[14] M. Imai, M. Sataka, K. Kawatsura, K. Takahiro, K. Komaki, H. Shibata, H. Sugai, and K. Nishio, Nucl. Instr. and Meth. B230, 63 (2005).
[15] Available online at
http://physics.nist.gov/PhysRefData/ASD/index.html. for details, Yu Ralchenko, J. R. Fuhr, F.-C. Jou, A. E. Kramida, W. C. Martin, L. I. Podobedova, J. Reader, E. B. Saloman, J. E. Sansonetti, and W. L. Wiese, in: T. Kato, H. Funaba, D. Kato (Ed.),Atomic and Molecular Data and Their Applications, AIP, New York, 2005, p. 276 (2005).
[16] M. Breiniget al., Phys. Rev. A25, 3015 (1982).