Article
Printed in Brazil - ©2014 Sociedade Brasileira de Química0103 - 5053 $6.00+0.00A
*e-mail: [email protected], [email protected]
Certified Reference Material for Traceability in Environmental Analysis:
PAHs in Toluene
Evelyn de F. Guimarães,*,a,b Eliane C. P. do Rego,a Helen C. M. Cunha,a
Janaína M. Rodriguesa and José Daniel Figueroa-Villar*,b
aChemical Metrology Division, Scientific and Industrial Metrology Directorate,
National Institute of Metrology, Quality and Technology (Inmetro), Av. Nossa Senhora das Graças, 50, Xerém, 25250-020 Duque de Caxias-RJ, Brazil
bChemistry Department, Military Institute of Engineering (IME),
Praça General Tibúrcio, 80, Praia Vermelha, Urca, 22290-270 Rio de Janeiro-RJ, Brazil
Material de referência certificado (CRM) desempenha um papel vital para a garantia de controle em análises ambientais, uma vez que a qualidade dos dados resultantes de medições ambientais tem importância crucial. Este artigo apresenta os resultados de estudos realizados para a certificação dos compostos planejados como candidato a material de referência, que são dezesseis hidrocarbonetos policíclicos aromáticos (PAHs) dissolvidos em tolueno (naftaleno, acenaftileno, acenafteno, fluoreno, antraceno, fenantreno, fluoranteno, criseno, benzo[a]antraceno, pireno,
benzo[k]fluoranteno, benzo[b]fluoranteno, benzo[a]pireno, dibenzo[a,h]anthaceno, indeno[1,2,3-cd]pireno e benzo[ghi]perileno). Este é o primeiro CRM brasileiro de PAH
desenvolvido pelo Inmetro. O processo de certificação inclui a validação do método GC/IDMS (espectrometria de massa de diluição isotópica acoplada a cromatografia gasosa), o estudo de homogeneidade, a estabilidade em condição de transporte e de armazenamento, além de cálculo de incertezas de medição.
Certified reference material (CRM) plays a vital role for quality control assurance in environmental analysis, because the quality of data arising from measurements has crucial importance. This article presents the results from studies carried out for certification of a candidate reference material composed by sixteen polycyclic aromatic hydrocarbons (PAHs) dissolved in toluene (naphthalene, acenaphthylene, acenaphtene, fluorene, anthracene, phenanthrene, fluoranthene, chrysene, benzo[a]anthracene, pyrene, benzo[k]fluoranthene, benzo[b]fluoranthene,
benzo[a]pyrene, dibenzo[a,h]anthacene, indeno[123-cd]pyrene and benzo[ghi]perylene). This is
the first Brazilian PAH CRM developed by Inmetro. The certification procedure includes validation of the GC/IDMS method (isotopic dilution mass spectrometry coupled to gas chromatography), homogeneity study, stability studies under transport and storage conditions and estimation of measurement uncertainties.
Keywords: CRM, PAH, environmental analysis, GC/IDMS, uncertainty
Introduction
Polycyclic aromatic hydrocarbons (PAHs) are ubiquitous environmental contaminants from anthropogenic origin,
mainly pyrogenic, petrogenic, and natural sources.1 These
compounds are contaminants in air, food, soil and water.2-5
Due to its wide distribution and environmental lipophilic character, human contamination can occur by absorption,
ingestion or inhalation, with rapid distribution throughout
the body.6
Given the wide distribution of these compounds with inevitable environmental and human exposure, PAHs are measured in a variety of environmental matrices to ensure safety of people. PAHs are enzymatically activated to reactivate intermediate metabolites that cause mutations with the risk of developing tumors. Activated PAH metabolites can form adducts with DNA (PAH-DNA), which represent a
DNA damaging event.7,8 They also lead to error-prone repairs
Due to their persistency in environment as pollution and potential toxicity, several PAHs are on the list of priority pollutants of the United States. According to the Environmental Protection Agency (US-EPA) and regulatory organisms of many countries, PAH are considered
interesting for the public health.9
The growing concern about clean environment importance is an urgent demand and more accurate analysis methods are required. The use of certified reference material (CRM) provides quality assurance in environmental analysis and makes possible the reliability
and traceability of the analytical results.10
Metrology science has advanced considerably with the development of improved primary reference measurement procedures and high-level reference materials, which are the base for accurate measurements. A rigorous approach has been established for making methods traceable to the highest-level reference measurement procedures and reference materials.
The National Institute of Metrology, Quality and Technology (Inmetro) has an important role in Brazil to provide traceability and reliability of measurements by activities of the Chemical Metrology Division (Dquim), which has the mission to develop reference procedures, primary methods and certified reference materials in chemistry.
According to ISO Guide 30 definition, a certified reference material (CRM) is a reference material characterized by a metrologically valid procedure for one or more specified properties, accompanied by a certificate that provides the value of the specified property, its associated uncertainty, and a statement of metrological traceability.11
The production and certification of reference materials is a key activity to the improvement and maintenance of a worldwide coherent system of measurements. As detailed in ISO Guide 32 and ISO Guide 33, CRMs are used for calibration, quality control and method validation purposes, as well as for the assignment of values to other materials, which in turn can also be
CRMs.12-14
Inmetro is currently establishing a program for reference material certification in several areas, like health, food and environment. Related to this program, Inmetro produced and certified the reference material of PAHs in solution codified as CRM 8363.0001.
CRMs are capable of ensuring metrological traceability of measurement results to the International System of Units (SI), which corresponds to an “unbroken chain of calibrations, each contributing to the measurement
uncertainty”.15
Traceability is a requirement of ISO/IEC 17025.16
Another requirement is the use of CRM on testing and calibration process. Therefore, accredited laboratories rely on the use of CRMs, once these materials are essential tools
for the quality control of measurement methods.16 Using
CRMs, the traceability can be ensured and measurement
results meaningfully compared “over time and place”.15
The certification of a reference material is carried out according to the requirements of ISO Guides 31, 34 and 35, which are published by ISO REMCO (Reference Material Committee of the International Standardization Organization) and used worldwide by institutes engaged in
producing and certifying reference material.14,17,18
The ISO Guide 35 states that certification process of a candidate CRM requires a careful study of all sources of uncertainty that may cause impact on the validity of
certified values.14 In general, the important uncertainty
sources are characterization, homogeneity, transport and storage stability. These sources come from essential
studies to the development and certification of CRM.14
The characterization study determines the property values
as part of the certification process.11 Homogeneity study
is necessary in certification projects to demonstrate that the batch of bottles (units) is sufficiently homogeneous. The determination of the remaining batch between-bottle variation is a necessary component to be included in the
CRM uncertainty estimation.11 A stability study aims
to determine the remaining degree of instability of the candidate CRM after preparation, or to confirm the material stability. Such stability study is carried out by simulating transport and storage conditions, where temperature and time are varied.11
This article details all the studies performed by Inmetro regarding the first candidate batch of PAHs in solution CRM. The main work motivation was carried out in recent years for the development of CRM for environmental analysis of PAHs. Those studies started from planning activities, including the bottling of the material and certification steps up to the issuance of a CRM certificate. This CRM allows the improvement of measurement results since its can be reliably compared. Moreover, this improvement can be directly related to the quality assessment of these environmental contaminants.
Experimental
Reagents and chemicals
Toluene (HPLC/Spectro) was purchased from Tedia (Fairfield, USA). Solid PAH standards naphthalene (N, 99.7%), acenaphthylene (Acy, 99.0%), acenaphtene (Ace, 99.0%), fluorene (Fl, 98.0%), phenanthrene (Phe, 99.5%), anthracene (A, 99.0%), fluoranthene (Fluo, 99.0%),
pyrene (Py, 98.0%), benzo[a]anthracene (B[a]A, 99.0%) and
benzo[ghi]perylene (B[ghi]P, 99.0%) were purchased from
Aldrich (St. Louis, USA). Solid PAH standards chrysene
(Chry, 98.0%), benzo[k]fluoranthene (B[k]Fluo, 98.0%),
benzo[b]fluoranthene (B[b]Fluo, 98.0%), benzo[a]pyrene
(B[a]P, 90.0%), dibenzo[a,h]anthacene (DiBA, 98%),
indeno[123-cd]pyrene (IndPy, 98%), were purchased from
AccuStandard (New Haven, USA). The purity of solid PAH
commercial standards was determined in-house.19
Deuterated PAH standards (IS) [2H
8]naphthalene (N-d10),
[2H
12]acenaphthylene (Acy-d10), [2H10]acenaphtene (Ace-d10),
[2H
10]fluorene (Fl-d10), [
2H
10]anthracene (A-d10), [
2H 10]
phenanthrene (Phe-d10), [2H10]fluoranthene (Flu-d10), [2H12]
chrysene (Chry-d12), [
2H
12]benzo[a]anthracene (B[a]A-d12),
[2H
12]pyrene (Py-d12), [2H12]benzo[k]fluoranthene (B[k]
Fluo-d12), [
2H12]benzo[b]fluoranthene (B[b]Fluo-d
12), [
2H 12]
benzo[a]pyrene (B[a]P-d12), [2H14]dibenzo[a,h]anthracene
(DiBA-d14), [
2H
12]indeno[123-cd]pyrene (IndPy-d12), [
2H 12]
benzo [ghi]perylene (B[ghi]P-d12) were obtained from
Cambridge Isotope Laboratories (Andover, USA).
Certified Reference Material (SRM 2260a, NIST), supplied by the National Institute of Standards and
Technology (NIST, USA) was used as quality control.20
Instruments and apparatus
All solutions were prepared gravimetrically using a 220 g semi-micro balance - XP205, readability of 0.00001 g (Mettler Toledo, Greifensee, Switzerland) and analytical balance of 1.2 kg - PR 1203, readability of 0.001 g (Mettler Toledo). These balances has been calibrated by Inmetro Mass Laboratory. All solutions were homogenized in a vortex (Phoenix, USA).
All analyses were carried out in temperature-controlled conditions of (20.1 ± 0.2) ºC and relative humidity of (65.9 ± 1.3)%; the thermo-hygrometer (Oregon Scientific, Portland, USA) used for these measurements was calibrated by Inmetro Hygrometry Laboratory.
A digital densimeter (Mettler Toledo) was used for
conversion of the certified mass per mass (µg g-1) in mass
per volume (µg mL-1). It was calibrated by Inmetro Fluids
Laboratory.
A gas chromatograph with flame ionization detector (GC/FID) (CP-3800, Varian, Walnut Creek, CA, USA) was used to assess the purity of the 16 standards obtained from commercial sources. Two chromatographic columns of different polarities were used: DB-1ms (100% dimethylpolysiloxane) and VF-17ms (50% phenyl, 50%
dimethylpolysiloxane).19
The analysis was performed by gas chromatography (CP-3800) coupled to ion trap mass spectrometer (GC/IT/MS, Saturn 2000, Varian), with electron ionization mode (70 eV) (Varian).
Calibration curve preparation
The calibration curves with six equidistant levels (1, 3,
5, 7, 9 and 11 µg g-1) were established from the gravimetric
dilution of the PAH stock solutions in toluene.
Around 1.0 g of the internal standard (IS) solution was added gravimetrically to 1.0 g of each standard solution. The points of the calibration curve were injected in
triplicate. The control sample used was SRM 2260a.20 This
methodology was used to perform all analysis by isotopic dilution mass spectrometry coupled to gas chromatography (GC/IDMS) and the compound identification was confirmed by the obtained mass spectra.
Production of PAH candidate CRM
The amount of high-purity materials used for the batch preparation of the candidate certified reference material was approximately 5 mg. The analytical balance XP205 was used to weigh high-purity materials.
A 1 L amber glass bottle with Teflon-lined caps was used for preparation of the PAH solution candidate CRM. After the weighing of the bottle containing the high purity materials in toluene, the bottle was placed on a rotating mixer for 12 h to achieve complete homogenization. Subsequently, this solution was bottled in 373 ampoules, each one containing 1.5 mL of the candidate CRM 8363.0001. The material was stored at the so-called
reference temperature of (4 ± 2) °C. Preparation of the
candidate CRM and the studies for its certification were
performed according to the ISO Guides 31, 34 and 35.14,17,18
GC/IDMS method
Previous validation study of the analytical methodology using GC/IDMS technique for the determination of sixteen
PAHs in toluene has been carried out.21 Chromatographic
trap, transfer line and manifold temperatures were set at 290, 230, 280 and 80 °C, respectively; detection in SCAN mode and SIM mode, chromatographic column DB-5ms
(60 m × 250 mm × 0.25 µm); the GC oven operating
conditions were 60 °C (2 min), 120 °C (20 °C min-1;
2 min), 180 °C (6.0 °C min-1; 2 min), 290 °C (3.0 °C min-1;
29.33 min).21 Helium 6.0 was used as carrier gas with constant
flow of 1.0 mL min-1. The retention times and the monitored
ions for each PAH and PAH-d are presented in Table 1.
Homogeneity study
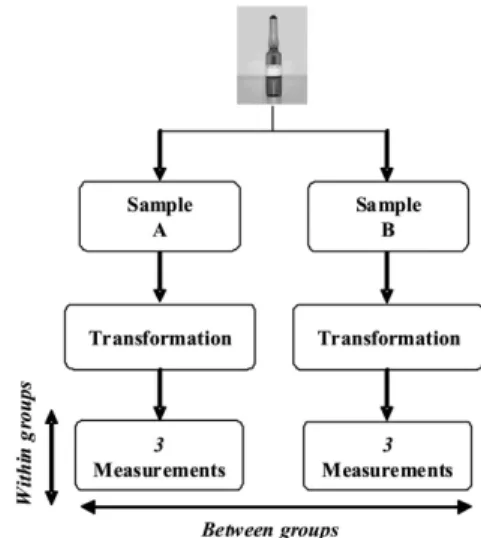
The homogeneity study was performed with representative samples of the whole lot. The between-bottle variation of the CRM was evaluated using eleven CRM ampoules selected randomly from 373 ampoules. All measurements were performed on the same day under repeatability conditions. The ampoules were sub-fractioned into A and B, as shown in Figure 1, and after being weighed, each sample was diluted with deuterated solution (1:1; m/m), homogenized in vortex and subjected to triplicate analyses by GC/IDMS (Figure 1). The analysis of variance (ANOVA) statistical test was applied.
Characterization study
The characterization study approach involved one primary method for measuring each PAH under certification
in the batch.14 The mean result of the homogeneity study of
eleven ampoules was used for the characterization study. The GC/IDMS presents metrological traceability and the sources for uncertainty estimation are calibration curve,
area ratio (AR), sample mass (ms), internal standard mass
(mIS), purity of analyte i (pi) and repeatability.
Stability study
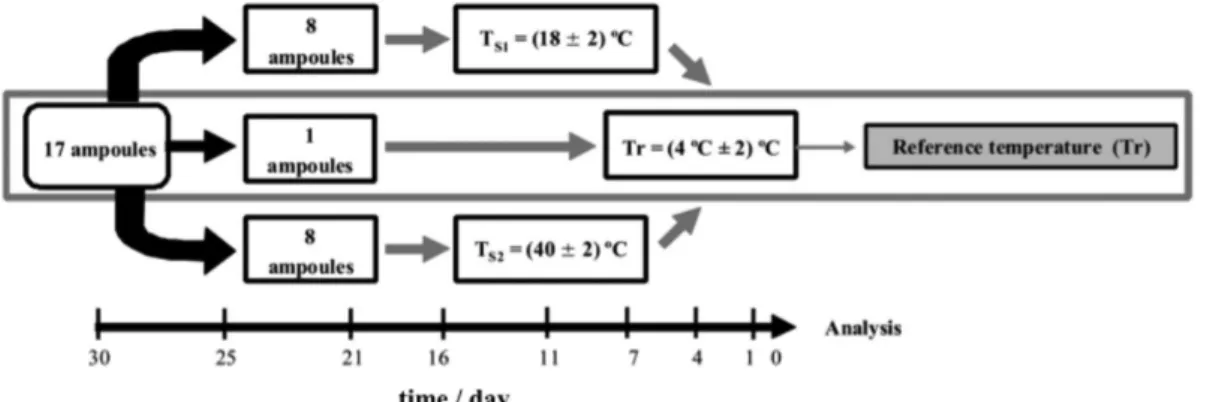
The short-term stability study has been carried out to simulate the conditions of transport. It was conducted with the isochronous design method, at repeatability
condition.22 It was performed using seventeen ampoules
randomly selected. A group of eight ampoules was stored
at temperature of Ts1 (18 ± 2) °C, and a group of eight
ampoules was stored at temperature of Ts2 (40 ± 2) °C.
In each pre-determined time (1, 4, 7, 11, 16, 21, 25 and 30 days), one ampoule was removed from the study
temperature and kept at the reference temperature (Tr) of
(4 ± 2) °C (Figure 2). One ampoule was stored all the time
at the reference temperature.
After 30 days, when all ampoules had been submitted
to the reference temperature (Tr), the group was exposed to
the laboratory room temperature (21 ± 1) ºC. The ampoules were sub-fractioned into A and B; after being weighed, each sample was diluted with a deuterated solution (1:1), homogenized in vortex and subjected to triplicate analyses by GC/IDMS. SRM 2260a was used as a control sample,
prepared as ampoules.20
The long-term stability study has been carried out to simulate storage conditions. This study was conducted with the classical design method, at reproducibility
conditions.22 The study was performed using 18 randomly
selected ampoules. A group of six ampoules was stored at temperature (30 ± 2) °C, and a group of six ampoules
Table 1. Gas chromatography retention time and monitored ion for each PAH and PAH-d
PAH/PAH-d Iona / (m/z) Retention time
/ min N / N-d10 128 / 136 15.11 / 15.05 Acy / Acy-d10 152 / 160 21.52 / 21.48 Ace / Ace-d10 154 / 164 22.42 / 22.25 Fl / Fl-d10 166 / 176 25.26 / 25.08 Phe / Phe-d10 178 / 188.3 31.38 / 31.19 A / A-d10 178 / 188.3 31.73 / 31.57 Flu / Flu-d10 202 / 212.3 39.89 / 39.76 Py / Py-d12 202 / 212.3 41.56 / 41.42 B[a]A / B[a]A-d12 228.2 / 240.4 50.77 / 50.59 Chry / Chry-d12 228.2 / 240.4 51.03 / 50.82 B[b]Fluo / B[b]Fluo-d12 252.4 / 264.4 58.78 / 58.59 B[k]Fluo / B[k]Fluo-d12 252.4 / 264.4 59.01 / 58.84 B[a]P / B[a]P-d12 252.4 / 264.4 61.47 / 61.25 IndPy / IndPy-d12 276.4 / 288.4 73.34 / 73.04 DiBa / DiBA-d14 278.4 / 292.4 73.86 / 73.44 B[ghi]P / B[ghi]P-d12 276.4 / 288.4 76.75 / 73.36
amass-to-charge ratio.
were stored at the temperature of (0 ± 2) °C. A group of six
ampoules was stored at the reference temperature (Tr) of
(4 ± 2) °C. CRM samples stored at the three temperatures
were analyzed six times throughout the 240 days of the certification study. At each time, three ampoules were sub-fractioned into A and B; after being weighed, each sample was diluted with a deuterated solution (1:1), homogenized in vortex and subjected to triplicate analyses by
GC/IT/MS. SRM 2260a was used as a control sample.20
Linear regression was the statistical test used to calculate
the HPA sample stability for each temperature.14
Measurement uncertainty
The combined standard uncertainty (uCRM) for
each CRM component is calculated by combining the
contributions of uncertainties of characterization (uchar),
homogeneity, which is related to possible between-bottle
variation (ubb), instability upon long-term storage (ults)
and instability during transport to the customer (usts).
14,23
As provided in ISO Guide 35 the short-term stability
uncertainty was not included in uCRM, because it was
studied only to define the transport conditions and it is
negligible in relation to long-term stability uncertainty.14
The combined standard uncertainty (uCRM) was calculated
using equation 1.
(1)
The characterization uncertainty was calculated based on the cause and effect diagram (Figure 3), that took into account the sources presented in the equation of the
measurand according to equation 2, where wi is the mass
fraction of the analyte i, Ai is the area of the analyte GC
peak, AIS is the area of the internal standard GC peak, b is
intercept of calibration curve, a is the slope of calibration
curve, pi is the purity of the analyte, mIS is the mass of the
internal standard and ms is the mass of the sample.
(2)
The input quantities defined in the cause and effect diagram are expressed in the equation of characterization
uncertainty (uchar) expressed in equation 3, where uAR is
the contribution of uncertainty due to area ratio, ucc is the
contribution of uncertainty due to calibration curve, ums
is the contribution of uncertainty due to mass sample,
umIS is the contribution of uncertainty due to internal
standard mass, up is the contribution of uncertainty due
to analyte purity and urpt is the contribution of uncertainty
due to the process repeatability. The input quantities are those that contribute for the uncertainty of the analytical
method.24
(3)
The homogeneity uncertainty (ubb) was calculated
according to ISO Guide 35, based on analysis of variance
(ANOVA).14 The mean squares within each group (MS
within)
and among the groups (MSamong) were calculated. Standard
deviations between ampoules (ubb) were calculated with
equation 4, where n represents the number of measurements
by ampoule.14
Figure 2. Scheme for short-term stability study of PAH certified reference material.
(4)
The contribution of the heterogeneity (C (%)) for the
studied material was calculated by equation 5, where X– is
the mean of all measurements from the homogeneity study.
(5)
The long-term stability uncertainties (ults) was
calculated by multiplying the uncertainty of the slope (sb),
equivalent to standard error in b at the regression analysis,
and the time of study (t) as shown in equation 6, according
to the ISO Guide 35.14
(6)
The uncertainty of the certified value for each PAH was
expressed in terms of the expanded uncertainty (U), which
was calculated by multiplying the combined uncertainty
(uCRM) by the coverage factor k for approximately 95%
confidence level, according to equation 7.25
(7)
Results and Discussion
Certification of reference material for PAHs is an important process because this type of CRM assists the laboratories on quality control assurance of environmental analysis.
Beyond the declaration of traceability, the uncertainty associated to the property value (certified value) is what distinguishes a CRM from a common reference material, which usually is not certified. Therefore, for each CRM 8363.0001 certification step, a detailed uncertainty estimation, considering all relevant sources, is described in this work.
Purity study
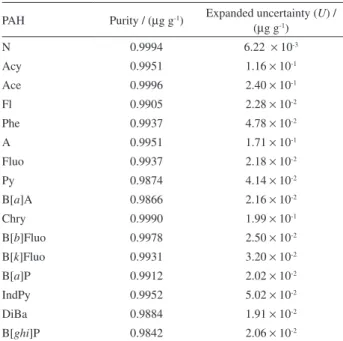
To provide results traceable to an SI unit (mol), the purity of the PAH standards was assessed with its
uncertainty.19 The purity of PAH standards were determined
in-house by gas chromatography with flame ionization detection (GC/FID) using columns of different polarities: DB-1ms (100% dimethylpolysiloxane) and VF-17ms (50% phenyl, 50% dimethylpolysiloxane). The final purity is the average of both columns and the uncertainties were
combined.24 Table 2 shows the values for the purity of each
analyte followed by their associated uncertainties. The
purity was used to correct the gravimetric preparation of the standard solutions, ensuring metrological traceability. The uncertainty due to the purity was included as an uncertainty source in the characterization study of the certified reference material.
Characterization study
The property values for each PAH were assigned using the primary method GC/IDMS that is one of the
four approaches settled by ISO Guide 34.18 The accuracy
of the determination was evaluated by using SRM 2260a
as a control sample.24 The standard uncertainty due to
characterization was calculated according to the ISO GUM
approach.25
The classical and relative methods were used for determination of characterization uncertainty, including all sources according to the nature of the input quantity.
The uncertainties referred to the area ratio (AR), internal
standard mass (mIS), sample mass (ms) and purity of the
analyte (pi), were calculated by the classical method
according to equation 8, where uIQ is the input quantity
uncertainty and (σwi / σAR)
2 is the sensitivity coefficients
related to the area ratio uncertainty. All other sensitivity coefficients were calculated by the same principle, since they are uncertainties originated from the equation that defines the measurand as expressed in equation 2, using the derivative concept to standardize the units of the input quantity in relation to the unit of the statement (mass fraction). This equation is derived from the calibration
curve equation as described in equation 9 and equation 10.24
Table 2. In-house purity for all PAH by GC/FID
PAH Purity / (µg g-1) Expanded uncertainty (U) /
(µg g-1)
N 0.9994 6.22 × 10⁻³
Acy 0.9951 1.16 × 10⁻¹
Ace 0.9996 2.40 × 10⁻¹
Fl 0.9905 2.28 × 10⁻²
Phe 0.9937 4.78 × 10⁻²
A 0.9951 1.71 × 10⁻¹
Fluo 0.9937 2.18 × 10⁻²
Py 0.9874 4.14 × 10⁻²
B[a]A 0.9866 2.16 × 10⁻²
Chry 0.9990 1.99 × 10⁻¹
B[b]Fluo 0.9978 2.50 × 10⁻²
B[k]Fluo 0.9931 3.20 × 10⁻²
B[a]P 0.9912 2.02 × 10⁻²
IndPy 0.9952 5.02 × 10⁻²
DiBa 0.9884 1.91 × 10⁻²
(8)
(9)
(10)
The uAR was calculated through the product of the mass
fraction derivative of the analyte in relation to the ratio
area for the uncertainty of the ratio in its own unit (u’)
as expressed in equation 11. The sensitivity coefficient was calculated deriving the mass fraction of the PAH in function of its area ratio, where mIS is the internal standard
mass added to the sample, a is the angular coefficient of
the straight-line equation and ms is the sample mass as
described in equation 12. The uncertainty of the ratio area, which is related to the experimental measurement,
is given by equation 13, where s is the standard deviation
of the area ratio measurements and n is the number of
replicates.24,25
(11)
(12)
(13)
All other uncertainties originated from equation 2
were calculated and presented in the same way as for uAR.
Therefore, the multiplication of the sensitivity coefficients, expressed as function of the area ratio, by the respective uncertainty in its unit, supplies the result in the same unit
of the measurand.24
The other input quantities (repeatability and calibration curve) have their uncertainties calculated using the relative method. In this case the input uncertainty was divided by the value of the quantity. As an example, it is shown the determination of uncertainty regarding the repeatability of the process. Dealing with an experimental measurement,
its uncertainty is calculated through equation 14, where s
is the standard deviation of the results and n is the number
of replicates. However, since this uncertainty is calculated as a relative form, the result of this equation should be divided by the mean mass fraction of analyte, as shown in equation 15, where urpt is the uncertainty of the repeatability,
wi is the mean mass fraction of the PAH and u’rpt is the
relative uncertainty of the repeatability.24
(14)
(15)
To estimate the combined standard uncertainty (uc) it is
necessary that all the considered entrance input quantities be expressed in the same unit or as dimensionless. The relative uncertainties for all the sources are calculated dividing the respective uncertainties by the property value. In this way, equation 3 was rewritten in accordance with
equation 16, where uIQ is the uncertainty of the equation
expressed in equation 17.24
(16)
(17)
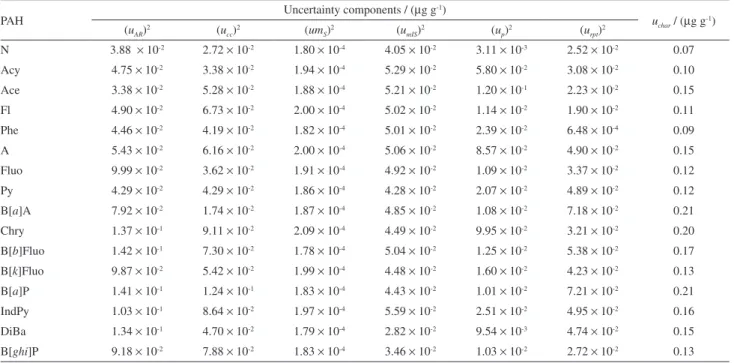
Table 3 shows the results of the uncertainties (µg g-1)
for all sources and the uncertainties obtained from the study of characterization for each PAH.
Among the uncertainties of the entrance input quantity, the ones provided from the gravimetric primary method present the lowest values. This result is in accordance with the requirements for the used technique, where its only uncertainty source comes from the balance.
The internal standard purity is not a source of uncertainty in this analysis, as, independently from its value, this material is added to the points of the calibration curve and to the PAH sample at the same mass fraction, where both are divided by the same factor. It does not contribute for the uncertainty in the analysis.
Homogeneity study
Homogeneity is an important property of a CRM. It is, nevertheless, a relative concept, closely related to the distribution of components in the material, the sample size, and the number of samples that has been selected to
measure homogeneity.14
A material is perfectly homogeneous related to a given parameter (property value) if there is no difference among all the aliquots taken from the sample with a determined mass. However, in practice, a material is accepted to be homogeneous if this difference is negligible when compared to the uncertainty component from, for example,
characterization.14
The uncertainty component due to batch heterogeneity
to underestimate this uncertainty component due to limitations arising from the measurement method. When the only available methods display poor repeatability, these underestimation risks should be taken into account. Furthermore, if the subsamples taken for measurement are sufficiently large this type of subsampling does not contribute significantly to uncertainty due to measurement repeatability.14
For all certified PAHs, the ubb was calculated
through equation 4 because the variance analysis of the samples showed high variation between the samples (MSamong > MSwithin). If the lot reference material homogeneity is not proven, its certification is not possible, since this homogeneity is one of the most important
requirements demanded by the ISO Guides 34 and 35.14,18
Table 4 shows the mean data in µg g-1 from homogeneity
study and standard uncertainty due to between-bottle
heterogeneity (ubb) obtained for each of the 16 PAHs.
Heterogeneity less than 3% was the criterion established for the certification of all 16 PAHs for this reference material. The range of heterogeneity varied from 0.63%
(Chry) to 2.66% (B[b]Fluo) as presented in Table 4.
Stability study
The short-term stability study set the conditions of transport of CRM 8363.0001 as a maximum period of
60 days at (30 ± 2) °C. With these conditions it is not expected changes in the property values of the CRM. The
short-term stability uncertainty (usts) was not considered
relevant as an uncertainty component and it was not
included in the uCRM uncertainty calculation.14
The long-term stability study was based on linear regression and no trend was observed in the property values
during the period of study (240 days). The p-value indicates
that the regression was insignificant (it becomes significant for a level of confidence of, for example, 95% for 0.05). Therefore, the batch of PAH CRM was confirmed to be stable and able for certification. The standard uncertainty
Table 3. Uncertainty components obtained from the characterization study for 16 PAHs
PAH Uncertainty components / (µg g
-1)
uchar / (µg g
-1)
(uAR)
2 (u
cc)
2 (um
S)
2 (u
mIS)
2 (u
p)
2 (u
rpt)
2
N 3.88 × 10⁻² 2.72 × 10⁻² 1.80 × 10⁻⁴ 4.05 × 10⁻² 3.11 × 10⁻³ 2.52 × 10⁻² 0.07
Acy 4.75 × 10⁻² 3.38 × 10⁻² 1.94 × 10⁻⁴ 5.29 × 10⁻² 5.80 × 10⁻² 3.08 × 10⁻² 0.10
Ace 3.38 × 10⁻² 5.28 × 10⁻² 1.88 × 10⁻⁴ 5.21 × 10⁻² 1.20 × 10⁻¹ 2.23 × 10⁻² 0.15
Fl 4.90 × 10⁻² 6.73 × 10⁻² 2.00 × 10⁻⁴ 5.02 × 10⁻² 1.14 × 10⁻² 1.90 × 10⁻² 0.11
Phe 4.46 × 10⁻² 4.19 × 10⁻² 1.82 × 10⁻⁴ 5.01 × 10⁻² 2.39 × 10⁻² 6.48 × 10⁻⁴ 0.09
A 5.43 × 10⁻² 6.16 × 10⁻² 2.00 × 10⁻⁴ 5.06 × 10⁻² 8.57 × 10⁻² 4.90 × 10⁻² 0.15
Fluo 9.99 × 10⁻² 3.62 × 10⁻² 1.91 × 10⁻⁴ 4.92 × 10⁻² 1.09 × 10⁻² 3.37 × 10⁻² 0.12
Py 4.29 × 10⁻² 4.29 × 10⁻² 1.86 × 10⁻⁴ 4.28 × 10⁻² 2.07 × 10⁻² 4.89 × 10⁻² 0.12
B[a]A 7.92 × 10⁻² 1.74 × 10⁻² 1.87 × 10⁻⁴ 4.85 × 10⁻² 1.08 × 10⁻² 7.18 × 10⁻² 0.21
Chry 1.37 × 10⁻¹ 9.11 × 10⁻² 2.09 × 10⁻⁴ 4.49 × 10⁻² 9.95 × 10⁻² 3.21 × 10⁻² 0.20
B[b]Fluo 1.42 × 10⁻¹ 7.30 × 10⁻² 1.78 × 10⁻⁴ 5.04 × 10⁻² 1.25 × 10⁻² 5.38 × 10⁻² 0.17
B[k]Fluo 9.87 × 10⁻² 5.42 × 10⁻² 1.99 × 10⁻⁴ 4.48 × 10⁻² 1.60 × 10⁻² 4.23 × 10⁻² 0.13
B[a]P 1.41 × 10⁻¹ 1.24 × 10⁻¹ 1.83 × 10⁻⁴ 4.43 × 10⁻² 1.01 × 10⁻² 7.21 × 10⁻² 0.21
IndPy 1.03 × 10⁻¹ 8.64 × 10⁻² 1.97 × 10⁻⁴ 5.59 × 10⁻² 2.51 × 10⁻² 4.95 × 10⁻² 0.16
DiBa 1.34 × 10⁻¹ 4.70 × 10⁻² 1.79 × 10⁻⁴ 2.82 × 10⁻² 9.54 × 10⁻³ 4.74 × 10⁻² 0.15
B[ghi]P 9.18 × 10⁻² 7.88 × 10⁻² 1.83 × 10⁻⁴ 3.46 × 10⁻² 1.03 × 10⁻² 2.72 × 10⁻² 0.13
; uAR = contribution of uncertainty due to area ratio; ucc = contribution of uncertainty due to calibration curve; umS = contribution of uncertainty due to sample mass; umIS = contribution of uncertainty due to internal standard mass; up = contribution of uncertainty due to purity of the analyte; urpt = contribution of uncertainty due to repeatability of the process.
Table 4.Mean data and standard uncertainty due to between-bottle heterogeneity (ubb) obtained from the homogeneity study for each of the 16 PAHs
PAH Mean data / (µg g-1)
ubb /
(µg g-1) PAH
Mean data / (µg g-1)
ubb / (µg g-1)
N 4.58 0.04 B[a]A 4.73 0.04
Acy 4.92 0.08 Chry 5.29 0.03
Ace 4.76 0.03 B[b]Fluo 4.51 0.12 Fl 5.07 0.04 B[k]Fluo 5.06 0.05
Phe 4.61 0.03 B[a]P 4.65 0.08
A 5.09 0.05 IndPy 5.00 0.04
Fluo 4.85 0.10 DiBa 4.54 0.08
due to long-term stability (ults) was estimated according to
equation 6. The results are described in Table 5 for all PAHs.
CRM 8363.0001 should be stored in the dark at
temperatures below (4 ± 2) °C, but it cannot be frozen.
Certified values
The certified property value for each PAH was achieved by the mean data from the homogeneity study (Table 4). It is important to point out that the primary method, GC/IDMS, was used in the analysis in accordance to one of the four possible methodologies settled by ISO Guide 34
to characterize a CRM.18
Table 6 presents the results for certification of all PAHs. These results include the combined standard uncertainty (uMRC) in µg g-1, expanded uncertainty (U) and certified
values in µg g-1, as well as certified values in mass per
volume (µg mL-1).14
The certified value in mass per volume (µg mL-1)
was calculated by converting the mass per mass value
(µg g -1) considering the density of solution (0.8668689 ±
0.0000011) g cm3 at 20 °C (k = 2.95%), determined by a
digital densimeter (Mettler Toledo).
After the CRM begins to be used commercially, its stability is monitored continuously as long as there are CRMs of the PAH batches on the shelf.
Conclusions
The Chemical Metrology Division of Inmetro - Dquim aims through this CRM development to provide CRM producers with a feasible case of CRM certification, as well as providing testing laboratories with a tool to guarantee reliability and accuracy on PAH measurements. To achieve this goal, Inmetro followed all requirements from ISO Guides 31, 34 and 35, and certificated this CRM using
isotope labeled standards as internal standards,14,17,18 and
assigned its actual code as CRM 8363.0001. This CRM
is homogeneous and stable at (4 ± 2) °C for all 16 PAHs
according to the used statistical tests. The range of certified values varies from 4.51 to 5.29 µg g-1.
In 2007, Inmetro participated in the key comparison CCQM-K50 to demonstrate its measurement capability to provide the traceability and acceptability of this CRM
that was certified in 2011.24,26 The CRM 8363.0001 was
audited in a peer review process, being approved and available in the Key Comparison Database (KCDB) of the International Bureau of Weights and Measures (BIPM) through the publication of Calibration and Measurement Capability of Inmetro for measurement and production of
PAH CRM in toluene.24,27
The certification of the CRM 8363.0001 by Inmetro will provide Brazilian laboratories with a national reference standard, which is one of the main tools for the assurance of the traceability, analytical measurement reliability and greater access of the Brazilian laboratories to this kind of CRM. It is intended primarily for use in the calibration of chromatographic instrumentation.
PAHs exposition can increase the occurrence of cancer and pulmonary problems, as well as other types of intoxications in living organisms, with emphasis on mammal species, especially on human beings. The development of this work is especially important for the analysis and control of PAHs in the atmosphere, a fundamental process for environmental monitoring.
Table 6. Combined standard uncertainty (uMRC), expanded uncertainty (U) and certified values in two units for all PAHs
PAH uMRC / (µg g-1)
Ua /
(µg g-1)
Certified value / (µg g-1)
Certified value / (µg mL-1)
N 0.10 0.20 4.58 ± 0.20 3.97 ± 0.18 Acy 0.14 0.28 4.92 ± 0.28 4.27 ± 0.24 Ace 0.19 0.37 4.76 ± 0.37 4.13 ± 0.32 Fl 0.16 0.32 5.07 ± 0.32 4.40 ± 0.28 Phe 0.16 0.31 4.61 ± 0.31 4.00 ± 0.27 A 0.16 0.32 5.09 ± 0.32 4.41 ± 0.27 Fluo 0.17 0.33 4.85 ± 0.33 4.20 ± 0.29 Py 0.20 0.40 4.73 ± 0.40 4.10 ± 0.35 B[a]A 0.23 0.46 4.73 ± 0.46 4.10 ± 0.40 Chry 0.25 0.49 5.29 ± 0.49 4.59 ± 0.43 B[b]Fluo 0.24 0.47 4.51 ± 0.47 3.91 ± 0.41 B[k]Fluo 0.18 0.36 5.06 ± 0.36 4.39 ± 0.31 B[a]P 0.42 0.83 4.65 ± 0.83 4.03 ± 0.72 IndPy 0.39 0.79 5.00 ± 0.79 4.34 ± 0.68 DiBa 0.19 0.38 4.54 ± 0.38 3.94 ± 0.33 B[ghi]P 0.21 0.41 4.65 ± 0.41 4.03 ± 0.36
ak = 2.95%.
Table 5. Standard uncertainty due to long-term stability (ults) in µg g
-1
for each of the 16 PAHs
PAH ults / (µg g
-1) PAH u
lts / (µg g
-1)
N 0.06 B[a]A 0.08
Acy 0.05 Chry 0.14
Ace 0.11 B[b]Fluo 0.11
Fl 0.11 B[k]Fluo 0.12
Phe 0.13 B[a]P 0.35
A 0.04 IndPy 0.36
Fluo 0.05 DiBa 0.09
Supplementary Information
Supplementary information is available free of change at http://jbcs.sbq.org.br, as PDF file.
Acknowledgement
The authors would like to thank FINEP and CNPq for financial support.
References
1. Mastral, A. M.; Callén, M. S.; Environ. Sci. Technol. 2000, 34, 3051.
2. Vieira, M. A.; Maraschin, M.; Rovaris, A. A.; Amboni, R. D. M. C.; Pagliosa, C. M.; Xavier, J. J. M.; Amante, E. R.; Food Addit. Contam. 2010, 27, 776.
3. Christensen, J. H.; Tomasi, G.; Scofield, A. L.; Meniconi, M. F. G.; Environ. Pollut. 2010,158, 3290.
4. Wagener, A. L. R.; Carreira, R. S.; Hamacher, C.; Scofield, A. L.; Farias, C. O.; Cordeiro, L. G. M. S.; Luz, L. G.; Baêta, A. P.; Kalas, F. A.; Mar. Poll. Bull. 2011, 62, 1877.
5. Tobiszewski, M.; Namiesnik, J.; Environ. Pollut. 2012, 162, 110.
6. Pereira Netto, A. D.; Moreira, J. C.; Dias, A. E. X. O.; Arbilla, G.; Ferreira, L. F. V.; Oliveira, A. S.; Barek, J.; Quim. Nova 2000,23, 765.
7. Poirier, M. C.; Nat. Rev. Cancer 2004, 4, 630.
8. Ran, C.; Dai, Q.; Ruan, Q.; Penning, T. M.; Blair, I. A.; Harvey, R. G.; J. Org. Chem. 2008, 73, 992.
9. International Agency for Research on Cancer (IARC); Complete List of Agents, Mixtures and Exposures Evaluated and their Classification; IARC: World Health Organization, Lyon, France, 2010, available at http://monographs.iarc.fr/ ENG/Classification/ClassificationsAlphaOrder.pdf, accessed in December, 2013.
10. De Biévre, P.; Dybkaer, R.; Fajgelj, A.; Hibbert, D. B.; Pure Appl. Chem. 2011, 83, 1873.
11. ISO Guide 30: Terms and Definitions Used in Connection with Reference Materials AMENDMENT 1: Revision of Definitions for Reference Material and Certified Reference Material 1992/ Amd.1:2008, ISO: Geneva, 2008.
12. ISO Guide 32: Calibration in Analytical Chemistry and Use of Certified Reference Materials, ISO: Geneva, 1997.
13. ISO Guide 33: Uses of Certified Reference Materials, ISO: Geneva, 2000.
14. ISO Guide 35: Reference Materials: General and Statistical Principles for Certification, ISO: Geneva, 2006.
15. Duewer, D. L.; Lippa, K. A.; Long, S. E.; Murphy, K. E.; Sharpless, K. E.; Sniegoski, L. T.; Welch, M. J.; Tani, W.; Umemoto, M.; Anal. Bioanal. Chem. 2009, 395, 155. 16. ISO/IEC 17025: General Requirements for the Competence of
Calibration and Testing Laboratories, ISO: Geneva, 2005. 17. ISO Guide 31: Reference Materials: Contents of Certificates
and Labels, ISO: Geneva, 2000.
18. ISO Guide 34: General Requirements for the Competence of Reference Material Producers, ISO: Geneva, 2009.
19. Duewer, D. L.; Parris, R. M.; White, E. V.; May, W. E; Elbaum, H.; An Approach to the Metrologically Sound Traceable Assessment of the Chemical Purity of Organic Reference Materials; National Institute of Standards and Technology (NIST); Gaithersburg, 2004.
20. NIST SRM 2260a: Aromatic Hydrocarbons in Toluene. Certificate of Analysis, Standard Reference Material; NIST: Gaithersburg, 2004.
21. Guimarães, E. F.; Rego, E. P.; Cunha, H. C. M.; Rodrigues, J. M.; Figueroa-Villar, J. D.; Cunha, V. S.; Produto & Produção
2010, 11, 113.
22. Van der Veen, A. M. H.; Linsinger, T.; Pauwels, J.; Accred. Qual. Assur. 2001, 6, 26.
23. EURACHEM/Cooperation on International Traceability in Analytical Chemistry (CITAC) Guide CG4: Quantifying Uncertainty in Analytical Measurements, 3rd ed., London, 2012.
24. Guimarães, E. F.; Rodrigues, J. M.; Cruz, M. H.; Sartori, A. V.; De Souza, V.; Figueroa-Villar, J. D.; J. Chromatogr. Sci.
2013, 51, 845.
25. Joint Committee for Guides in Metrology (JCGM); Evaluation of Measurement Data - Guide to the Expression of Uncertainty in Measurement; Bureau International des Poids et Mesures (JCGM): Paris, 2008.
26. Philipp, R.; Bremser, W.; Becker, R.; Win, T.; Schantz, M. M.; Urquiza, M. P.; Calderón, M. A. Á.; Torres, M. M.; Carter, D.; O’Connor, G.; Sejeroe-Olsen, B.; Ricci, M.; Lalere, B.; Peignaux, M.; Kim, D.; Itoh, N.; Wong, S.; Man, T. O.; Rodrigues, J. M.; Metrologia 2010, 47, 08006.
27. http://kcdb.bipm.org/AppendixC/QM/BR/QM_BR_3.pdf accessed in June 2013.
Submitted: October 11, 2013