Article
Printed in Brazil - ©2017 Sociedade Brasileira de Química0103 - 5053 $6.00+0.00*e-mail: [email protected]
An UPLC-MS/MS Method for Determination of Vicenin-2 and Lychnopholic Acid in
Rat Plasma and its Application to a Pharmacokinetic Study
Dayana R. Gouvea,a Gabriela A. Buqui,a João Luis C. Lopes,a Andrea Dinizb and Norberto P. Lopes*,a
aNúcleo de Pesquisa em Produtos Naturais e Sintéticos (NPPNS), Departamento de Física e Química,
Faculdade de Ciências Farmacêuticas de Ribeirão Preto (FFCLRP), Universidade de São Paulo (USP), 14040-903 Ribeirão Preto-SP, Brazil
bDepartamento de Farmácia, Universidade Estadual de Maringá, 87020-900 Maringá-PR, Brazil
Vicenin-2 (VIC) and lychnopholic acid (LA) are present in large amounts in hydroalcoholic extract from leaves of Lychnophora salicifolia, commonly known in the Brazilian Cerrado as “arnicão”, a plant applied as topic anti-inflammatory and as a flavoring agent for the traditional spirit (cachaça). A new ultra-performance liquid chromatography-tandem mass spectrometry (UPLC-MS/MS) method was developed and validated for quantification of LA and VIC in plasma samples in order to evaluate their pharmacokinetic profiles in rats. The method was linear in the range of 10-2500 ng mL-1,
acceptable precision accuracies were obtained and no significant matrix effect was observed. The validated method was successfully applied to pharmacokinetic study. LA presented very low t1/2 (half-time), highCl (serum clearance) and Vd (volume of distribution), and for VIC, the t1/2 value
was slightly larger, but still rather low, whereas Cl and Vd values were slightly lower, indicating that both substances are instantaneous and well distributed in the body, and quickly eliminated.
Keywords:Lychnophora, “arnica da serra”,vicenin-2, lychnopholic acid, pharmacokinetic, UPLC-MS/MS
Introduction
The Lychnophora genus has been the focus of our research group (Núcleo de Pesquisa em Produtos Naturais e Sintéticos (NPPNS, FFCLRP-USP)) that for many years has been studying several species with many applications, like in traditional medicine as topical analgesic and anti-inflammatory, and also as flavoring
for the Brazilian traditional spirit cachaça.1 Studies
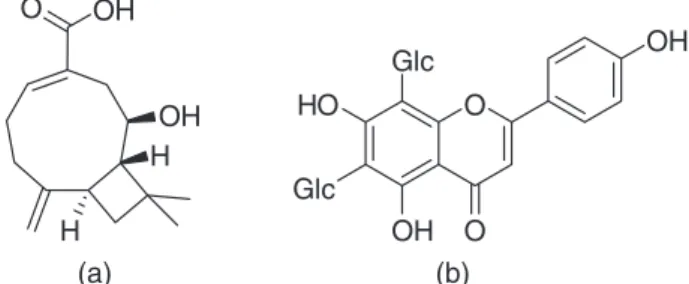
involving pharmacological activities with these species revealed the importance of two compounds: the flavonoid vicenin-2 (VIC) with anti-inflammatory and also anticancer activities, and the lychnopholic acid (LA) with antibacterial
and trypanocidal activities as well.2-5 These compounds are
present in large amounts in hydroalcoholic extract from
leaves of Lychnophora salicifolia and are present in most
studied populations of this plant.6 VIC and LA structures
are illustrated in Figure 1.
A wide range of pharmacological properties has been attributed to natural compounds, and recent studies
have demonstrated the possibility of interaction of these substances with absorption and metabolism of other drugs.
For example, the study guided by Liu et al.7 revealed an
inhibitory effect of apigenin on the pharmacokinetic (PK) analysis of imatinib. Another study showed that the flavonoid quercetin enhanced the bioavailability of tamoxifen after oral
administration of this drug combined with quercetin in rats.8
Considering the dietary intake, the folk medicine use and the biological activities of natural compounds, the pharmacokinetic study and the characterization of absorption, distribution, metabolism and excretion (ADME) of these compounds become essential, but still remain
unclear for several classes.9 The pharmacokinetic evaluation
of a group of compounds present in a plant extract becomes extremely challenging once that these compounds may interact with each other involving the ADME steps, and also due to the sensitivity of the analytical methodology. With this observation, it is more appropriate, at a first moment, to obtain the PK profile of each active compound isolated.
The analytical method for assessing bioavailability and pharmacokinetic parameters from biological samples
of herbal preparations must be sufficiently sensitive.10 An
alternative for analytical studies involving samples of natural products in low concentrations, in terms of sensitivity, is the use of ultra-performance liquid chromatography (UPLC). When compared with high performance liquid chromatography (HPLC), UPLC shows some advantages such as faster analysis, smaller amount of solvent, higher efficiency and a 2-3 times higher detectability when compared to the HPLC analysis, allowing the use of smaller
sample size.11,12 In this context, mass spectrometry detection
becomes an important tool when referring to the sensitivity and specificity of analytical methods. Furthermore, the possibility of different spectrum acquisition modes allows the enhancement of specificity and sensitivity of the method. For example, with the MRM (multiple reaction mode) acquisition mode, a determined ion is selected on the first analyzer (usually the protonated or deprotonated molecule), later this ion is fragmented in a collision cell and
then the fragment ion, with a specific and characteristic m/z
of the studied compound, is monitored in the last analyzer.13
Medicinal extracts are a complex mixture of substances containing several active compounds and there is a need of studying these compounds singly in order to obtain their PK profiles. VIC and LA are the major constituents of
hydroalcoholic extracts prepared from leaves of L. salicifolia
and can be easily isolated, as described before.14 Considering
that, the aim of this study was to develop and validate a method using UPLC coupled with tandem mass spectrometry (UPLC-MS/MS) to quantify VIC and LA in rat plasma samples after single intravenous dose. The PK parameters for both compounds were calculated.
Experimental
Chemicals and reagents
Acetonitrile and acetic acid (HPLC grade) were
obtained from J. T. Baker. Deionized water 18 mΩ cm
(Direct-Q, Millipore, USA) was used throughout the study.
VIC and LA were isolated from L. salicifolia leaves as
described before.14 The internal standard (IS) coumarin
was purchased from Sigma (USA).
UPLC-MS/MS system and operating conditions
The same chromatographic method was applied to quantify both substances. The UPLC-MS/MS system was comprised of an Acquity UPLC (Waters, USA) coupled to an Acquity TQD (tandem quadruple detector) equipped with an ESI (electrospray ionization) interface. An
Acquity UPLC® BEH C18 2.1 × 50 mm, 1.7 µm (bridged
ethylsiloxane hybrid) (2.1 × 50 mm, 1.7 µm) column
protected by an Acquity UPLC® Vanguard column of the
same material was used.
The mobile phase was composed of water (A) and acetonitrile (B) both containing 0.1% of acetic acid (v/v). The gradient elution was: 0 to 1 min for 3 to 15% B (linear gradient), 1 to 3.5 min for 15 to 100% B (linear gradient), 3.5 to 4.5 min (column washing) for 100% B (isocratic), 4.5 to 5 min for 100 to 3% B (linear gradient), and 5 to 6 min (column equilibration) for 3% B (isocratic). The
flow rate was 0.3 mL min-1. The column temperature
was set at 40 oC. The samples were maintained at 20 °C
in the autosampler. A mixture of H2O/MeOH/MeCN
(2:4:4; v:v:v; 400 µL) was used as the strong solvent, and
H2O/MeOH/MeCN (8:1:1; v:v:v; 1000 µL) was the weak
solvent used to clean the auto-injection system of UPLC, the weak solvent was used to clean the seal wash as well. The applied injection mode was the partial loop with needle overfill. An aliquot of 5 µL was injected into the UPLC-MS/MS
system. Data were acquired by MassLynxTM v. 4.1 (Waters,
USA) software and processed for quantification by
QuanLynxTM v. 4.1 (Waters, USA) software.
MS tune parameters were: desolvation gas flow
(nitrogen) was 600 L h-1 and the collision gas (argon)
flow was 0.15 L h-1 at a pressure of ca. 3.02 × 10⁻³ mbar
in the collision cell. Capillary voltage was 2.5 kV, source temperature at 150 °C and desolvation temperature at 350 °C. The MRM mode was used for the quantification. The monitored transitions were: negative ionization mode
at m/z 593 > 353 for VIC and at m/z 249 > 205 for LA, and
positive ionization mode at m/z 147 > 91 for IS coumarin.
Cone voltage and collision energy were 30 V and 35 eV, respectively, for VIC, 20 V and 20 eV for LA and 20 V and 25 eV for IS. The dwell time was automatically set at 0.146 s. Low mass resolution-1 was set at 2.7, high mass resolution-1 15.0, ion energy-1 0.5, entrance 50, exit 50,
low massresolution-2 was 9.3, high massresolution-2 14.9,
and energy ion-2 0.6.
Preparation of calibration curve and quality control samples
of the compounds with acetonitrile. Aliquots (100 µL) of heparinized rat plasma were subjected to protein precipitation with the addition of a mixture prepared with exactly 50 µL of the solution containing standard of VIC or LA at different concentrations and 50 µL of corresponding
IS at the final concentration of 250 ng mL-1 in acetonitrile.
Then, 100 µL of hexane were added and this mixture was briefly vortexed, and centrifuged at 15 °C for 15 min, 21380 × g (Boeco centrifuge, model M-240R, Germany). The supernatant was filtered using membrane filters (13 mm, PTFE, 0.22 µm pore size; Millex, Millipore, USA) and transferred into a maximal recovery vial.
Sample preparation
The blood was collected in heparinized microtubes and immediately centrifuged for 5 min at room temperature (2000 × g, Ministar centrifuge, USA). Plasma was then separated, and 100 µL of a solution containing IS prepared in acetonitrile were added. The final concentration of the
internal standard in the samples was 250 ng mL-1. After this
step, 100 µL of hexane were added. The samples were briefly vortexed, centrifuged at 15 °C for 15 min, 21380 × g (Boeco centrifuge, model M-240R, Germany), the supernatant was filtered using membrane filters (13 mm, PTFE, 0.22 µm pore size; Millex, Millipore, USA) and transferred into a maximal recovery vial. The samples were placed in the autosampler at 20 °C until the time of injection.
Bioanalytical method validation
The method was validated by evaluating selectivity,
linearity, precision, accuracy, stability and matrix effect.15,16
The selectivity of the method was tested by comparing the chromatograms obtained for 6 different blank plasma samples and plasma samples spiked with standard solutions of the studied substances and IS.
The linear range of the method was evaluated by the analysis of aliquots of the standard solutions spiked in plasma at final concentrations of 0.5, 1.0, 5.0, 10.0, 20.0, 50.0, 100.0, 200.0, 500.0, 1000.0, 1500.0, 2000.0, 2500.0
and 5000.0 ng mL-1. The lowest concentration level that
demonstrated precision and accuracy below 20% was defined as the lower limit of quantification (LLOQ) and the upper concentration level tested that demonstrated precision and accuracy below 15% was defined as the upper limit of quantification (ULOQ).
The quality control samples were determined to VIC
and LA as follows: low quality control of 25 ng mL-1,
medium quality control of 1250 ng mL-1 and high quality
control of 2000 ng mL-1.
The final calibration curve consisted of the following concentrations: 10.0, 50.0, 100.0, 500.0, 1000.0 and
2500.0 ng mL-1. Due to the wide concentration range
required for the analysis of different times of blood sampling, the function weighing 1/x was used for the calibration curve calculation.
The repeatability (intra-assay precision) of the method was determined by injecting quality control solutions at low,
medium and high concentrations and LLOQ (10 ng mL-1)
in quintuplicate.
The determination of the intermediate precision was carried out in the same laboratory, by the same analyst, but on different days by injection of the quality control solutions, also at three concentrations and LLOQ.
The accuracy was determined in the same analytical run (within-day accuracy) and, in three different runs (between-days accuracy). Each run consisted of the injection of the quality control solutions at low, medium and high concentrations and LLOQ in quintuplicate.
Precision was defined as the relative standard deviation (RSD, %) and accuracy as relative error (RE, %).
The test of the stability was performed according the need of the application of this method. The stability of plasma was evaluated after the storage in freezer at –70 °C for 1 month and 1 cycle of freezing and defreezing.
The qualitative evaluation of the suppression of ionization of the studied substances by the components of the rat plasma was accomplished by direct infusion of standards of VIC, LA and the internal standard into the mass spectrometer combined with concomitant elution of a sample of blank plasma. The decrease or increase of the intensity of the base line indicates that some component of the plasma is suppressing or enhancing the ionization
of the analytes.17,18
The quantitative evaluation of the matrix effect was performed by evaluating the concentrations of quality control samples (using plasma of 4 different animals for each concentration). The blank plasma samples were subjected to the extraction process and later added of IS and analyte. The ratio (response of the analyte in matrix extracted/response of IS in matrix extracted)/(response of the analyte in solution/response of IS solution) of each concentration was calculated and the relative standard deviation (%) of all results was considered appropriate
below 15%.17,18
Pharmacokinetic study
approved by the Animal Use Ethics Committee (protocol No. 12.1.1054.53.1). The animals were acclimated to 25 °C with a light cycle of 12 h, water and food and libitum.
The solutions of VIC (0.5 mg kg-1) and LA (2.0 mg kg-1)
administered to the animals were prepared in saline with dimethylsulfoxide (DMSO, final concentration maximum of 5%).
For IV administration of the compounds, an intravenous catheter (Safelet Nipro, 24G × 3/4” model) was inserted into a lateral tail vein of the animal. Blood samples were collected in microtubes containing heparin. In the case of VIC, samples were collected at 5, 15, 25, 35, 45, 60, 90 and 120 min, and of LA 3, 5, 8, 12, 15, 20, 25 and 30 min.
After blood collection, the tubes were immediately centrifuged for 5 min at room temperature (mini centrifuge Ministar 2000 × g, USA) and the plasma was then separated and stored in a freezer at –70 °C until the time of sample preparation for analysis by UPLC-MS/MS.
Data were analyzed using the software Excel 2007 and Scientist. Non-compartmental and compartmental pharmacokinetic analyses were developed. One compartmental body model was assumed for compartmental analysis. The pharmacokinetic parameters of VIC and LA were estimated.
Results and Discussion
Method validation
The analytical methodology was validated in accordance with current Brazilian and international guidelines and successfully applied for the analysis of the samples from
our pharmacokinetic study.15,16 Figure 2 is an example of a
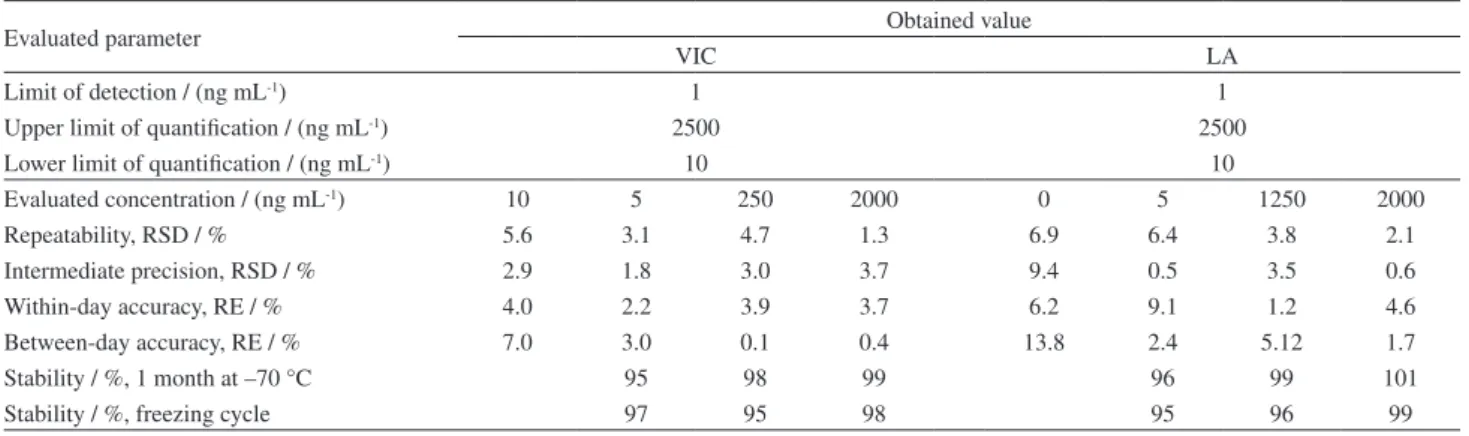
chromatogram obtained from UPLC-MS/MS analysis of a blank rat plasma spiked with VIC, LA and IS, and a blank rat plasma sample analyzed in the MRM transitions for each compound. The results of the parameters evaluated for validation of the method are shown in Table 1.
About selectivity and matrix effect, no endogenous
interference was observed at the retention times of VIC (1.95 min), IS (2.60 min) or LA (3.03 min) because of the high selectivity of MRM mode. The chromatograms presented in Figure 3 indicate that no significant matrix effect was observed for all compounds analyzed with this method. The fragmentation spectra of VIC and LA are shown in Figure 4 and typical chromatograms obtained from blank plasma, blank plasma spiked with LA, VIC and IS are shown in Figure 2.
The quantitative analysis of the effect matrix resulted in a RSD of 8.5% for VIC and 12.6% for LA, considered appropriate (below 15%). The linear range of the method
was sufficient to cover the concentrations of the analyzed samples, whereas any dilution of the sample was needed. The lowest concentration level that demonstrated precision
and accuracy below 20% was defined as 10 ng mL-1 (LLOQ)
for VIC and LA. The upper concentration level tested that demonstrated precision and accuracy below 15% was
defined as 2500 ng mL-1 (ULOQ) for both compounds.
The results of precision and accuracy of the developed method and the results obtained from the stability of plasma are summarized in Table 1. The values were considered appropriate to the need of this study.
Pharmacokinetic study
The non-compartmental and compartmental pharmacokinetic data are shown in the Table 2 and the fitting plot for the average plasma concentrations in Figure 5.
The values of half-time (t1/2, 24.1 min) and mean
residence time (MRT, 35.2 min) are relatively low, and both indicate that VIC remains in circulation for a short time in the body. This was expected because the high polarity of this compound (with two sugars into its structure) allows it to be quickly eliminated from the body, reflecting the
high clearance observed for the method (6.4 mL min-1).
The high volume of distribution (Vd, 221.9 mL) indicates that the substance is distributed in the body and is not concentrated only in the plasma. In a previous study with
VIC, a value of t1/2 of 1 h was found, but the route of
administration in that case was intraperitoneal, in which there is a need for absorption into the bloodstream before
systemic distribution process.19 Because of this, it is not
possible the comparison of the values previously obtained19
with the present values.
There are few studies in the literature involving PK
of C-glycosides flavones. Wang et al.20 studied PK,
tissue distribution and excretion of vitexin
(apigenin-8-C-glucoside) after oral administration to mice at doses
of 10 and 30 mg kg-1, respectively. The results showed
that vitexin was rapidly and widespreadly distributed throughout the whole body after administration and
the oral bioavailability was 3.91%.20 Another study
involving vitexin-4”-O-glycosyde (also a C-glycosylated
flavone) showed similar PK results with VIC after
IV administration of 30 mg kg-1 in mice. 21 The serum
clearance (Cl, L kg-1 h-1) was 0.04 and MRT (min) of
42.99, and although the study was conducted in another specie, the results showed similarity with the ones found
for VIC in the present work.21 These results support our
Figure 2. MRM chromatograms of blank rat plasma spiked with vicenin-2, internal standard (IS) coumarin and lychnopholic acid, and blank rat plasma sample.
Table 1. Parameters for the validation of the analytical methodology for quantification of vicenin-2 (VIC) and lychnopholic acid (LA)
Evaluated parameter Obtained value
VIC LA
Limit of detection / (ng mL-1) 1 1
Upper limit of quantification / (ng mL-1) 2500 2500
Lower limit of quantification / (ng mL-1) 10 10
Evaluated concentration / (ng mL-1) 10 5 250 2000 0 5 1250 2000
Repeatability, RSD / % 5.6 3.1 4.7 1.3 6.9 6.4 3.8 2.1
Intermediate precision, RSD / % 2.9 1.8 3.0 3.7 9.4 0.5 3.5 0.6
Within-day accuracy, RE / % 4.0 2.2 3.9 3.7 6.2 9.1 1.2 4.6
Between-day accuracy, RE / % 7.0 3.0 0.1 0.4 13.8 2.4 5.12 1.7
Stability / %, 1 month at –70 °C 95 98 99 96 99 101
Stability / %, freezing cycle 97 95 98 95 96 99
Figure 3. Matrix effect tests using the combined infusion of standards in the mass spectrometer simultaneously to elution of a blank rat plasma sample: (a) MRM acquisition mode to detect vicenin-2, (b) MRM acquisition mode to detect the internal standard (IS) coumarin and (c) MRM acquisition mode to detect lychnopholic acid.
For LA, the values of t1/2 (3.1 min) and MRT (6.1 min)
were even smaller than for VIC, indicating that this substance also remains intact for a short time in circulation in the body. The fast elimination can occur due to deprotonated form, and therefore, more polar state of the compound in the physiological pH. The high value of
Figure 5. Plasma concentration vs. time of lychnopholic acid and vicenin-2 in Wistar rats after IV administration (n = 7 and dose of 2.0 mg kg-1, and
n = 8 and dose of 0.5 mg kg-1, respectively).
0 100 200 300 400 500 600
5 15 25 35 45 60 90 120
P la s m a c o n c e n tr a ti o n / (n g m L -1)
time / min
Vicenin-2 Lychnopholic acid 0 200 400 600 800 1000 1200
3 5 8 12 15 20 25 30
P la s m a c o n c e n tr a ti o n / (n g m L -1)
time / min
Table 2. Pharmacokinetic parameters calculated for vicenin-2 (VIC) and lychnopholic acid (LA) after IV administration in Wistar rats assuming one compartmental body model and non-compartmental analysis
VIC, 0.5 mg kg-1 (n = 8) LC, 2.0 mg kg-1 (n = 7)
Mean ± SD Mean ± SD
Compartmental analysis
Ke / min-1 0.029 ± 0.003 0.229 ± 0.030
t1/2 / min 24.1 ± 2.6 3.1 ± 0.4
Cl / (mL min-1) 6.4 ± 1.3 130 ± 20
Vd / mL 221.9 ± 48.5 570 ± 130
Non-compartmental analysis
AUC0-inf / (ng min mL-1) 20012.1 ± 4848.7 7639.62 ± 2341.1
AUMC0-inf / (ng min mL-1) 557287.0 ± 123824.4 44823.1 ± 9858.9
MRT / min 35.2 ± 2.9 6.1 ± 1.1
SD: standard deviation; Ke: elimination constant; t1/2: half-life; Cl: serum clearance; Vd: volume of distribution; AUC0-inf: area under the curve from time 0 to
infinity; AUMC0-inf: area under the first moment curve from time 0 to infinity; MRT: mean residence time.
the volume of distribution (Vd, 570 mL) shows that this compound is distributed in the body and is not concentrated in the plasma as well as VIC.
Considering the IV administration and the better quality information that this provides about distribution and elimination phases of two possible biomarkers of
Lychnophora, this work is important to help to understand the pharmacokinetic of flavonoids and phenolic compounds present in this genus.
Conclusions
A rapid, sensitive and specific UPLC-MS/MS method for determination of VIC and LA was developed and validated. The methodology was successfully applied in the pharmacokinetic study of vicenin-2 and lychnopholic acid in rats after single intravenous dose. The pharmacokinetic profile obtained indicates that both compounds were rapidly distributed and eliminated from the rat organism.
Acknowledgments
CNPq and CAPES are also acknowledged for financial support.
References
1. Semir, J.; Rezende, A. R.; Monge, M.; Lopes, N. P.; As Arnicas Endêmicas das Serras do Brasil; Editora UFOP: Ouro Preto, MG, Brazil, 2011.
2. Gobbo-Neto, L.; Santos, M. D.; Kanashiro, A.; Almeida, M. C.; Lucisano-Valim, Y. M.; Lopes, J. L. C.; Souza, G. E. P.; Lopes, N. P.; Planta Medica2005, 71, 3.
3. Nagaprashantha, L. D.; Vatsyayan, R.; Singhal, J.; Fast, S.; Roby, R.; Awasthi, S.; Singhal, S. S.; Biochem. Pharmacol. 2011, 82, 1100.
4. Miguel, O. G.; Lima, E. O.; Morais, V. M. F.; Gomes, S. T. A.; Delle Monache, F.; Cruz, A. B.; Cruz, R. C. B.; Cechinel, V.; Phytother. Res. 1996, 10, 694.
5. Jordão, C. O.; Vichnewski, W.; De Souza, G. E. P.; Albuquerque, S.; Lopes, J. L. C.; Phytother. Res. 2004, 18, 332. 6. Gouvea, D. R.; Meloni, F.; Ribeiro, A. D. B.; Lopes, J. L. C.;
Lopes, N. P.; Anal. Chem. Acta2012, 748, 28.
7. Liu, X. Y.; Xu, T.; Li, W. S.; Luo, J.; Geng, P. W.; Wang, L.; Xia, M. M.; Chen, M. C.; Yu, L.; Hu, G. X.; Biomed. Res. Int. 2013, 2013, 789184.
8. Shin, S. C.; Choi, J. S.; Li, X.; Int. J. Pharm. 2006, 313, 144. 9. Crozier, A.; Del Rio, D.; Clifford, M. N.; Mol. Aspects Med.
2010, 31, 446.
10. Butterweck, V.; Li, L.; Brunner, I.; Han, A. R.; Hamburger, M.; Kinghorn, A. D.; Frye, R.; Mol. Nutr. Food Res. 2011, 55, S67. 11. Maldaner, L.; Jardim, I. C. S. F.; Quim. Nova2009, 32, 214.
12. Pedraglio, S.; Rozio, M. G.; Misiano, P.; Reali, V.; Dondio, G.; Bigogno, C.; J. Pharm. Biomed. Anal. 2006, 44, 665. 13. Ramanathan, R.; Mass Spectrometry in Drug Metabolism and
Pharmacokinetics; Wiley: New Jersey, USA, 2008.
14. Gouvea, D. R.; Ribeiro, A. B. B.; Thormann, U.; Lopes, N. P.; Butterweck, V.; J. Nat. Prod. 2014, 77, 464.
15. Agência Nacional de Vigilância Sanitária (ANVISA); Dispõe sobre os Requisitos Mínimos para a Validação de Métodos Bioanalíticos Empregados em Estudos com Fins de Registro e
Pós-registro de Medicamentos, Resolution - RE No. 27, 2012. 16. International Conference on Harmonisation of Technical
Requirements for Registration of Pharmaceuticals for Human Use (ICH); Validation of Analytical Procedures Q2B: Text and Methodology; ICH: Geneva, Switzerland, 2005.
17. Marchi, I.; Viette, V.; Badoud, F.; Fathi, M.; Saugy, M.; Rudaz, S.; Veuthey, J. L.; J. Chromatogr. A2010, 1217, 4071. 18. Matuszewski, B. K.; Constanzer, M. L.; Chavez-Eng, C. M.;
Anal. Chem. 2003, 75, 3019.
19. Jabor, V. A. P.; Soares, D. M.; Diniz, A.; de Souza, G. E. P.; Lopes, N. P.; Nat. Prod. Commun.2010, 5, 741.
20. Wang, H.; Jiang, Z. Z.; Du, H. B.; Liang, C. Y.; Wang, Y. C.; Zhang, M. H.; Zhang, L. Y.; Ye, W. C.; Li, P.; J. Chromatogr. B 2012, 903,68.
21. Wang, Y.; Qu, G.; Zhang, W.; Xue, C. Y.; Yin, J.; Lu, D.; Ying, X.; Lat. Am. J. Pharm. 2012, 6, 844.
Submitted: June 21, 2016
Published online: August 31, 2016