ISSN 1806-3713 © 2016 Sociedade Brasileira de Pneumologia e Tisiologia
http://dx.doi.org/10.1590/S1806-37562016000000114
What is the importance of calculating
sample size?
Cecilia Maria Patino1,2, Juliana Carvalho Ferreira1,3
1. Divisão de Pneumologia, Instituto do Coração – InCor – Hospital das Clínicas, Faculdade de Medicina, Universidade de São Paulo, São Paulo, Brasil. 2. Department of Preventive Medicine, Keck School of Medicine, University of Southern California, Los Angeles, CA, USA.
3. Methods in Epidemiologic, Clinical and Operations Research–MECOR–program, American Thoracic Society/Asociación Latinoamericana del Tórax. PRACTICAL SCENARIO
In a controlled, randomized clinical trial on the man-agement of asthma in pregnant women, researchers evaluated the effect of implementing a program in which a portable device was used for asthma control, as assessed by the Asthma Control Questionnaire (ACQ). In clinical research, our goal is to make an inference regarding something about a population by studying a sample of that population. This sample has to be representative of the target population, and the number of participants must be appropriate. It should be large enough that the
probability of inding differences between groups by
mere chance is low and that of detecting true, clinically
signiicant differences is high. However, the number
of participants should not be so large that resources are wasted or participants are exposed to unnecessary risk. Therefore, in the study design phase, it is essential to perform sample size calculation. To perform this
calculation, one must deine the key characteristics
of the study, such as the study design, the primary endpoint, the expected variability, the degree of certainty desired, and the predicted number of participants who
will drop out of the study. To deine these parameters
and calculate the ideal sample size, we need to obtain
deep knowledge of the ield of research in question by
reviewing the literature and biostatistics.
In our example, the researchers tested the effect that using a new device had on asthma control (the primary
outcome) compared with the usual treatment. They estimated that the difference between the groups would be 0.55 points on the ACQ, with a standard deviation of 0.66
points, a power of 80%, and a level of signiicance of 5%.
In addition, they estimated that 25% of the participants could be lost to follow-up. Using those data, the authors calculated that they needed to include 72 participants. At the end of the study, the researchers analyzed the results of 69 participants and showed that the new intervention improved asthma control in pregnant women.
BASIC CONCEPTS
Power
In biostatistics, power is deined as the probability of obtaining a statistically signiicant result when there
is a real difference between treatments. In general, a power of at least 80% is needed in order to ensure a high probability of observing the effect, if any, of the intervention. To increase the power to detect differences, it is necessary to increase the sample size (Figure 1).
Critical level of signiicance
The critical level of signiicance is usually ≤ 5%. If we
want greater certainty that a difference observed in the study population is not coincidental, we need to increase the sample size.
Effect size and variability
The greater the effect of the new intervention on the outcome is, the smaller is the sample size needed in order to prove it. Conversely, to show smaller effects, it is necessary to increase the sample size. If there is great variability of the effect in the population, we will also need a larger sample size (Figure 1).
It should be borne in mind that the sample size calculation is based on estimates and assumptions that can be inaccurate and is therefore subject to error. It is also important to be realistic when choosing the
estimates employed in calculating the sample size. Highly
optimistic choices about the effect size increase the risk
of calculating an insuficient number of participants for
the sample, whereas highly pessimistic choices can make the study unviable by resulting in a sample size that is too large to be practical.
RECOMMENDED READING
1. Zairina E, Abramson MJ, McDonald CF, Li J, Dharmasiri T, Stewart K, et al. Telehealth to improve asthma control in pregnancy: a randomized controlled trial. Respirology. 2016 Mar 31. doi: 10.1111/resp.12773 [Epub ahead of print]
2. Hulley SB, Cummings SR; Browner WS; Grady DG. Delineando a Pesquisa Clínica. 3rd ed. Porto Alegre: Artmed; 2008.
3. Ferreira JC, Patino CM. What does the p value really mean? J Bras Pneumol. 2015;41(5):485. http://dx.doi.org/10.1590/S1806-37132015000000215
300
250
200
150
100
50
0
0.20 0.30 0.40
Estima
ted sample siz
e
Treatment effect Power 80% Power 85% Power 90%
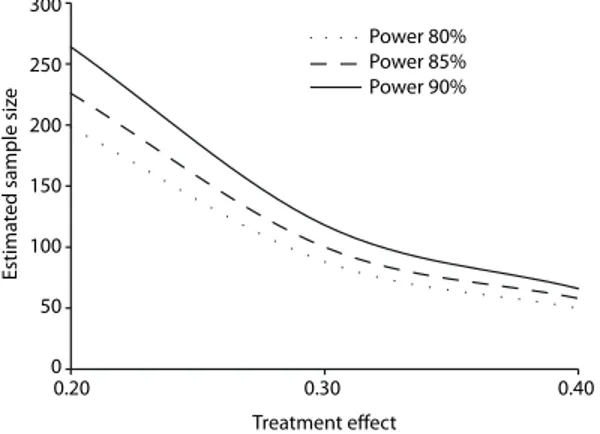
Figure 1. Relationship between the size of the treatment effect and the estimated sample size. On the x axis, we show hypothetical values for the size of the treatment effect, expressed as scores on the asthma symptoms questionnaire. We considered a ixed degree of variability (standard deviation) of 0.5 points and a level of signiicance of 5%. As the size of the treatment effect increases, the estimated size of the sample decreases. It is also clear that for the same effect size, choosing a higher power to detect the effect of the treatment causes an increase in the sample size.
J Bras Pneumol. 2016;42(2):162-162
162