Received: July 3, 2011 Accepted: October 14, 2011
Conflict of interests:The first author was the secretary of health of Capão Bonito, during the time that this study was conducted. The other authors state that there are no financial and personal conflicts of interest that could have inappropriately influenced their work.
Copyright: © 2011 Olivati et al.; licensee EDIPUCRS. This is an Open Access article distributed under the terms of the Creative Commons Attribution-Noncommercial-No Derivative Works 3.0 Unported License.
Quality of drinking water fluoridation of
Capão Bonito, SP, Brazil, evaluated by
operational and external controls
Qualidade da fluoretação da água de Capão Bonito, SP, Brasil,
avaliada pelos controles operacional e heterocontrole
Fabrício Narciso Olivati a
Maria da Luz Rosário de Souza a
Livia Maria Andaló Tenuta a
Jaime Aparecido Cury a
a Piracicaba Dental School, UNICAMP, Piracicaba, SP, Brazil
Correspondence: Jaime Aparecido Cury
Faculdade de Odontologia de Piracicaba CP 52
Av Limeira 901 Piracicaba, SP – Brazil 13414-903
E-mail: jcury@fop.unicamp.br
Abstract
Purpose: To evaluate the quality of drinking water fluoridation of Capão Bonito, SP, Brazil, whose optimal fluoride concentration should be between 0.6 to 0.8 ppm F, considering the balance benefits/risks.
Methods: Historical records (n=1,964) from 2005 to 2009 of the water treatment plant (operational control) were evaluated. Also, from July 2009 to June 2010, 120 samples of the network water were collected for analysis and the fluoride concentrations found (external control) were compared with records of operational control of the same period.
Results: According to the historical records, 76.3% of the samples had acceptable fluoride concentration and this value was confirmed by the external control done during one year, which found that 80.8% of samples were within the optimal range. However, considering the samples out the optimal range, while the records of the operational control showed values below the minimum, the results of the external control found higher percentage of samples above the maximum.
Conclusion: The data show the relevance to have a quality control of drinking water fluoridation because at same time the operational control analysis suggests that certain percentage of the population would not be receiving anticaries benefits, the external control indicates that it would be in increased risk of fluorosis.
Key words: Fluoride; fluoridation; water quality; dental caries; dental fluorosis
Resumo
Objetivo: Avaliar a qualidade da fluoretação da água de Capão Bonito, SP, Brasil, cuja concentração de fluoreto deveria estar entre os limites de 0,6 e 0,8 ppm F, considerando o equilíbrio benefícios/riscos.
Metodologia: Foram consultados 1964 registros feitos de 2005 a 2009 pela empresa responsável pelo tratamento da água (controle operacional). De 07/2009 a 06/2010, 120 amostras de água foram coletadas e as concentrações de fluoreto encontradas (heterocontrole) foram comparadas com as registradas pelo controle operacional do mesmo período.
Resultados: De acordo com os registros históricos, 76% das amostras tinham concentrações aceitáveis de fluoreto e este valor médio foi confirmado pelo heterocontrole feito, o qual encontrou um valor de 81%. Entretanto, considerando as amostras abaixo e acima dos limites aceitáveis, enquanto os registros do controle operacional mostraram maior porcentagem de valores abaixo do mínimo, os resultados do heterocontrole detectaram maior porcentagem acima do limite máximo.
Conclusão: O relatado mostra a importância de haver um controle de qualidade da fluoretação da água de abastecimento publico, porque enquanto as análises feitas pelo controle operacional sugerem que uma porcentagem da população não estaria recebendo os benefícios da fluoretação, o heterocontrole aponta que ela estaria sob risco aumentado de fluorose dentária.
Introduction
Water luoridation is considered an important public healthy strategy to control dental caries and its importance was ratiied in a systematic review of the literature comprising 214 studies, which concluded that luoridation of public water supply was effective in preventing dental caries and it was statistically associated with a decreased proportion of children with dental caries. Also, according to this systematic review there is no clear evidence of other potential adverse effects of water luoridation besides the known effect of dental luorosis (1).
Therefore, to guarantee the balance between the anticaries beneits of drinking water luoridation and the risk of aesthetically concerning luorosis by the ingestion of luoride in the irst years of life, the concentration of luoride in drinking water must be maintained within an optimal range, which is deined according to the average of maximum temperatures in each location (2). For most the Brazilian cities, the recommended optimal concentration of luoride in drinking water may be between 0.6 and 0.8 ppm F, although in colder cities in the south regions a value of 0.9 ppm F is admitted (3).
In Brazil, by a federal law of 1974 (4), water luoridation became mandatory in all cities having a water treating plant. However, not only the availability of water luoridation is important, but also the quality of the water in terms of luoride concentration. Although water treating companies perform their own operational control of the luoride concentration in the drinking water, analyses made independently (external control) have shown a great percentage of water samples which do not comply with the recommended levels. In this context, Catani et al. (5) reported data of 10 years of external control of water luoridation of 10 Brazilian cities, showing that approximately 40% of water samples analyzed were out of the optimal range. Likewise, Panizzi and Peres (6) found, in ten years of external control of public water luoridation of Chapecó, SC, Brazil, that only 40 to 60% of the samples presented optimum luoride concentration. These publications and others show that a program of control of the quality of luoride concentration in water network done by an independent laboratory (here named external control) should be implemented, in addition to the operational control done at the water treatment plant and in the water distribution network by the public or private companies responsible for the water treatment of each city.
Thus, the purpose of this study was to assess the luoride concentration of public water supply of Capão Bonito-SP, evaluating historical data and conducting, during one year, an independent analysis.
Methods
Study site
Capão Bonito is a town located in São Paulo state, Brazil, whose water was luoridated in 1979. The recommended luoride concentration in the water, according to the average
daily maximum temperature, is 0.7 ppm F, ranging between a minimum of 0.6 and a maximum of 0.8 ppm F (3,7).
The treatment of the water is made by one central plant that is responsible for water distribution to the urban area and in the rural area there are four wells, whose water are also luoridated. Hydroluosilic acid is used as luoride source in all systems.
Study design and fluoride analysis by the external control
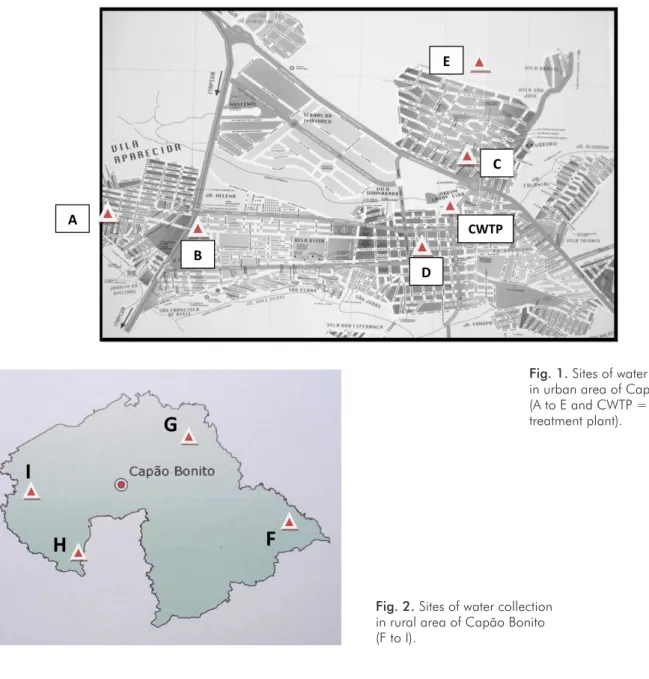
Historical records of water concentration, from January 2005 to December 2009, were obtained from SABESP, the company responsible for water treatment. During this period a total of 1,964 analysis of luoride, 919 from urban and 1,045 from rural area, were made by the operational control. According to SABESP, luoride determinations were made every hour in the water that leaves the central treatment plant (Fig. 1, CWPT site) and once a day in the network of the urban area (Fig. 1, sites A-E). In the rural area, samples of water of 4 sites (Fig. 2) were collected once a day for analysis. Fluoride concentration was determined at the laboratory of the central water treatment by a colorimetric method (SPADNS).
Also, from July 2009 to June 2010 we collected monthly 10 samples of water, 6 from the urban (Fig. 1) and 4 from the rural area (Fig. 2) for luoride analysis in one independent labo-ratory, performing an external control (n=120) of the quality of the luoridation offered to the population. The results of this external control were compared with those recorded by the operational control during the same period of time (n=526).
The number of 10 water samples analyzed was twice that recommended by Brazilian guidelines (8) to be representative of the urban and rural areas that receive water luoridated by two different systems. Figures 1 and 2 show the sites where the water samples were collected for the independent analysis of luoride. The sites were coded by the researcher to maintain the study blind regarding the luoride analysis. The 10 water samples were collected monthly in scheduled days and at same time by 10 persons, enabling a comparison on real time of luoride concentration in the all the water network.
The water samples were collected in 10-mL plastic bottles, labeled with the code location and date and were sent to the Oral Biochemistry Laboratory of Piracicaba Dental School, University of Campinas, for luoride analysis. Fluoride concentration in the samples was determined using ion-speciic electrode (Orion 96-09), connected to an ion analyzer (Orion EA-940), previously calibrated with standards from 0.125 to 1.00 ppm F (9). Both samples and standards were buffered with TISAB II in a 1:1 ratio. The samples were analyzed in duplicate and the results were returned by e-mail to the responsible for this research (F.O.) within three days after samples arrival.
Results
The historical records of the operational control from 2005 to 2009 showed consistent percentages of water samples within the optimal range (Fig. 3), with an average of 76% of samples with luoride levels between 0.6 and 0.8 ppm F, 20% with less than 0.6 ppm F and 4% with more than 0.8 ppm F. The highest luoride concentration in the water during this period was found in District G, in the rural area, with a value of 5.43 ppm F in August 2007; the lowest F concentration was also found in District F, in the rural area, with a value of < 0.10 ppm F in March 2005.
When the records of the urban and rural area were analyzed separately, it was found that in rural areas the percentage of samples within the recommended level (0.6 to 0.8 ppm F) were lower than those of the urban area (Fig. 4).
Fig. 1. Sites of water collections in urban area of Capão Bonito (A to E and CWTP = central water treatment plant).
Fig. 2. Sites of water collection in rural area of Capão Bonito (F to I).
H
I
F
G
C
CWTP
D E
A
B
Fig. 3. Percentage of water samples presenting fluoride
concentration between the acceptable range (0.6 to 0.8 ppm F), below the minimum (<0.6 ppm F) and above the maximum (>0.8 ppm F), from 2005 to 2009 and the average, according to the historical records of the operational control.
Year and Average
During the external control conducted between 2009 and 2010, 97 of the 120 samples collected (80.8%) presented luoride concentrations within the recommended levels, 15 (12.5%) had a concentration higher than that recommended and 8 (6.7%) had concentrations insuficient to it within the optimal concentrations (Fig. 5). During this period, the minimum and maximum luoride concentrations found were <0.08, in the District F (Fig. 2) on October 2009, and 1.8 ppm F in the water leaving the central plant treatment (Fig. 1, code CWTP), on September 2009.
Figure 5 also shows that the average percentage of water samples presenting luoride concentration below
and above the acceptable range differs when the analysis were made by the operational and external control. Thus, while 17% of samples analyzed by operational control were below the minimum of 0.6 ppm F, according to the external control 12% presented concentration above the maximum of 0.8 ppm F. Nevertheless, there was agreement regarding the average percentage of samples presenting luoride concentration within the acceptable range of 0.6-0.8 ppm F when analyzed by the operational (80%) and by the external control (76%).
Fig. 5. Percentage of water samples presenting F concentration between the acceptable range (0.6 to 0.8 ppm F),
below the minimum (<0.6 ppm F) and above the maximum (> 0.8 ppm F), from July 2009 to June 2010 and the average*, according to the historical records of the operational control (OC) and external control (EC).
* OC = 526 and EC = 120 samples.
Fig. 4. Percentage of water samples from
urban and rural areas of Capão Bonito, Brazil, within the optimal range (0.6 - 0.8 ppm F), according to the records of the operational control from 2005 to 2009.
July/09 Aug/09 Sept/09 Oct/10 Nov/09 Dec/09 Jan/10 Feb/10 Mar/10 Apr/10 May/10 June/10 Average Month/Year and Average
0 10 20 30 40 50 60 70 80 90 100
2005 2006 2007 2008 2009
%
Year
Urban Area
Rural Area
Discussion
The anticaries effect of luoridation of public water supply is based on evidence (1). The results of the historical operational control of water luoridation in Capão Bonito, performed by SABESP, and of the external control conducted in the present study conirmed the importance of ongoing vigilance of this measure.
The historical data show that the drinking water of Capão Bonito is being regularly luoridated (Fig. 3), generating indisputable beneits to the population. On the other hand, when data of urban and rural areas were compared, we observed in rural areas a lower proportion of samples with luoride concentration close to the ideal, highlighting the dificulties to guarantee an adequate luoridation of wells. Thus, a speciic plan of quality control of the water distributed in the network is required from the water treatment company to improve the water luoridation of Capão Bonito. Also, the low (<0.08 ppm F and high (1.8 ppm F) concentrations found in the analyses made by the external control demonstrated the importance to have an independent monitoring of water luoridation. In fact, Moura et al. (10) found, in a longitudinal evaluation in Teresina, Brazil, a large variation in luoride concentration in the water supply over the 12 months analyzed.
The indings of the external water control showed that 80.8% of samples were within the concentrations considered ideal, being close to the results found in Bauru (11) and Piracicaba (12), Brazil, where after the implementation of an external control, the majority of samples water analyzed at various points of public supply were found to be within the accepted standards.
Comparing the data of the operational and external control (Fig. 5) in the same collection period, we observed that there was a disagreement regarding the percentage of samples below and above the acceptable range. Thus, while the analysis of the operational control found a higher percentage of samples below the minimal value, the external control found a higher percentage above the maximum value. The indings could suggest analytical problems with luoride analysis since the operational control used a colorimetric method and the external control used an ion-speciic electrode. However, although the water samples for these analyses were made in the same points of collect in the urban and rural areas, they were not collected at the same time or day of the month. Therefore, they should relect luctuations of luoride concentration in the water which are found in longitudinal studies (5).
These fluctuations of drinking water fluoride concentrations may not have any effect either in the beneits or risks of systemic use of luoride, since caries and
dental luorosis are chronic diseases that take time to develop (13,14). Therefore, although in the present study we have classiied the samples as having luoride concentration below the minimum value (0.6 ppm F) regarding the anticaries beneits and above the maximum value (0.8 ppm F) with respect to luorosis risks, it is relevant to know for how long these values persisted. For instance, the minimum value of <0.08 ppm F, found in the analysis made by the external control, was only observed at collection site F (Fig. 2) in October, but the average value in this site during the year was 0.7 ppm (data not shown). Thus, during most of the time the population was receiving optimally luoridated water regarding caries control. The same rationale should be applied to the 1.8 ppm F observed at site/point CWPT (Fig. 1) in September because the average annual luoride concentration was 0.8 ppm (data not shown). Therefore, during most of the time the children were receiving optimally luoridated water regarding luorosis risks and in fact these luctuations are not responsible for higher prevalence of luorosis (15,16). In fact, this classiication of water luoride concentration considering values below (<0.6 ppm F) and above (>0.8 ppm F) the optimal range (0.6-0.8) in terms of beneits and risks of drinking luoridated water has been currently discussed in Brazil (3,17).
During the period that this study was conducted, no interruption of luoridation was observed. Also, only 0.55% of data from the operational control were not found in the records made, indicating that the operational control has been effective, but the maintenance of levels of luoride in optimal concentrations is still a challenge, especially in the rural areas, where wells are luoridated, because each one of them should be under control.
Conclusions
This study shows the relevance to have independent quality control of luoride concentration in drinking water because the percentage of the population that would receive water with luoride concentrations below the minimum or above the maximum in terms of beneits/risks are different, based on analysis found by the operational or the external control.
Acknowledgement
References 1. McDonagh MS, Whiting PF, Wilson PM, Sutton AJ, Chestnutt I, Cooper J et al. Systematic review of water fluoridation. BMJ 2000;321:855-9.
Galagan DJ, Vermillion JR. Determining optimum fluoride concentrations. Public Health 2.
Rep 1957;72:491-3.
Frazão P, Peres MA, Cury JA. Drinking water quality and fluoride concentration. Rev Saude 3.
Publica 2011;45:964-73.
Brasil. Lei Federal nº 6.050, de 24/05/1974. In: Coleção das Leis de 1974: Atos do 4.
Poder Legislativo: leis de abril a junho. Brasília, DF: Departamento de Imprensa Nacional; 974. v.3, p.107.
Catani DB, Amaral RC, Oliveira C, Souza MLR, Cury JA. Ten years of external control 5.
of the fluoride level in public drinking water by Brazilian cities, Brazil, 1996-2006 (in Portuguese). RGO 2008;56:145-9.
Panizzi M, Peres MA. Ten years of external control over water fluoridation in Chapecó, Santa 6.
Catarina State, Brazil (in Portuguese). Cad Saúde Pública 2008;24:2021-31.
Ministério da Saúde. Portaria 635 de 26 de dezembro de 1975. Aprova normas e padrões 7.
sobre a fluoretação da água de sistemas públicos de abastecimento. Diario Oficial União. 30 jan 1976 [cited 2006 Jan 18]. Available from: http://189.28.128.100/dab/docs/ legislacao/portaria 635_26_12_75.pdf.
Brazil. Ministry of Health. National guideline on sampling plan of the environment 8.
health vigilance for assessment of quality of water for human use. Brasília. 2006. (in Portuguese).
Martínez-Mier EA, Cury JA, Heilman JR, Katz BP, Levy SM, Li Y, Maguire A et al. Development 9.
of gold standard ion-selective electrode-based methods for fluoride analysis. Caries Res 2011;45:3-12.
Moura MS, Silva JS, Simplício AHM, Cury JA. Long-Term Assessment of Fuoride Level of Public 10.
Water Supply in Teresina-Piauí (in Portuguese). Rev Odonto Ciênc 2005;20:132-6. Ramires I, Maia LP, Rigolizzo DS, Lauris JLP, Buzalaf MAR. External control of water supply 11.
in Bauru, SP, Brazil. Rev Saúde Pública 2006; 40:883-9.
Amaral RC, Sousa MLR. Eight months of external control of fluoride levels in the public 12.
water supply in Piracicaba, São Paulo, Brazil. Revista de Odontologia da Universidade Cidade de São Paulo (in Portuguese). 2007;19:131-6.
Cury JA, Tenuta LM. Enamel remineralization: controlling the caries disease or treating 13.
early caries lesions? Braz Oral Res 2009;23 Suppl 1:23-30.
Bardsen A. “Risk periods” associated with the development of dental fluorosis in maxillary 14.
permanent central incisors: a meta-analysis. Acta Odontol Scand 1999;57:247-56. Catani DB, Hugo FN, Cypriano S, Sousa Mda L, Cury JA. Relationship between fluoride levels 15.
in the public water supply and dental fluorosis. Rev Saude Publica 2007;41:732-9. Catani DB, Tenuta LM, Andaló FA, Cury JA. Fluorosis in rats exposed to oscillating chronic 16.
fluoride doses. Braz Dent J 2010;21:32-7.
Classificação de águas de abastecimento público. Documento de consenso técnico [Acesso 17.