Numerical modeling of failure mechanisms in phyllite mine slopes
in Brazil
Lana Milene Sabino
⇑School of Mines, Mining Engineering Department, Federal University of OuroPreto, OuroPreto, Brazil
a r t i c l e
i n f o
Article history:
Received 13 January 2014
Received in revised form 10 March 2014 Accepted 15 May 2014
Available online 21 November 2014
Keywords: Soft rocks Mine slopes Numerical modeling Failure mechanisms
a b s t r a c t
This paper presents three case studies comprising failure mechanisms in phyllite mine slopes at Quadrilá-tero Ferrífero, State of Minas Gerais, Brazil. Numerical modeling techniques were used in this study. Fail-ure mechanisms involving discontinuities sub parallel to the main foliation are very common in these mines. Besides, failure through the rock material has also been observed due to the low strength of phyl-lites in this site. Results of this work permitted to establish unknown geotechnical parameters which have significant influence in failure processes, like the in situ stress field and the discontinuity stiffness. Ó2014 Published by Elsevier B.V. on behalf of China University of Mining & Technology.
1. Introduction
Soft rocks affected by complex tectonic processes tend to pres-ent a very peculiar behavior. When slopes are excavated in these rocks, a variety of failure mechanisms can take place. These mech-anisms have usually been affected by many different factors, like the geological structures and the weathering grade of the rock. A typical case of this behavior is associated with metamorphic rocks. Intense tectonic activity and the effects of chemical degradation of these rocks in tropical climate are of concern.
There is an important province of gold and iron ore occurrences in Brazil called Quadrilátero Ferrífero (QF), whose structural geol-ogy is connected to several past deformation tectonic events. This region is located in the central-southern portion of the State of Minas Gerais, at the southern side of São Francisco Craton (Fig. 1). It ranges an entire area of 7200 km2. Metamorphic rocks
in this region were extremely susceptible to past deformation events. Besides, the weathering grade of these rocks is normally high, which is another effect to be considered in their behavior.
Iron and gold open pit mines at QF usually present failure prob-lems in phyllite slopes. This study is focused on case studies involving failure along these slopes. Large scale mine slopes were also considered in this study. Therefore, stress–strain analyses have been applied to consider deformation of the discontinuities and rock masses.
This paper has been based on researches developed by Lopes, Silva and Pinheiro[1,2]. Two types of failure mechanisms due to discontinuities are discussed: flexural toppling and buckling. These mechanisms are related to discontinuities sub parallel to the main foliation in phyllites. A combined failure mechanism along the rock mass and the main foliation discontinuity is also presented.
The studies show the importance of geological structures and the low strength of phyllites in failure mechanisms of mine slopes at QF.
2. Numerical modeling of failures in large scale phyllite mine slopes at QF
2.1. Flexural toppling failure in an iron mine
A flexural toppling failure in an iron mine located in Itabirito, Minas Gerais, QF, is presented. The software UDEC, from Itasca Consulting Group Ltd. was used. As the discrete element method is able to represent failure along discontinuous materials, a com-prehensive insight in the failure process was expected with this study.
The failure occurred in 2004 involving foliation discontinuities of a sericitic phyllite. It happened after a rapid pushback in the sericitic phyllite slope face. Vertical displacements measured in the toppling region at the slope face reached a maximum value of 0.8 m, with average value equal to 0.3 m.
The studied region is constituted of a slope with benches 10 m high, catch benches 6 m wide and projected face angles of 480. The
http://dx.doi.org/10.1016/j.ijmst.2014.10.007
2095-2686/Ó2014 Published by Elsevier B.V. on behalf of China University of Mining & Technology.
⇑ Tel.: +55 3135591590.
E-mail address:[email protected]
Contents lists available atScienceDirect
International Journal of Mining Science and Technology
pit had reached a profundity of 220 m.Fig. 2displays a partial view of the slope with the position of sericitic phyllite.
Although the failure mechanism had not affected the global sta-bility of the slope, the displacement values evoked some questions about the final pit stability and the safety of mining operations at the toppling area.
Figueiredo and Aquino had presented a previous study of this failure [4]. They used the software Phase 2, Rocscience Inc., in the analyses; their model is displayed in Fig. 3. Many materials were included in that model representing the various lithologies. The lithology directly involved in toppling failure is the Fs (sericitic phyllite). The Fd (dolomitic phyllite) presented large values of dis-placements during the flexural toppling failure process in the Fs. This lithology is below the Fs (seeFigs. 2 and 3).
Initial values of mechanical properties of these materials were obtained by internal mine reports and by literature review. During the analyses they were settled, according to the field evidences of displacements in toppling region.
The in situ stress field was supposed to vary withkvalues equal to 0.5, 1.0 and 1.5. This range has been considered typical of the problem depth, according to international experience of in situ stress measures and the behavior of rock masses with similar deformability parameters[5,6].
Shear and normal stiffness of joints are dependent on the applied normal stresses. Expressions for calculating them can be found in the literature[7,8]. For small depths, where applied nor-mal stresses are less than 0.01 MPa, nornor-mal stiffness and shear stiffness were 40 and 0.4 MPa/m, respectively. For greater depths, more than 40 m, applied normal stresses are in the range 0.1– 3 MPa and values were 40 MPa for the normal stiffness and 4 MPa/m for the shear stiffness. Figueiredo and Aquino used these values during the analyses with Phase 2 (Rocscience Inc.)[4].
According to the back-analyses of flexural toppling done by Figueiredo & Aquino an in situ stress field with ak value of 1.5 was a situation that yielded displacements close to those observed in the field[4]. The maximum displacement occurred near the con-tact between sericitic and dolomitic phyllites. The large deforma-tion of the dolomitic phyllite when excavated was found to be the inducing factor of the failure mechanism in the sericitic phyllite.
Some simplifications of the model presented in Figueiredo & Aquino were necessary to facilitate execution of the software UDEC
[4]. One of them was to consider an elastic behavior for the rock material to reduce the computational effort and to simplify the input data. It avoided the specification of mechanical material properties, peak and residual, for all the rock mass and focused the study only on toppling mechanism, as failure of the rock mass is not possible in elastic behavior.
Discontinuities were introduced in the model only in sericitic phyllite; this simplification was done in the model studied by Figueiredo & Aquino[4].
Mesh automatic generation in UDEC was used. It fills each block with triangular-shaped finite difference zones. Mesh refinement in toppling region was necessary due to the large displacements expected.Fig. 4shows the mesh aspect in the phyllite region and its neighborhood.
Values of normal and shear stiffness of discontinuities used by Figueiredo & Aquino were also used in this study[4]. They were considered representative of the foliation discontinuities in the site because they had already been obtained after back-analyses of the failure.
In situ stress field was also varied withkvalues equal to 0.5, 1.0 and 1.5 as it had been done in Figueiredo & Aquino[4].
2.1.1. Model results and discussion
Magnitude of displacements and deformations and displace-ment pattern vectors were monitored in this study for three values of in situ stress field,k= 0.5, 1.0 and 1.5.
Horizontal displacements for k= 1.5 are presented in Fig. 5. Maximum values of horizontal displacements in all models occur in the top of discontinuity columns and are associated with their separation, which is a typical characteristic of flexural toppling.
Vertical and horizontal displacements became larger with the increase ofkvalue. Higher values of displacements are observed near the contact between sericitic and dolomitic phyllite, demon-strating the importance of dolomitic phyllite deformation in the beginning of the failure process.
Toppling column separation is a common feature of all models with differentkvalues.Fig. 6shows the displacement pattern vec-tors fork= 1.0. Vector displacement directions show clearly the top column separation and the flexure of columns.
The results showed the effect of in situ confining stresses and the excavation in sericitic phyllite. Lateral stress relief due to this excavation is directly related to tension stresses in top flexural col-umns and their consequent separation. As the value ofkincreases this effect is more pronounced, as expected.
2.2. Buckling failure case study
Buckling failure has been observed in mine slopes of the QF as a local failure mechanism in a slope bench or affecting many benches in a mine slope. Although these buckling failure
Brazil
Rio de janeiro 0 500 km
N
São Francisco Craton
Fig. 1.Quadrilátero Ferrífero location[3].
Fill
Quartzite
Sericitic phyllite
Dolomitic phyllite
occurrences have been reported, knowledge of the failure process involved in this mechanism is scarce.
An occurrence of buckling as a local failure mechanism in a mine slope at QF is shown inFig. 7. It occurred in a phyllite slope
of a gold open pit mine and it affected only a small portion of the bench slope. Lopes demonstrated that this failure mode had no influence in global slope stability[1]. This author studied a major failure which occurred in this slope through numerical analysis; the results showed that the failure mechanism was by shear and the geometry of the surface was circular combined with planar. His model and the results will be discussed in the item 2.3 of this paper.
Another buckling failure in an iron mine, QF, is shown inFig. 8. Large deformations were observed. A stress–strain analysis is done to evaluate how slope was affected by this mechanism and to allow a better comprehension of the failure process. Details of this study can be found in Silva[2].
Folding of the foliation discontinuities, with the consequent verticalization of this structure has created favorable conditions for buckling. Changes due to folds are responsible for the winding
Joint elements Berm
MO
SO AIFSIB Fd
Fs
HO MIB
HIB Qt
Groundwater level Ground elevation: 1403.0 m
Fill
1
1 Gravitational field stress: K=1
Boundary conditions
Fig. 3.Model for toppling failure analysis in Phase 2 (Figueiredo & Aquino[4]).
Fig. 4.Mesh aspect in phyllite region and its neighborhood.
Fig. 5.Horizontal displacements fork= 1.5.
Fig. 6.Displacement vectors fork= 1.0.
Fig. 7.Buckling failure in a bench slope of a gold mine.
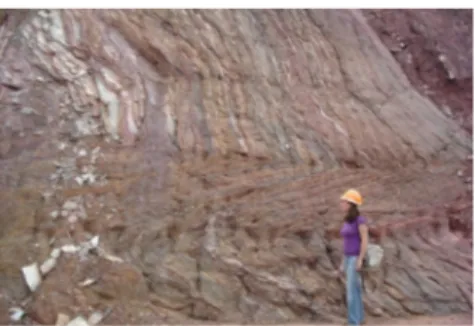
pattern of foliation layers and relatively abrupt changes in the foli-ation dip angle. This pattern can be seen inFig. 9.
Buckling failure occurred in 2002 affecting many benches. Understanding of the failure mechanism was not immediate because this slope has presented many failure occurrences as time goes by, due to the low strength and high fracturing grade of the rock mass. A geological preliminary model to elucidate the phe-nomenon was proposed by a consulting company (BVP). This model is represented by a typical geological section (seeFig. 10). The foliation trace of the rock mass inFig. 10shows the dip vari-ability of this structure due to folding, as described earlier and also illustrated inFig. 9. Average height of the global slope is 190 m.
Favorable kinematic conditions for buckling were created by the verticalization of foliation discontinuities. Buckling failure occurred in dolomitic phyllite, above the ore and to keep control of this failure it was necessary to preserve a portion of hematite ore below the dolomitic phyllite.
Tension cracks associated with buckling failure were observed at distances of 400–500 m beyond the slope crest. Large deforma-tions were also reported by BVP, seeFig. 10.
A vertical displacement of 3.5 m was observed in the benches where buckling had occurred.
Numerical modeling of buckling failure using Phase 2, Roc-science Inc., was done. Stress–strain analyses permitted the back-analysis of the failure mode and a better understanding of the phe-nomenon, as well as the calibration of rock mass geomechanical parameters. Position of tension cracks and vertical displacements reported by BVP were used to calibrate the model.
The geological model presented in Fig. 10 was used in the stress–strain analyses. Foliation discontinuities were explicitly inserted in the model using joint elements only in buckling region occurrence to decrease computational effort. A discontinuity ing of 1 m was used in the analysis to represent the observed spac-ing of layers affected by bucklspac-ing. The discontinuities in the superior portion of the model have a dip value of 60°, which grad-ually increases to 80°in the inferior part of the model, to represent the folding of the foliation (Fig. 10).
Mesh aspect is shown in Fig. 11. The discretizations were increased significantly along joint elements region to assure the results were not mesh-dependent.
The Mohr Coulomb constitutive plastic model was used in the analyses. Strength and deformability properties of the rock masses as well as the discontinuities were obtained from mine internal reports. Shear and normal stiffness of discontinuities were cali-brated by back-analyses. Initial values were calculated according to expressions proposed in the literature, which yields a value of normal stiffness equal to 40 MPa/m, and a shear stiffness equal to 4 MPa/m[7,8]. Final values after back-analyses were 50 MPa/ m for normal stiffness and 5 MPa/m for shear stiffness.
In situ stresses were also found by back-analyses, which yielded a typicalkvalue equal to 1, considering a gravitational stress field.
Fig. 12 shows yielded elements in the model with tension cracks along the slope top in the whole extension of the model. Yielded region is located mainly in the discontinuity region, show-ing their importance in slope failure mode.
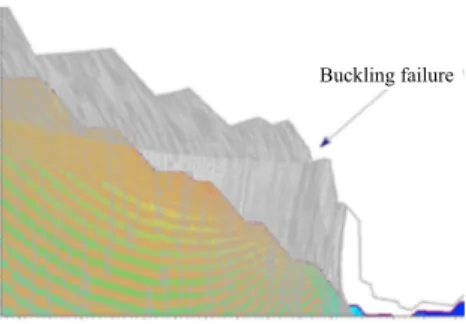
Buckling pattern can be seen in Fig. 13, which shows the deformed boundaries of discontinuities applying a magnified scale factor to allow the visualization of the model deformation mode. Buckling failure affected many benches, so it could be interpreted as a global failure mode; it is clear fromFig. 13.
The representation of the gradual change in foliation disconti-nuity dip was a key factor in the numerical modeling because it is directly connected to buckling occurrence. Otherwise, it would not be possible to obtain consistent results.
Although buckling can be considered a global failure mode, the global collapse of the model was not observed as the numerical convergence was established. However small changes in input data could lead to collapse, but this result was not considered represen-tative of the field situation.
2.3. Circular and combined failure
A study of a failure in a phyllite slope which occurred in a gold mine at QF in 2003 was done to understand the failure mechanism and to analyze the influence of various parameters in the failure process. Details of this study can be found in Lopes[1].
Fig. 9.Phyllite slabs folded showing favorable conditions for buckling.
1423 1408 1393 1378 1383 1348 DF O SF 1290 1320 1380 1410 1440 1470 1500 1530 0 330.9399 -R1 -R1+ -R2 -R2+ SF: Sericitic phyllite DF: Dolomitic phyllite O: Ore
Large buckling deformations Foliation trace
Strength class
1350
Fig. 10.Proposed geological model (BVP).
Itabirite Joints
Phyllite
Ore
Fig. 11.Geological model and mesh.
0 4 8 12 16 20 24 28 32 36 40 MPa Shear Tension
Stress–strain analyses were done by using Phase 2, from Rocscience Inc. The rock mass is constituted of a phyllite with intercalations of basic rock dykes. The failure surface which had developed in 2003 was mapped accurately. Numerical modeling permitted to reproduce the failure surface by back-analyses of the in situ stress, and also by the rock and discontinuity properties. The failure reached many benches, as it can be seen inFig. 14. A buckling failure limited to the bench slope has been observed, as it can be seen inFig. 7. Numerical modeling was done to reproduce both local and major failure mechanisms.
Foliation discontinuities were explicitly inserted in the model by using joint elements to allow the reproduction of local buckling failure. Horizontal displacements of up to 0.4 m were observed during buckling; this value was used to calibrate the numerical model as well as the failure surface extent.
The model used in numerical modeling and the mesh aspect are shown inFig. 15. Discontinuities were inserted at the slope face, extending at a considerable distance behind the slope. They were also extended at a large distance below the slope face to affect it as a whole.
A plastic model for the rock mass was considered, assuming brittle failure type. Mechanical and deformability properties of the rock masses used in the analyses were found in literature and internal reports of the mine. The geomechanical classification of the rock mass was also done to obtain estimated properties of the rock mass.
Discontinuity shear strength was determined by Lopes through lab tests[1]. Shear and normal stiffness of discontinuities were cal-culated according to expressions proposed in the literature, which yields a value of 40 and 4 MPa/m, respectively[7,8]. These values were used as initial input in numerical modeling.
Parametric analyses for in situ stress field and discontinuity stiffness were performed. The k value which better represented the failure process was equal to 1.5. In relation to discontinuity stiffness, values which better represent the failure process were found to be 18 MPa/m for normal stiffness and 1.8 MPa/m for shear stiffness.
Failure surface obtained during numerical analyses was typi-cally plane-circular, as it can be seen inFig. 16. It was interpreted using displacement vector pattern and it is close to the failure sur-face mapped in the field.
The planar portion of the failure surface was due to foliation discontinuities and the circular portion indicated a failure process through the rock mass. Numerical modeling confirmed that buck-ling failure was a local failure process, limited to the benches.
The deepening of the pit was simulated considering the effect of the excavation to reach the final pit configuration. The decrease of strength properties caused by weathering was also considered. Researchers have done alterability tests in phyllite rock of this pit, followed by shear strength tests. His results show that friction discontinuity angle remained the same (33°), but the cohesion
decreased from 159 to 118 kPa after alterability tests. The large decrease of cohesion was found to be related to the leaching of fill-ing material in foliation discontinuities durfill-ing alterability tests.
Numerical modeling of pit deepening led to global collapse (see
Fig. 17). Details of this study can be found in Silva et al.[9]. The fail-ure process pattern changed; it is typically circular indicating a possibility of failure only by the rock, even though the discontinu-ities were inserted in the model. The large decrease of cohesion due to alterability process was responsible for this failure through the rock.
3. Conclusions
Numerical modeling in phyllite mine slopes has proved to be an important tool to understand the phenomenology involved in fail-ure mechanisms at QF. Potential scenarios for the in situ stress field
Buckling failure
Fig. 13.Buckling pattern, showing deformed discontinuity boundaries.
Fig. 14.Failure extent in an open pit.
Fig. 15.Numerical model and mesh aspect.
0.00e+000 0.08e002 1.60e001 2.40e001 3.20e001 4.00e001 4.80e001 5.60e001 6.40e001 7.20e001 8.00e001 8.80e001 9.60e001 m
Fig. 16.Potential failure surface interpreted in numerical analyses.
0.00e+000 3.00e001 6.00e001 9.00e001 1.20e+000 1.50e+000 1.80e+000 2.10e+000 2.40e+000 2.70e+000 3.00e+000 3.30 e+000 3.60e+000
and discontinuity stiffness could be established during numerical modeling. These results are very important because the direct measure of these variables is a very difficult task in this type of rock. However, techniques to permit their determination are desir-able, especially the in situ stress field because its effect in failure mechanisms is significant.
The lack of measured values of in situ stress field can be related to rock mass disturbance caused by past tectonic events and high weathering grade in open pit mines at this site. On the other hand, measured values of in situ stress field near underground mines at QF seem to be in agreement with the numerical modeling results of this study.
References
[1]Lopes MC. Geotechnical behavior and failure mechanism of soft rocks-Córrego do Sítio mining. Brazil: Federal University of OuroPreto; 2006.
Mine. Brazil: Federal University of OuroPreto; 2010.
[3]Diláscio MV. Computational study of flexural toppling in phyllites. Brazil: Federal University of OuroPreto; 2004.
[4] Figueiredo RP, Aquino TVC. Characterization and preliminar back-analysis of the flexural toppling mechanism-Pico Mine/MBR. In: 11 Brazilian congress of geological and environmental engineering, Florianópolis; 2005.
[5]Goodman RE. Introduction to rock mechanics. New York: John Wiley & Sons; 1989.
[6]Sheorey PR. A theory for in situ stresses in isotropic and transversely isotropic rock. Int J Rock Mech Min Sci & Geomech Abstr 1994;31(1):23–34.
[7]Barton N, Choubey V. The shear strength of rock joints in theory and practice. Rock Mech 1977;10(1/2):1–54.
[8]Bandis SC, Lumsden AC, Barton NR. Fundamentals of rock joint deformation. Int J Rock Mech Min Sci & Geomech Abstr 1983;20(6):249–68.
![Fig. 2. Partial view of east portion of the slope, in February, 2005 [4].](https://thumb-eu.123doks.com/thumbv2/123dok_br/15713901.631195/2.892.146.332.930.1105/fig-partial-view-east-portion-slope-february.webp)
![Fig. 3. Model for toppling failure analysis in Phase 2 (Figueiredo & Aquino [4]).](https://thumb-eu.123doks.com/thumbv2/123dok_br/15713901.631195/3.892.226.672.121.342/fig-model-toppling-failure-analysis-phase-figueiredo-aquino.webp)