A Work Project, presented as part of the requirements for the Award of a Master Degree in Management from the NOVA – School of Business and Economics.
SEGMENTING SCIENCE4YOU’S CUSTOMERS FOR
RESHAPING SALES STRATEGIES
Sofia Albertina Afonso Gonçalves de Almeida | 2546
Index
Index ... ii
1. Abstract ... 1
2. Introduction ... 2
Company ... 2
Market ... 3
3. Literature Review ... 5
4. Methodology ... 9
Problem ... 9
Approaching the problem ... 9
Secondary Data ... 11
SWOT ... 12
5. Results’ discussion ... 13
SWOT ... 13
Strengths ... 13
Weaknesses ... 14
Opportunities ... 14
Threats ... 15
Focus Groups ... 15
6. Conclusions and Recommendations ... 21
Conclusions ... 21
Recommendations ... 21
7. Limitations e future research ... 23
Bibliography ... 24
1. Abstract
2. Introduction
The end goal of this project is to create different Customer Relationship Management (CRM) CRM strategies for Science4you’s segments and consequently increase customer profitability. To that end, segmentation is needed, since “implementing CRM without segmenting is ‘trying to build a house without engineering measures or an architectural plan’” (Bailey et al., 2009). Science4you is a fairly new company that has been growing very fast. As it happens in most recent companies, thee marketing department is not yet a core one in the company, there is no systematic gathering of customer data and Science4you does not know who are the people buying its toys, nor do they have a customer segmentation. The notion of customers here forth used is that of end customers, not the retailers as those only buy according to what their clients demand and are not end users.
Company
Science4you is a Portuguese company founded in 2008 and specializes in the production and development of educational toys. The company was born through a partnership between ISCTE and FCUL for Miguel Pina Martins bachelor’s project. He is Science4you’s founder and CEO. Its mission is to improve society’s educational levels by developing toys that allow kids to learn while playing (Science4you’s website).
Science4you develops the toys internally and buys the components to external agents. Also, each toy includes an instructive manual, both with instructions and information related to the experience, so that the child can understand a bit better the experience. Besides, the company also provides services such as scientific birthday parties and scientific camps during school holidays. However, this is not the core business of the company and only represented 4,1% of revenues in 2015.
Science4you has expanded internationally and its products can currently be found in 27 different countries worldwide.
In 2015, the Portuguese holder had revenues of 9 million euros which corresponded to a homologous growth of 70,9%. In the first semester of 2016 the company grew 120% (3,4 million euros) compared to the first semester of 2015.
Moreover, in terms of market share, it is possible to identify a growth tendency in the percentage held by Science4you. In 2014 the company achieved a share of 1,35% in the Portuguese market compared with 3,01% in 2015. That tendency was continued through the current year: Science4you had a market share of 5,35% in the period Jan-May 2016.
Another important thing to approach is the card “Super Cientista”, Science4you’s loyalty card. The benefits it offers are the following: 15% discount in the first purchase and 10% in following purchases. It can be made both in stores and online.
Market
In 2015 the world economy had a slight slowdown in its growth figures comparing to 2014. According to the World Economic Outlook of January 2016, worldwide economy growth was 3,1% in 2015 (3,7% in 2014).
Europe wise, the toys and games market registered a moderate growth (2,7% compound annual growth) during the 2010-2014 period, consequence of the worldwide crisis, that made consumers lower or abandon the expenditure on these goods in detriment of other necessities (Toys & Games Industry Profile, 2015).
The forecasts point to a similar, though higher growth rate for the period 2014-2019. In 2019 sales revenues are expected to achieve a 19,5% growth when compared to 2014 (in Europe) (Toys & Games Industry Profile, 2015).
is even more relevant in southern European countries (EC, 2008; toy industries of Europe, 2013).
Focusing on the Portuguese market in specific, there is not much relevant data available about the educational toy segment rather it relates to the toy market in general (appendix 2). This market registered a growth rate of 19,05% in 2015 and for the period Jan-May 2016, that rate was already 21%. Science4you had better figures for both periods with 70,9% in 2015 and 120% for the first semester of 2016.
Although there is no data for the educational market in specific, we may focus on some available figures tied to that segment. The following categories can be a good proxy for the educational segment: arts & crafts, building sets and games & puzzles. (appendix 3)
It is possible to conclude that all segments registered more than 20% growth in both periods of 2015 and 2016, and so it is possible to conclude, by proxy, that the educational toys’ segment is an attractive one with interesting growth rates, in most cases above the industry’s growth. Further, it is also possible to conclude that this increase is not caused by less sales of more expensive toys, since the units sold grew in every category in both years (appendix 4).
Still considering the Portuguese market, results for the month of May 2016 show that the dominant companies are Lego with a market share of 15%, Hasbro with 11%, Concentra, Famosa and Mattel all with a 9% market share, Science4you (6%) and Clementony (3%). (appendix 5). It is important to recall that these figures relate to the overall toy market and not to the segment of educational toys.
3. Literature Review
The concept of segmentation was first introduced by Smith (1956) who defended dividing the market into different groups with homogeneous characteristics in order to develop specific actions to serve each segment (Canhoto, Clark, & Fennemore, 2013).
Segmentation emerged due to several reasons, one of which was the decrease in the number of units necessary for an efficient production (Bailey, Baines, Wilson, & Clark, 2009). Rigidities from mass production became less significative, meaning that the need for generalization became lower. Generalization was a response to the necessity for long production runs of similar elements, which today is no longer a significant constraint as it was in the industrial period (Smith, 1956).
When deciding to pursue a segmentation process, the first step is to decide which criteria to use to differentiate customers from each other. Those criteria are not mutually exclusive, in fact, companies often use several criteria at the same time to segment their customers (Foedernayr & Diamantopoulos, 2008). Nonetheless, the criteria chosen are often “determined by what is possible rather than what is desirable” (Bonoma & Shapiro, 1983), bearing in mind that despite homogeneity, segments still need to be significative in size, since “segments need to be big enough to make marketing action feasible, yet small enough to ensure intra-segment homogeneity.” (Foedernayr & Diamantopoulos, 2008).
Frank, Massy and Wind (1972) classify segmentation variables in the following way: general - those that are independent of product/services - and product-service - those directly related to the product/service or the customer. Also, these variables can also be observable or inferred (Foedernayr & Diamantopoulos, 2008).
Predicting the future possible value that a consumer may bring to the company, counterbalanced with the costs the company will incur with that customer allows the company to maximize CLV. (Jarratt & Fayed, 2012). To this end, the company should start by evaluating its customers’ profitability. To do so there are two basic approaches: grouping customers on relative or absolute profitability (Storbacka, 1997). After that the company must develop programs to maintain and extract the most value from the relationships with the most profitable customers. Yet another, more complete way, to segment customers is a combination of both profitability and frequency of purchase (Storbacka, 1997).
Segmentation can further be differentiated into operational and strategic. Operational segmentation is driven by short term goals and strategic segmentation is driven by strategic goals, meaning long term goals (Saunders, Lewis & Thornhill, 2008).
Nowadays companies face an environment of fierce competition, especially those in the consumer goods’ industry and for most businesses it is simply impossible to fully satisfy all the clients, by focusing on the most attractive ones, the impact of limited resources can be enhanced. By focusing marketing efforts on certain segments, the impact of limited resources can be increased (Dibb,2001).
This context makes it crucial for companies to augment customer value to the maximum. In order to achieve that, companies must differentiate customers and focus on the most attractive segments, focusing on long term rather than short term (Cuadros & Domínguez, 2014). In this case we are dealing with strategic segmentation, the goal is to have long term strategies for the different segments rather than just a quick increase in profits that wouldn’t probably be maintained in the long term.
The value from segmenting existing customers in a company arises from the difference between preferences, sales volume, volume of transactions and profitability of different profiles of customers. In order to decide which segments to focus on, marketing managers consider the pros and cons of each segment, such as size, profitability, and growth expectations (Simkin & Dibb, 1998). In this evaluation process, deciding whether a segment is attractive or not should also take into consideration the alignment between customers’ preferences and company’s competences. (Piercy & Morgan, 1993).
them to competitors or to increase their spend within the company (Foedernayr & Diamantopoulos, 2008).
Segmentation is not, however, easy to conduct, as it was already mentioned, companies must, many times go with what is possible rather than what is desirable in terms of criteria for segmentation and that is because segmentation variables may be difficult to observe (Hines & Quinn, 2005) as it happens, for example, with intention and motivation. Difficulties may also arise from “deception activity or misrepresentation by the customers” (Canhoto, 2008). This particular difficulty will be observed in the case of Science4you, since the users (children) and the buyers (adults) are not the same people.
In this specific case, the end goal of this customer segmentation is to increase customer profitability, to that end 2 premises must be met: firstly, evaluate the existing customer base to determine its degree of homogeneity over a number of variables; the second premise relates to the “prospective” and accesses the company’s ability to enhance the customer-company relationship (Storbacka, 1994).
Although segmentation is widely used, it takes several of company’s resources and despite being very important, some hurdles arise when trying to implement an effective segmentation: many times the segmentation processes does not result into homogeneous groups of customers to which relevant marketing programs can be applied. (Dibb, 2001). This obstacle comes from several possible sources: “infrastructure barriers” refer to those that impede the segmentation process to even start; “process issues” relate to the difficulties in carrying the segmentation action; “implementation issues” represent barriers to the activation of the segments found (Dibb, 2001).
Concluding, whatever the case of segmentation, the most important takeaway is that made by Wind (1978), stating that there’s “no single best way” to segment a market or customer base and that the way we segment depends on what we are trying to achieve (Piercy & Morgan, 1993). For that reason, I took some inputs from the literature review and still added data collection to help me perform a strategic segmentation.
4. Methodology
Problem
Science4you wishes to develop different marketing programs to the different segments in order to increase segment penetration and profit, and to make customers (more) loyal. In order to do that, the company must first know who are the end users, what different segments is the company reaching.
Approaching the problem
It was already mentioned the problem with users vs buyers in the toy market. This posed the first problem when deciding how to approach the problem: should the segmentation be aimed at users or buyers?
Children have significant influence on which toys parents buy however adults are the ones buying in most cases. When tension exists between what kids and adults want some hurdles arise: price, age appropriateness, occasion/ rationale of the purchase, and also perceived quality and value of the toy (The Family Room, 2013). If those issues are solved, adults make the actual decision and that’s why the segmentation will be focused on the buyers and not users. Since buyers also take into consideration what kids want, this segmentation criterion will also reflect children’s preferences.
used by the company is the e-mail and so only people with e-mail (usually adults) can be reached while complying with legal practices.
In order to segment existing customer basis, it is useful to use all the information the company already has on its clients, it makes the researcher’s job easier as he can start approaching the problem with some insights on its target.
The purpose of this study was to identify Science4you’s customers and the fact that so little was known about them made the initial task best addressed by an exploratory study (Saunders, Lewis, & Thornhill, 2008), that identifies the general patterns of possible segments. That’s why personal interviews were performed in the form of focus groups, with open and probing questions (Saunders et al., 2008).
Focus groups consist in group interviews where the interviewees are aware of the topic and discussion between participants is encouraged. Those interviews are also recorded so that further analysis can be conducted afterwards. (Carson et al. 2001).
Throughout the focus groups the questions could be changed, omitted or added depending on the unfolding of previous answers. Two different groups participated on the focus groups in an attempt to avoid data quality issues such as interviewee bias (Saunders et al., 2008). In total 8 people participated, 4 in each focus group held in 27 and 28 July respectively. Customers were selected through the company’s database, the invitation was sent to the mailing list and the compensation given was 20€ in a Science4you’s voucher.
This second stage of research took form in a self-administered questionnaire, this time in a structured way, sent to customers in the existing data base. The questions were the same to every respondent and they had a predetermined order.
In this case the questionnaire aimed at validating and quantifying the insights that the exploratory research suggested. The quantitative questionnaires had 108 participants, the majority of which taking it online, while 16 answers were collected personally at Science4you’s stores during two days, one day at each store (Colombo and Vasco da Gama shopping malls, in Lisbon).
Secondary Data
The first strategy regarding data analysis was to use information already available about the company’s clients, such as purchase patterns (in the online store) and start by analyzing those numbers, only then perform the collection of primary data to further complete the study. However, after analyzing the data available in the company, it was possible to infer that the data available had limited accuracy. For example, the company had information about online purchases but due to the online shop design, no identification was automatically collected, and every time a person visited the online store a new identity would be created and so it became impossible to track a single client’s purchasing patterns.
In the end, the only Secondary data of use was the one the company had access through the market research company GfK. The agency collects data on the Portuguese toy market and data from the period Jan 2014 - May 2016 was made available for this research.
SWOT
It was already mentioned that the attractiveness of a segment will also be influenced by how well that segment matches the company’s competences and to evaluate those competences a SWOT analysis was held (Piercy & Morgan, 1993).
There are several entities referring to Albert Humphrey as the person to come up with the first SWOT analysis. Back in the 1960s and 1970s he developed a project funded by Fortune 500 companies whose aim was to understand why corporate planning efforts were not successful. To address that question, Humphrey developed a “SOFT” analysis which eventually was developed into a “SWOT” analysis (Bertelsen, 2012).
In the case of Science4you the main conclusions were drawn after analyzing the secondary data provided by the company and will be discussed further on.
The need to test the hypothesis that will be proposed further on will raise the necessity to apply some statistic tools in order to provide validity to the conclusions. The quantitative research was carried in the following way: questionnaires were sent by Science4you in its newsletter. Approximately 30 responses were collected in the way. After, the questionnaire was carried in two stores: Colombo and Vasco da Gama for one day in each store, through this way 16 responses were collected. The remaining and majority of responses was collected through a Facebook post on Science4you’s page. In total, 108 responses were collected. From those, 89% were women and their age range was 20-62 years old.
To infer about the hypothesis that were proposed for the population proportions, the sample proportion will be used. A z-test is used when dealing with proportions whose variance are known. A z-test takes the following formula: z= !"#
#(%"#)/( , where: • 𝑝 stands for the estimated sample proportion;
This test will allow us to conclude about the null hypothesis (the initial hypothesis) by computing a
number to be compared with a critical value – that will vary – that will then grant the opportunity to
reject or not the null hypothesis.
The confidence level was set at 95%, meaning that for a two sided test, we reject the null hypothesis
when the z-value falls out of the interval from -1,96 to 1,96; on the other hand if the test is one sided
and we want to reject the hypothesis that the population proportion is smaller than a certain value, that
hypothesis will be rejected if the z-value is greater than 1.64; if the one sided test has a null hypothesis
that claims that the population proportion is higher than a given figure, then we will only reject the null
hypothesis if the z-value obtained is smaller than -1,64 (Newbold, Carlson & Thorne, 2007).
H0 will stand for the null hypothesis and H1 for the alternative hypothesis.
5. Results’ discussion
SWOT
The main conclusion drawn from the SWOT was that one of the company's main strengths - being a Portuguese company - is not “advertised” enough.
Strengths
100% Portuguese: since the 2008 crisis people tend to be more aware of Portuguese products, they want to buy national goods because that’s a way to help national economy (Observador, 2014).
Horizontal organization: the company is very “informal”, the structure is very horizontal and everyone can easily access each other. That makes everyone’s job easier and cooperation between teams is effortless.
New and innovative concept: the segment of educational toys is still relatively unexplored and Science4you was able to gain some recognition by focusing solely on educational toys.
Weaknesses
Flaws in the processes: as any new company, some processes are still being improved. Science4you is a company with high growth rates which makes it very difficult to efficiently implement procurement and production processes (for example).
Marketing Department: again, as a consequence of the youth of the company, the marketing department is still operating without clearly defined goals or statistical backup. Nowadays the communication sent to customers is still undifferentiated.
100% Portuguese is not advertised enough: loyal customers know that Science4you is 100% Portuguese but people who are not that familiar with the company don’t. The Portuguese origin could be an important factor to those who are familiar with the company to become loyal and the ones who don’t know it, to become clients.
Opportunities
Growth in the educational toy sector: when the national market was analyzed, the conclusion was drawn that educational segments are growing, at a slightly higher rate than toys in general, which means that Science4you can still increase its revenues.
Infant and preschool toys: a segment that registered an interesting growth rate in the first 5 month of 2016 (compared with the same period last year) was the infant and preschool toys, with an expansion of 47% (well above the growth for the toy industry in general, 21% growth). Although Science4you produces some toys for this age range, the main focus is on toys for older children. It would be interesting if the I&D team focused on this segment in order to meet growing demand.
shopping. This app is very focused on the American market and Science4you is not among the listed toy companies but when applied to the Portuguese market, it would be a good opportunity for Science4you.
Threats
Modest growth in most economies: it was already mentioned that in 2015 most countries registered a slowdown in their economy’s growth. Overall, the world is recovering very slowly from the 2008 crisis. This may pose a threat to toy companies in general since in times of crisis people tend to lower or cut expenses in non-essential products.
Focus Groups
Some insights were drawn for each of the main topics and were the base to the formulation of the quantitative questionnaire. The main topics addressed were: reasons to buy Science4you’s products; expectations vs reality relative to the product; loyalty card evaluation; birthday parties and holiday camps and value and loyalty. From these topics the main conclusions were the following:
● All the respondents said they prefer educational toys, but in some cases it was obvious
that they gave that answer because it’s the political correct answer; “I looked specifically for Science4you, something educational” “ I like my kids to try different things, not everything needs to be educational” (female, 39, architect)
● 4/8 knew they wanted Science4you and in general they consider Science4you as a
“monopoly” in the educational toy segment, “There is no competition for Science4you” (female, 37, architect)
● 6/8 valued the fact that the company is Portuguese “Everything that’s national is good
● People did not have well defined expectations; no one was disappointed with the
product; “The toy surprised me because it was not childish at all” (male, 44, military nurse)
● Only 2 people knew the loyalty card;
● Birthday parties are well known, the holiday camps are not so noted; 5 people have
already done a birthday party with Science4you and 4 were very satisfied; “The fact that (the party) was in a real university was very important, the entertainers were very nice” (female, 40, autarchy)
● 8/8 feel the price is right for the quality delivered by the products, “Good value for
money, there are several prices ranges so we can choose the one we prefer” (female, 44, IT consultant);
● 8/8 would choose Science4you again.
From these insights, the qualitative questionnaire was developed to confirm or refute the following hypothesis:
H1: Half the clients make their purchases at the supermarkets
H2: Being a Portuguese brand is important when buying
H3: The majority of customers is satisfied with the products they purchase;
H4: The loyalty card is not very known;
H5: Customers believe the price is right for the quality delivered;
H6: Most people would buy again a Science4you product again;
H7: Most customers recommend the brand
H2: To test whether the nationality of the brand is important, I will take a test considering the percentage of respondents who attributed 7/10 or higher when asked how important the fact the brand is Portuguese was.
H3: In order to test the satisfaction level I will consider a satisfied customer one that ranks his satisfaction with 7 or higher.
H4: A percentage lower than 30% was set as an indicator that the loyalty card is not very known.
H5: A customer believes that the price is right if he ranks the value for money with 7 or higher.
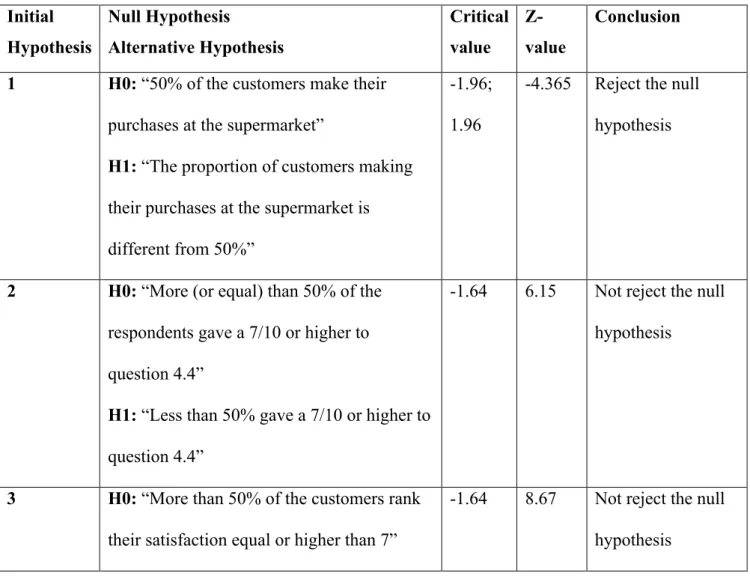
Table 1: Hypothesis testing resume
Initial Hypothesis Null Hypothesis Alternative Hypothesis Critical value Z-value Conclusion
1 H0: “50% of the customers make their
purchases at the supermarket”
H1: “The proportion of customers making
their purchases at the supermarket is different from 50%”
-1.96; 1.96
-4.365 Reject the null hypothesis
2 H0: “More (or equal) than 50% of the
respondents gave a 7/10 or higher to question 4.4”
H1: “Less than 50% gave a 7/10 or higher to
question 4.4”
-1.64 6.15 Not reject the null hypothesis
3 H0: “More than 50% of the customers rank
their satisfaction equal or higher than 7”
About the attitudinal behavior of Science4you’s customers the findings were the following: the preferred channel to buy is company-owned stores (62%), followed by supermarket (29%), online store (4%) and other (3%). Moreover, 15% of the interviewees spends less than 20€ annually on Science4you’s toys, 49% spends between 20 and 50€, 27% between 50 and 80€, 6% allocates between 80 and 120€ and finally 2% claims to consume more than 120€ annually. Also, every group stated that the most important feature of the toys was the fact that they are educational followed by the fact that it is a Portuguese company.
H1: “Less than 50% of the customers rank
their satisfaction equal or higher than 7”
4 H0: Less or 30% of customers does not
know the card
H1: More than 30% of customers know the
card
1.64 -3.45 Not reject the null hypothesis
5 H0: More than 50% gave more or equal than
7/10 when asked if the price was right H1: Less than 50%...
-1.64 3.26 Not reject the null hypothesis
6 H0: More than 50% responded 7/10 or
higher when asked how likely there were to buy again in the next 12 months
H1: Less than 50% ….
-1.64 6.36 Not reject the null hypothesis
7 H0: More than 50% said yes when asked if
they had ever recommended the brand H1: Less than 50% said….
Keeping in mind that the final goal is to increase profit, the first criteria chosen to segment clients was the amount they spend on Science4you’s toys annually, on average. Thus I will then describe each group according to its characteristics.
Firstly, we find the group that spends less than 20€ per year on the company’s toys. This group buys mostly in company owned stores but we will see that is not a differentiating characteristic since all groups mainly use this channel to make their purchases; this is the group who is most sensitive to price, and people within this group prefer to buy in company stores but will not hesitate to purchase at the supermarket if promotions are held there. In general, they first bought Science4you’s toys hoping to make the child gain interest in science. This group would value more interactive platforms together with the toy. Their average level of satisfaction with the toys is 8/10 and the probability that they would make a purchase in the next 12 months is 6,8/10, the lowest of all groups. In average, people in this group have 0,56 kids.
Afterwards we have the group that spends, on average, 20-50€ annually. The preferred channel to purchase are also the company owned stores but this group presents the higher percentage of people preferring to buy at the supermarket (33%), and it also has the higher number of people purchasing online when compared with the other groups. This segment is not sensitive to promotions – I will consider a group that a group is not price sensitive when their level of agreement with the sentence “I only buy Science4you’s products when their on sale” is lower than 3/10 – similarly to the previous group, the hoped the toy would increase the kid’s interest in science and would value more interactive touch points. Their level of satisfaction with the toys is 8,71/10 and the probability they will purchase the brand in the next 12 months is 8,72/10. In average, subjects with this group have 0,84 kids.
they were curious about the brand but had no defined expectations, they heard about the brand and wanted to try it. In line to the other segments, would value more interactive interfaces. This is the most satisfied group with 9 points on a 10-point scale and their likelihood to purchase Science4you in the next year is 9,1/10. On average they have 1,2 kids, this figure is superior to the previous groups and may be the reason why they spend more.
Proceeding to a more attractive group, clients who spend between 80-120€. Again, they preferred place to buy Science4you’s products are the company’s stores. This group present the greatest price rigidity, meaning they are the least sensitive to promotions. Contrary to all the other groups, what they would value the most is greater involvement on social causes. They are not the most satisfied group (satisfaction level of 8,29/10) but there are the most willing to buy to buy in the next year with a probability of 9,57/10 of buying Science4you’s toys. This is also the group with more children with an average of 1,85 kids. Again this may be correlated with the amount of money they allocate to these toys; they have more kids so they buy more toys in general.
There was also another group spending more than 120€ but only 3 people fit into this category and therefore any segment would prove irrelevant, more research would be needed to infer whether this really is a segment relevant enough to “make marketing action feasible” (Foedernayr & Diamantopoulos, 2008).
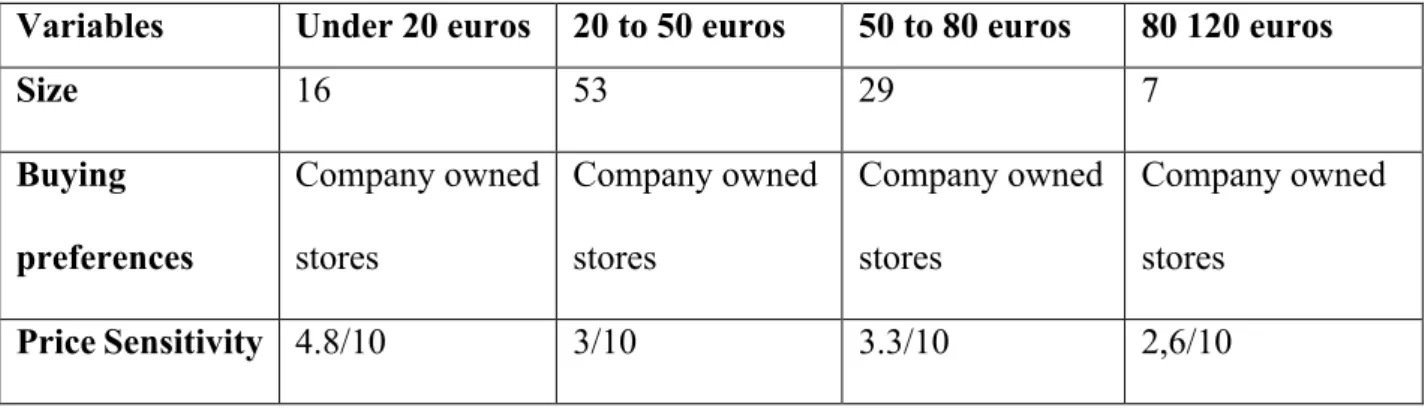
Table 2: Segments’ characteristics resume
Variables Under 20 euros 20 to 50 euros 50 to 80 euros 80 120 euros
Size 16 53 29 7
Buying preferences Company owned stores Company owned stores Company owned stores Company owned stores
Most valued change Interactive platforms Interactive platforms Interactive platforms
Involvement in social causes
Satisfaction 8/10 8.7/10 9/10 8.3/10
Likelihood to
buy
6.9/10 8.7/10 9.1/10 9.6/10
Average
number of kids
0.6 0.8 1.2 1.8
6. Conclusions and Recommendations
Conclusions
a) In general, clients are very satisfied with the toys
b) People are buying more on company-owned stores, contrary to what we believed
prior to the study
c) The educational and national features are very valued by customers.
d) The loyalty card is not very known
e) The segment that spends less than 20€ is the most price-sensitive, the least satisfied and the least probable to buy in the next 12 months.
f) The segment spending between 80 and 120€ is the least price sensitive and the most
likely to make a purchase in the next 12 months. Recommendations
c) partnerships/events with other Portuguese brands or even the launch of a toy that
is strictly related to the Portuguese culture. I believe this would make customers more engaged with the brand and thus more willing to spend more on its toys.
d) Use the clients’ suggestions - Clients were asked what would they value more on a
would provide discounts on special dates such as birthdays and Children’s day and 8/10 a card that would offer discounts on museums and scientific pavilions (a discount that is related to the use of the card and not included in all toys). Since customers seem to value these features, it would be very interesting to use them to increase awareness and subscription of the card. Another suggestion would be to create different card “levels”, according to the frequency of usage of the card, people who use the card more frequently and spend more have more advantages/discounts. This is likely to make “premium” customers use the card more often and therefore spend more on Science4you’s toys as well as stimulate the other customers to reach that “premium” level and thus spend more.
e) Not invest in the segment that spends less than 20€ - in order to make this
segment increase its spending, Science4you would have to, constantly, engage in significant promotions and that wouldn’t be viable in the long run.
f) Biggest invest on the segment that spends from 80 to 120 € - besides being the
biggest spenders, they are the least sensitive to promotions, and the most likely to make a purchase in the next year. Moreover, since this group would value involvement in social causes, Science4you would benefit from sponsoring charity/social events and inviting these customers to these events. Again, by feeling that the brand meets their values they should become more loyal and increase spending in Science4you’s toys. Keep in mind that this group would also be benefiting the most from the “levels” scheme of the loyalty card.
g) Keep the loyalty card strategy for the groups 20 to 50 and 50 to 80 - these
groups would be attracted to spend more by the new arrangement in the card.
h) Increase and improve its interactive touch points -if the possibility is real in
terms of investment, the company could address these touch points to in order to better
7. Limitations e future research
As in any study, some limitations were found. In the initial stage, when information was being collected, it became clear that the company did not have much information relating its customers, which implied an investigation almost from scratch, with no insights on the customers.
Plus, segmenting a set of clients rather than a market limits heavily the ability to collect answers. Not everyone is fit to respond to the questions (only customers), and this is a company that still very “far” from its customers when it comes to contacting them or knowing them. Also, the way the study was conducted influenced the results. For example, the respondents were, mainly, people in the mailing lists or that liked Science4you’s Facebook page. These people are, obviously, very likely to be satisfied with the company because they either provided their information or liked the page. And so, not a lot of people that are unsatisfied with the company were considered in this study.
Bibliography
Bailey, C. R., Baines, P. R., Wilson, H., and Clark, M. (2009). Segmentation and customer insight in contemporary services marketing practice: why grouping customers is no longer enough. Journal of Marketing Management, 25(3), 227–252.
https://doi.org/10.1362/026725709X429737
Bayer, J. (2010). Customer segmentation in the telecommunications industry. Journal of Database Marketing & Customer Strategy Management, 17(3), 247–256.
https://doi.org/10.1057/dbm.2010.21
Bertelsen, B. (2012). Everything You Need to Know About SWOT Analysis. [Newmarket, Ont.]: BrainMass Inc.
Canhoto, A. I., Clark, M., & Fennemore, P. (2013). Emerging segmentation practices in the age of the social customer. Journal of Strategic Marketing, 21(5), 413–428.
https://doi.org/10.1080/0965254X.2013.801609
Carson, D., Gilmore, A., Perry, C. and Grønhaug, K. (2001) Qualitative Marketing Research. London: Sage.
Cuadros, A. J., and Domínguez, V. E. (2014). Customer segmentation model based on value generation for marketing strategies formulation. Estudios Gerenciales, 30(130), 25–30. https://doi.org/10.1016/j.estger.2014.02.005
Dibb, S. (1998). Market segmentation: Strategies for success. Marketing Intelligence & Planning, 16(7), 394–406.
Dibb, S., and Simkin, L. (2001). Market segmentation: Diagnosing and treating the barriers. Industrial Marketing Management, 30, 609–625.
Dibb, S., and Simkin, L. (2010). Judging the quality of customer segments: segmentation effectiveness. Journal of Strategic Marketing, 18(2), 113–131.
https://doi.org/10.1080/09652540903537048
Foedermayr, E. K., and Diamantopoulos, A. (2008). Market segmentation in practice: Review of empirical studies, methodological assessment, and agenda for future research. Journal of Strategic Marketing, 16, 223–265
Jarratt, D., and Fayed, R. (2012). Services Segmentation and Emergent Customer Behavior: A Case Study. Services Marketing Quarterly, 33(1), 49–67.
https://doi.org/10.1080/15332969.2012.633438
Piercy, N. F., and Morgan, N. A. (1993). Strategic and operational market segmentation: A managerial analysis. Journal of Strategic Marketing, 1, 123–140
Frank, R.E., Massy, W.F., and Wind, Y. (1972). Market segmentation. Englewood Cliffs, NJ: Prentice-Hall.
Robson, C. (2002) Real World Research (2nd edn). Oxford: Blackwell.
Rudelius, W., Walton, J.R., and Cross, J.C. (1985). Improving the managerial relevance of market segmentation studies. In M.J. Houston (Ed.), Review of Marketing (385–404). Chicago, IL: American Marketing Association.
Saunders, M., Lewis, P., and Thornhill, A. (2008). Research Methods for Business Students. Research methods for business students. https://doi.org/10.1007/s13398-014-0173-7.2 Smith, W. (1956). Product differentiation and market segmentation as alternative marketing
strategies. Journal of Marketing, 21, 3–8.
Storbacka, K. (1997). Segmentation Based o n Relationship Marketing Retrospective Analysis, Retail Bank Customer Bases, 479–492.
The Family Room Strategic Consulting Group, LLC (2013), “Toy & Game Family Decison Making Study”
Toys & Games Industry Profile: Europe. (2015). Toys & Games Industry Profile: Europe, 1 Wedel, M., & Kamakura, W.A. (2000) Market segmentation: Conceptual and methodological
Appendices
All the graphics in the appendix were made based on the data collected by GFK for Science4you, during the period Jan 2014-May 2016.