THIS REPORT WAS PREPARED BY RICARDO JORGE LUÍS GOMES, A MASTERS IN FINANCE STUDENT OF THE NOVA SCHOOL OF
BUSINESS AND ECONOMICS, EXCLUSIVELY FOR ACADEMIC PURPOSES.THIS REPORT WAS SUPERVISED BY ROSÁRIO ANDRÉ WHO
M
ASTERS IN
F
INANCE
E
QUITY
R
ESEARCH
We recommend buying Oi S.A.’s ordinary shares, provided our price target of R$ 19.51 as of December 31, 2015, which underlines an upside potential of 174.78% and represents a 5.78 EV-to-EBITDA multiple. However, one should bear in mind the risk implied by the small expected participation of equity in the company’s enterprise value in 2015 (21.88%).
Selling PT Portugal –which will be decided by PT SGPS’s shareholders on January 12, 2015 – and consolidating in Brazil by acquiring a stake in TIM adds value to the company, as it would allow for a reduction of indebtedness while enjoying from operational synergies. Actually, the target price for this scenario is R$ 19.78, R$ 0.89 above the target price implied by the current scenario, on a standalone basis.
We believe Oi S.A. will be able to leverage its wireline footprint in Brazil in the coming years and capture market share in the pay TV segment. However, the debt burden and the possible focus on de-leveraging might impair its ability to explore growth opportunities, particularly in a market within a wave of consolidation.
The approval from CVM to proceed with the exchange of the investments in Rioforte by shares held by PT SGPS representing 16.58% of Oi S.A.’s share capital is still awaiting approval, impairing the listing of CorpCo in the Novo Mercado segment of BM&FBOVESPA.
O
I
S.A.
C
OMPANY
R
EPORT
T
ELECOMMUNICATION SERVICES JANUARY 7,2015S
TUDENT:
R
ICARDOJ
ORGEL
UÍSG
OMES[email protected]
Recommendation: BUY
Price Target FY15: R$ 19.51
Price (as of Jan. 6, 15) R$ 7.10
Reuters: OIBR3.SA, Bloomberg: OIBR3:BZ
52-week range (R$) 7.10-48.80
Market Cap (R$ mn) 5,984
Outstanding Shares 842,766,135
52-week average daily volume 469,973
Sources: Analyst estimates; Bloomberg
Source: Bloomberg
Future is all about uncertainty
Good business prospects, massive leverage
2013(1) 2014E 2015F
Financials
Revenues (R$ mn) 36,873 36,937 37,083
EBITDA (R$ mn) 13,049 10,066 10,272
Net Income (R$ mn) 1,150 -1,066 -655
EPS (R$) 1.36 -1.27 -0.78
Ratios
ROE (%) 6.63% -6.06% -4.29%
Net Debt/EBITDA (x) 4.08 5.35 5.41
EV/Revenues (x) 2.45 1.95 2.01
EV/EBITDA (x) 6.91 7.14 7.25
(1) Consolidated Pro-forma
OI S.A. COMPANY REPORT
Table of Contents
EXECUTIVE SUMMARY ...3
VALUATION ...4
COMPANY OVERVIEW ...6
BRAZIL ... 8
PORTUGAL ... 9
EQUITY SECURITIES AND SHAREHOLDER STRUCTURE ... 10
THE NEVER-ENDING BUSINESS COMBINATION ...11
BACKGROUND AND RATIONALE ... 11
PATHWAY TO CORPCO ... 12
GONE WITH RIOFORTE ... 13
BRAZILIAN OPERATIONS ...15
COMPETITION... 16
FINANCIAL PROJECTIONS ... 18
PORTUGUESE OPERATIONS ...25
COMPETITION... 26
FINANCIAL PROJECTIONS ... 27
SCENARIO ANALYSIS ...32
SENSITIVITY ANALYSIS AND MULTIPLES VALUATION ...34
APPENDIX ...36
OI S.A. COMPANY REPORT
Executive summary
Oi S.A. is one of the main integrated telecom service providers in Brazil (which are conveyed under the trademark Oi) and Portugal (through PT Portugal and its brands, MEO and PT Empresas), having in its portfolio more than 100 million customers in seven different countries and forecasted to generate an EBITDA amounting to R$ 10,066 in 2014. It is the leading provider of fixed line telephony services in both countries – responsible for 36.50% and 54.80% of the total number of accesses in Brazil and Portugal, respectively – as well as the market leader in what concerns bundled offers in Portugal, with a market share of 44.30%.
The relationship between both sides of the Atlantic dates back to July 2010, despite the on-going merger was only announced in October 2013. However, ever since Rioforte defaulted and Oi S.A. did not recover the short-term investments that had been made by PT SGPS, the whole process came to a halt, with the terms that had been signed being revised, including a downsize of the share of CorpCo to which PT SGPS’s shareholders will be entitled to (from 32.22% to 15.65%).
As for the Brazilian and Portuguese telecom markets, both are at different stages of maturity. Whereas in Brazil penetration rates are quite below those experienced in developed markets – except for mobile devices – and its population and demand for such services are still increasing, in Portugal, on average, penetration rates are in line with the ones recorded in Europe and the market has reached a stabilization of demand. Such framework led PT Portugal to be amongst the worldwide pioneers providing convergent offers – allowing for lower churn rates and higher ARPUs – which have been replicated across the world, including in Brazil.
OI S.A. COMPANY REPORT
Valuation
The methodology used throughout this note relies on the sum of parts (SoP) technic, combined with Discounted Cash Flow (DCF) models and market multiples, according to the relevance of each operating segment.
The Brazilian and Portuguese telecommunications segments were valued through DCF models, whereas the interests held in Africa and East Timor were valued through market-based Enterprise Value-to-EBITDA (EV-to-EBITDA) multiples1, because either their relevance is not material or there is lack of information available which would make a DCF valuation too much dependent on analysts’ assumptions.
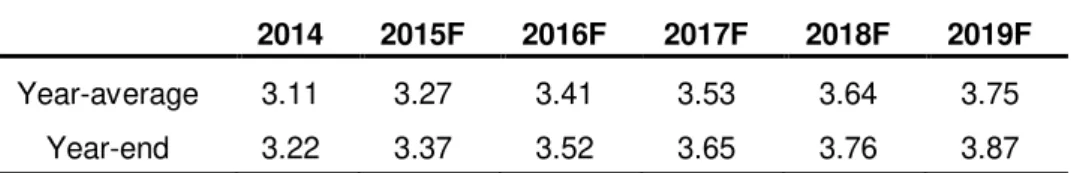
Regarding the DCF-based valuations, both segments were analyzed centered on an explicit forecast period of 5 years (2015 through 2019) and a perpetuity thereafter, with annual nominal growth rates equal to 4.70%2 for Brazil and 0.50%3 for Portugal. Moreover, all estimates were made in local currencies (Brazilian Real and Euros) and then consolidated into the Brazilian currency, using the following projected exchange rates4:
2014 2015F 2016F 2017F 2018F 2019F
Year-average 3.11 3.27 3.41 3.53 3.64 3.75
Year-end 3.22 3.37 3.52 3.65 3.76 3.87
In order to discount the projected cash-flows, it was decided to use the WACC5, which is summarized in Table 2.
1 A 6.70x EV-to-EBITDA was used. This figure was computed as the average EV-to-EBITDA multiple for the following list
of comparable companies: MTN Group, Vodacom Group, Maroc Telecom, Safaricom, and Telecom Egypt.
2 We believe the combination of a low installed base of pay TV and fixed broadband services, the still-increasing Brazilian
population, and the recent roll-out of multiple play offers create considerable room for growth within the country’s telecom
industry. Moreover, comparable businesses (refer to Footnote 7) traded at 5.48x EV-to-EBITDA as of December 31, 2014. Thus, we predict that the operations held by Oi S.A. in Brazil will grow at 4.70% per year from 2020 onwards, corresponding to a real growth rate of 0.20% (the Brazilian Central Bank aims at achieving a 4.50% long-term inflation rate) and to an implicit 5.47 EV-to-EBITDA multiple as of December 31, 2019.
3 According to PMR, a European market research company, the telecom market in Central and Western Europe entered in
a mature phase during the past years, experiencing a halt in the upward trend regarding the number of customers that had been recorded before. Moreover, McKinsey found that growth in mature markets has been fundamentally driven by further penetration of wireless-based services, whereas we predict a decline in the number of mobile services subscribers of PT Portugal (refer to section Portuguese operations – Financial projections). Plus, comparable businesses (refer to Footnote 7) traded at 6.92x EV-to-EBITDA as of December 31, 2014. Hence, we are assuming that the Portuguese-based operations will grow at 0.50%/year in perpetuity (implicit EV-to-EBITDA of 6.95 as of December 31, 2019), while the IMF projects the Portuguese inflation to be 1.52% by 2019.
4 Figures were projected by using current spot rates and forecasted inflation rates. Sources: Bloomberg and IMF.
5 It was decided to use a different cost of capital for each segment, because the cash-flows arising from each one are
denominated in different currencies and pose different opportunity costs. Sources: IMF, Bloomberg, Analyst estimates
OI S.A. COMPANY REPORT
As for the risk-free (rf), the U.S. Generic Government 10 year yield was used as a proxy for Brazil and Portugal, adjusted for the respective local currencies6. On the other hand, the market risk premium (MRP) was computed as the average excess return earned on the S&P500 over the U.S.-10 year Treasury bond from January 1962 through December 2014 (5.41%) and then converted into each segment’s local currency.
As for the leverage of both segments, the company provides no guidance regarding target leverage levels neither per segment nor on a consolidated basis. However, we believe that Oi S.A. will not be able to substantially reduce its indebtedness in the near future, which makes us believe that Net Debt-to-EBITDA and Net Debt-to-EV (ND-to-EV) will remain rather stable both on a consolidated and segment basis (refer to Figure 1).
Regarding the unlevered or sector betas (βU), they were obtained by averaging the unlevered betas of a set of comparable firms7. Then, the levered betas (β
L) were computed by relevering the previous ones with each segment’s target leverage. Moreover, the cost of equity (re) was computed through the CAPM, by adding the product of the market risk premium with the levered beta on top of the risk-free rate.
For the cost of debt (rd), it was used as a proxy a U.S.-dollar-denominated long-term corporate bond issued by Oi S.A.8, maturing on February 2, 2022, in order to assess the expected return should default not happen (the yield to maturity (YTM) as of December 31, 2014 – 7.09% –was then converted into each segment’s local currency). Moreover, to address the return upon default, it was used a probability of default (p) of 3.01%9 and a recovery rate (RR) of 62.20%10, each one corresponding to a seven-year time horizon, taking the corporate bond under analysis into consideration. All in all, the expected cost of debt was computed as
6 The German Generic Government 10 year yield was not used in order to sidestep current market distortions that have
driven German Bunds to very low yields (0.54% as of December 31, 2014).
7 The levered betas of each comparable firm were computed by regressing its excess returns with the excess returns of the
MSCI World Index over the last three years. Then, each beta was unlevered using each company’s ratio of net debt to
market capitalization. The comparables used for the Portuguese operations were: NOS SGPS, Koninklijke KPN NV, British Telecom Group, Belgacom S.A., Telekom Austria A.V., Swisscom A.G., and Telecom Italia, whereas for the Brazilian segment the selected comparables were: TIM Participações S.A., NET Serviços de Comunicação S.A., América Móvil S.A.B., and ENTEL Chile S.A. Source: Bloomberg.
8 The corporate bond used is denominated in U.S. dollars rather than in Brazilian Real or Euros because it is the one trading
with the longest horizon to maturity.
9 Despite this bond is currently rated as BB+ by S&P, it is trading at a yield similar to those of bonds issued by
telecommunications companies rated as BBB (using a composite of bonds issued by US telecom companies as a proxy). As such, the probability of default used is the one predicted by S&P for a BBB-rated corporate bond. Sources: Bloomberg and S&P.
10Average recovery rate for senior unsecured bonds. Source: Moody’s, 2010.
0 2 4 6
0% 20% 40% 60% 80%
Net Debt/EBITDA (x) Net Debt/Enterprise Value (%) Figure 1 – Oi S.A. Net Debt-to-EBITDA (LHS) and Net Debt-to-EV (RHS)
Sources: Company fillings; Analyst estimates
Table 2 – Summary of WACC
Sources: Bloomberg; Analyst estimates
Brazil Portugal
rf 4.84% 2.34%
MRP 8.00% 5.41%
ND-to-EV 77.29% 65.39%
βU 0.52 0.52
βL 2.28 1.51
re 23.06% 10.53%
p 3.01% 3.01%
RR 62.20% 62.20%
YTM 9.71% 7.09%
rd 8.28% 5.74% Tax rate 34.00% 25.50%
OI S.A. COMPANY REPORT
the expected return on this specific bond, taking inflation into consideration by adjusting its yield to maturity accordingly.
Eventually, each segment’s WACC was computed using the abovementioned parameters and the respective statutory tax rates, leading to an appropriate discount rate of 9.46% for Brazil-based operations and 6.44% for the Portuguese segment.
Moreover, on top of the baseline scenario that considers that Oi S.A. will continue to hold its current Brazilian operations as well as the operations of PT Portugal, we will be analyzing an alternative scenario under which PT Portugal is divested and a 33%-stake in TIM is acquired (refer to section Scenario analysis).
Bottom line, the DCF valuation suggests a R$ 19.51 weighted target price11 per each ordinary share of Oi S.A.12, which underlines a 174.78% upside potential vis-à-vis the R$ 7.10 at which Oi S.A.’s common shares were trading on January 6, 2015 (refer to Appendix 1).
Company overview
Oi S.A. is one of the main integrated telecommunications service providers both in Brazil (under the brand Oi) and in Portugal (under the trademarks of PT Portugal, such as MEO and PT Empresas), having in its portfolio more than 100 million customers in seven different countries (approximately 79 million just in Brazil and Portugal, according to company fillings as of 3Q2014).
In Brazil it holds 75.04 million RGUs13 and is the leading provider of fixed line telecommunication services with a market share of 36.50%, whereas in Portugal it maintains 13.13 million RGUs and is the front-runner regarding fixed line
11 The consensus target price presented by Bloomberg on December 31, 2014 was R$ 16.62.
12 Mid-year adjustments were applied when discounting cash-flows at the WACC in order to account for the fact that (i) such
cash-flows are distributed along the years and not received as a one-off entry by the end of each year and (ii) seasonality is not a material issue for both segments (for valuation purposes).
13 Revenue Generating Units.
Figure 5 – Oi S.A. RGUs breakdown as of 3Q2014 (Brazil on the LHS, Portugal on the RHS)
Source: Company fillings
Figure 4 – Revenue breakdown (R$ mn, 3Q2014)
Source: Company fillings
Figure 2 – EV breakdown per segment (baseline scenario)
Source: Analyst estimates
56.90% 41.30%
1.35% 0.45%
Brazilian Telecom Portuguese Telecom Unitel (Angola) Others
Figure 3 – EV breakdown per horizon (baseline scenario)
Source: Analyst estimates
15.81% 21.18% 84.19% 78.82%
Brazilian Telecom Portuguese Telecom Perpetuity
OI S.A. COMPANY REPORT
telecommunication services and bundled offers services14 with market shares of 54.80% and 44.30%, respectively15. Apart from fixed telephony, the group offers other services, namely: mobile telecommunication, fixed and mobile broadband internet, pay TV, and others (such as public pay telephones), both in Brazil and Portugal, not only to residential customers but also to corporate clients and governmental agencies. Furthermore, Oi S.A. has interests (through PT Portugal) in (i) Africa through its 75% participation in Africatel, entitling it to have a stake in Unitel (Angola, 18.75%), MTC (Namibia, 25.50%), CVT (Cape Verde, 30.00%), and CST (São Tomé and Príncipe, 38.25%) and (ii) in Asia through Timor Telecom (East Timor, 44.00%).
The relationship between the Brazilian and the Portuguese arms of Oi S.A. started on July 28, 2010, when Portugal Telecom (PT) entered into agreements with some of the main shareholders of the Oi Group (Oi S.A. did not exist yet), entitling the Portuguese company to hold a 22.38% economic interest in the group on a consolidated basis16. Eventually, the Oi Group followed suit and acquired 10% of the outstanding ordinary shares of PT under the reasoning that holding such stake was necessary to align interests amongst both parties. According to PT17, this strategic partnership with Oi was led by an ambition to develop a global telecommunications platform that would allow for sharing best practices, taking advantage of economies of scale, conducting R&D initiatives, and expanding internationally, particularly in Latin America and Africa.
Later, on October 1, 2013 a Memorandum of Understanding (MoU) was entered into with the purpose of performing the business combination between PT SGPS, Oi S.A., and the Oi Holding Companies into Telemar Participações S.A (TmarPart, the controlling shareholder of Oi)18, leading to the contribution in kind by PT SGPS of PT Portugal’s assets upon the capital increase performed by Oi S.A. on May 5, 2014 (refer to section The never-ending business combination for more details on
the business combination). However, a series of events took place afterwards and Oi S.A. is currently negotiating the divestiture of PT Portugal and aims at being a player in the consolidation of the Brazilian telecom market.
14 Providing various services to customers as a sole-package despite they are also offered on a standalone basis. 15 Data regarding RGUs is as reported in the company fillings while market shares for Brazil and Portugal is as reported in
each country’s regulator, ANATEL and ANACOM, respectively. Plus, both RGUs and market shares are expressed as of
3Q2014.
16 The stake eventually increased to 23.20% upon the corporate restructuring the Brazilian group went through.
17Source: Company’s fillings.
18 Also known as CorpCo ever since the MoU was entered into.
Figure 6 – EBITDA
breakdown (R$ mn, 3Q2014)
OI S.A. COMPANY REPORT
Figure 7 – Brazilian Service Areas
Source: Company website
Brazil
The group’s Brazilian-arm is the successor of Brasil Telecom Participações and TNL, two companies that were created in 1998, when Telebrás, the Brazilian state-owned telecommunications monopoly, went through a spin-off and subsequent privatization in an effort of the Brazilian authorities to promote competition19. Later on, in 2009 the group concluded the operational integration between Oi Mobile and Brasil Telecom and started operating nationwide in a convergent way, under the brand Oi, setting the stage for the corporate restructuring that merged three public-listed entities (Brasil Telecom Participações, TMAR, and TNL) into the standalone Oi S.A. on April 9, 2012.
It owns the largest telecommunications backbone in Brazil with about 330 thousand kilometers of installed fiber optic cable, while its mobile network covered 88.50% of the Brazilian population in October 2014, according to ANATEL. Moreover, the group holds concessions and authorizations from the Brazilian government that allow it to provide fixed line and mobile telecommunications services as well as data transmission and direct-to-home (DTH) satellite television services throughout the three service areas, covering the whole country20.
Oi S.A. provides these services under the following customer categories: (i)
Residential services, covering fixed line services (primarily in Regions I and II) such
as voice, broadband, and pay TV services provided to all consumer customers as well as fixed line interconnection services21, (ii) Personal mobility services, focused on mobile telecommunications services (both voice- and data-related) and mobile interconnection services, (iii) Enterprise services, targeting corporate fixed line and
mobile solutions offered to small, medium-sized, and large corporate customers, and (iv) Other services, encompassing public pay telephones.
Following the market trends and in an attempt to retain the shift from fixed to mobile voice services, the company started offering double-play services in 2009 (combining wireline and wireless telephony) and now provides bundles that range from double-play to quadruple-play (combining fixed telephony, fixed broadband, postpaid mobile, and pay TV). Actually, according to data released by the company, 61% of the households that are Oi’s customers contracted bundled offers by the end of 3Q2014.
19 As such, Oi S.A. is the incumbent fixed telecom operator in Regions I and II. Source: Company’s fillings. 20 However, the company does not provide fixed line telephony in Region III.
21 Interconnection services correspond to the usage of a company’s network to complete calls initiated by customers of
OI S.A. COMPANY REPORT
Portugal
Oi S.A.’s Portuguese operations date back to 1994, when the Portuguese government decided to merge three state-owned telecom companies into PT22. Twelve years later, in February 2006, Sonae SGPS23 launched a tender offer to acquire PT’s outstanding shares which received clearance from the Portuguese competition watchdog. However, the board of directors of PT issued a press release recommending the company’s shareholders not to accept the offer, while committing to spin-off PT Multimédia24, the company’s subsidiary that held the operations related to broadband and pay TV services (among others), in order to reward them. Moreover, prior to the strategic alliance with the Oi Group, PT had already held interests in Brazil, through a 50% stake in Brasilcel N.V., a joint venture with Telefónica S.A., which provided telecommunications services in the country through Vivo Participações S.A. being eventually acquired by the Spanish partner on July 28, 2010 for a total consideration of € 7.50 billion. Additionally, PT Portugal has also accumulated interests in Africa and Asia as mentioned above. PT Portugal holds an optic fiber network (FTTH – Fiber-to-the-Home) of circa 900 thousand kilometers, which translates into about 1.7 million homes passed, and a 4G-LTE coverage that spreads across approximately 93% of the Portuguese population, according to Oi S.A.’s 3Q2014 presentation to investors.
The company – granted by the Portuguese government and ANACOM with concessions that allow it to provide wireline and wireless telecommunications services (voice and data services) and to deliver public available telephony and telephone directories (universal service provider) – conveys its services in Portugal in customer categories25 identical to those used in Brazil, namely: (i) Residential
services, which include all consumer customers that subscribe to wireline products
and services at home on an individual basis (such as fixed line telephony and pay TV) and fixed line interconnection services, (ii) Personal mobility services,
including all consumer customers that subscribe to wireless products and services on an individual basis (i.e. voice, data and Internet-related multimedia services) and mobile interconnection services, (iii) Enterprise services, which include all
SoHo26, SME27 and corporate customers that subscribe wireline and wireless
22 Throughout the years the governmental footprint in PT decreased substantially, ceasing to exist in 2011, when Portugal
dropped its golden shares in the company.
23 Owner of, among others, Optimus Telecomunicações, the third main mobile operator in Portugal by then, according to
ANACOM.
24 Which was rebranded into Zon Multimédia in 2008 and merged with Optimus Comunicações into NOS Comunicações in
2014.
25 Source: Company fillings. 26 Small Office/Home Office.
OI S.A. COMPANY REPORT
products and services, and (iv) Wholesale and other services, encompassing all
the wireline and wireless wholesale services for the other businesses (e.g. public pay telephones and the production and distribution of telephone directories) and all intercompany eliminations that are related to the Portuguese telecommunications businesses.
Equity securities and shareholder structure
The group’s common and preferred shares28 are listed both on the São Paulo Stock Exchange (BM&FBOVESPA, its main trading market since July 1992) and the New York Stock Exchange (NYSE, where its ADSs are traded since November 2001)29. On October 18, 2014, the company’s shareholders approved a reverse split of both shares, in both stock exchanges, in the ratio of 10:1, such that the current30 total number of common and preferred shares outstanding (ex-treasury shares) is 277,730,251 and 565,035,884, respectively, totaling 842,766,135 shares31.
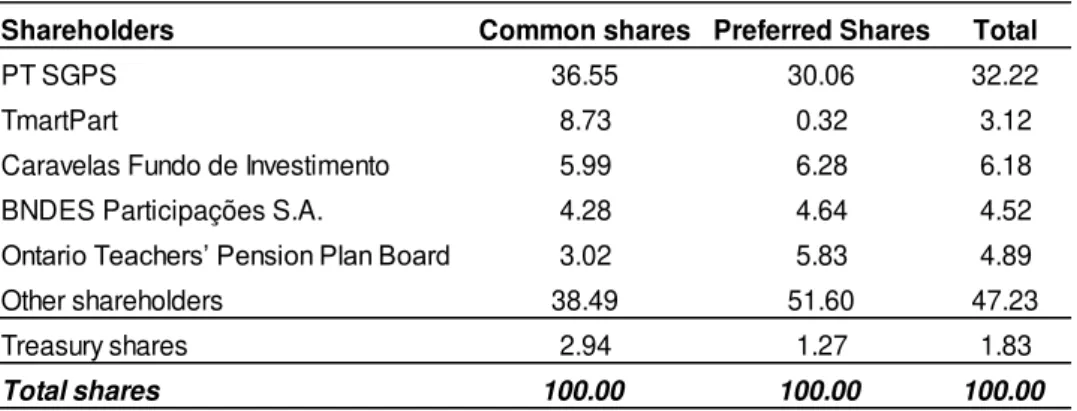
Regarding the shareholder structure composition32, there are five main entities that hold the company’s stock, namely: (i) Portugal Telecom SGPS (PT SGPS), (ii) Telemar Participações S.A. (TmarPart), (iii) Caravelas Fundo de Investimento, (iv) BNDES Participações S.A, and (v) Ontario Teachers’ Pension Plan Board. These data is summarized in the following table:
28 The group’s preferred shares “have no right to vote, being assured priority in the payment of the minimum and non
-cumulative dividend of 6% per year of the value of the division of the capital stock by the total number of shares of the company or 3% per year of the book value of shareholders’ equity divided by the total number of shares of the company,
whichever is higher”. Source: Company fillings.
29 Oi S.A. has registered common and preferred ADSs representing, respectively, 1.60% and 13.50% of the common and
preferred shares trading on BM&FBOVESPA. Plus, each common and preferred ADS represent one common and preferred share, respectively.
30 The stock reverse split took place on December 22, 2014.
31 Oi holds 8,425,069 common shares and 7,280,808 preferred shares as treasury stock. 32 Taking into consideration only the shares trading on BM&FBOVESPA.
Table 3 – Oi S.A. shareholder structure as of December 31, 2014 (% of total shares)
Sources: Company fillings; Bloomberg
Shareholders Common shares Preferred Shares Total
PT SGPS 36.55 30.06 32.22
TmartPart 8.73 0.32 3.12
Caravelas Fundo de Investimento 5.99 6.28 6.18
BNDES Participações S.A. 4.28 4.64 4.52
Ontario Teachers’ Pension Plan Board 3.02 5.83 4.89
Other shareholders 38.49 51.60 47.23
Treasury shares 2.94 1.27 1.83
OI S.A. COMPANY REPORT
Figure 8 – Synergies NPV split (R$ bn)
Source: Company fillings
However, it is worth noting that the position held by PT SGPS might decrease in the near future, according to the amendments approved by PT SGPS shareholders to the revised MoU upon the default of Rioforte towards the investments PT SGPS held in this company. Should the Brazilian Securities Commission (CVM) accept it, PT SGPS will hold only 19.97%, 13.48%, and 15.65% of Oi S.A.’s common, preferred, and total shares, respectively, plus a call option granted by Oi subsidiaries to reacquire these shares (refer to section The never-ending business combination for more details).
The never-ending business combination
Background and rationale
On October 1, 2013 a MoU was entered into with the purpose of performing the business combination between PT SGPS and Oi S.A. into TmarPart (or CorpCo), following the strategic alliance initiated on July 28, 2010. According to the parties involved, the rationale for this merger was (i) to create a single multinational telecommunications company with more than 100 million customers in seven different countries, (ii) further extend the consolidation of the Brazilian and Portuguese operations, (iii) consolidate the shareholder bases of PT SGPS, Oi S.A., and TmarPart, entitling shareholders to a single class of common shares or ADSs (rather than having two different classes), and (iv) forcing CorpCo to adopt corporate governance practices that would allow it to be listed on the Novo Mercado33 segment of the BM&FBOVESPA.
Furthermore, as in every M&A operation, potential synergies are one of the main sweeteners of any deal and this one was no exception. Upon the announcement of the merger to the market on October 2013, the company announced synergies amounting to R$ 5.50 billion on an NPV-basis, as of December 31, 2013, which could be broke down into R$ 3.30 billion coming from operational synergies and the remainder from financial synergies (the former representing an improvement of about 0.80% and the latter of circa 1.10% vis-à-vis the total OPEX and CAPEX, respectively, on a standalone basis). However, despite such improvements might not seem farfetched when compared to similar transactions (whose operational improvements average 3% to 5%34), one must bear in mind that this is a transatlantic merger which underlines a much lower potential to achieve synergies when compared to domestic telecom mergers. According to McKinsey35, in-market
33 A top-tier segment of the BM&FBOVESPA launched in 2000 whose listed companies are obliged to meet stricter
governance rules, providing a higher level of confidence to potential investors.
34 Source: Company fillings.
OI S.A. COMPANY REPORT
M&A operations in the telecom industry can benefit from greater market scale (and consequent improved ability to implement bundling and cross-selling strategies), lower competitive intensity, lower costs regarding backbone servicing, marketing, and sales network, as well as lower CAPEX needs (e.g. by sharing investments in backbone network and mobile towers) whereas cross-border mergers can only do so to a lesser extent. As far as we can envisage, the synergies coming from this business combination are chiefly related to (i) lower procurement OPEX and CAPEX (e.g. by purchasing devices and content to be provided to customers and CAPEX-related materials, such as infrastructures, in a centralized manner) and (ii) organizational restructuring and sharing of operational and managerial best practices (especially by importing talent and know-how from Portugal and leverage the Brazilian operations36). Thus, we would disregard virtually the entire R$ 2.20 billion announced as financial synergies, since we believe most of the synergies come from operational factors.
Pathway to CorpCo
The merger was laid out to involve three main steps, namely:
1. A share capital increase of Oi S.A., which was completed on May 5, 2014, through a rights issue of 2,262,544,570 common shares (at R$ 2.17/share) and 4,525,089,141 preferred shares (at R$2.00/share) amounting to R$ 8,250 million in cash plus the subscription of 1,045,803,934 common shares and 1,720,252,731 preferred shares (representing 39.70% and 39.00% of Oi S.A.’s share capital and voting share capital, respectively) by PT SGPS through a contribution in kind of all the shares of PT Portugal – the subsidiary of PT SGPS that held all the operating assets of its parent company (except the interests held by PT SGPS in Oi S.A., Contax Participações S.A., and Bratel BV) as well as its respective liabilities – net valued at R$ 5,710 million or € 1,750 million37.
2. A merger of shares under which all Oi S.A. shares (other than those held by CorpCo) would be replaced by CorpCo common shares38, leading to Oi S.A. to be a fully-owned subsidiary of CorpCo and to cease to have two classes of shares trading in the market. Concurrently, CorpCo would go through a corporate reorganization aimed at simplifying its control structure (refer to Figure 9) and listing its shares on the Novo Mercado
36 According to the company, 2013’s operating FCF was positively impacted by circa R$ 166 million due to the
implementation of revenue assurance processes and control mechanisms for invoice adjustments similar to those used in Portugal.
37 This valuation was performed by Banco Santander (Brasil) S.A. as agreed by all parties.
38 Conversion ratios would be as follows: 1 share in CorpCo for each Oi S.A. common share and 0.9211 shares in CorpCo
OI S.A. COMPANY REPORT
segment of BM&FBOVESPA, on the NYSE Euronext Lisbon, and on the NYSE39.
3. A merger of PT SGPS with and into CorpCo, with CorpCo being the surviving entity40. As a result, PT SGPS would cease to exist and its shareholders would receive the shares of CorpCo that were held by PT SGPS prior to the merger.
Gone with Rioforte
The whole process of creating a transatlantic telecommunications giant run smoothly up until mid-July 2014, when Rioforte, a wholly-owned subsidiary of Espírito Santo International, S.A., failed to meet its obligations twice, as further detailed below.
From February 2014 to April 2014, two fully-owned subsidiaries of PT SGPS subscribed for various short-term securities issued by Rioforte amounting to €897 million (accounting for approximately 90% of the company’s short-term investments during the period41), which matured on July 15 and 17, 2014 – after these assets had been transferred to Oi S.A. upon the capital increase – with Rioforte defaulting on the payments of such liabilities. As a result, the business combination came to a halt (with only one step of the process fully completed) due to the considerable impact on the valuation that had been assigned to PT Portugal
39 CorpCo shares would trade on the NYSE through ADSs as Oi S.A. shares already do
.
40 For each PT SGPS share, PT SGPS«s shareholders would receive 0.6330 shares in CorpCo plus €2.2911 equivalent in
CorpCo shares at the same price as shares were issued in the capital increase (final value will depend on the current EUR/BRL exchange rate).
41 Source: Analyst estimates.
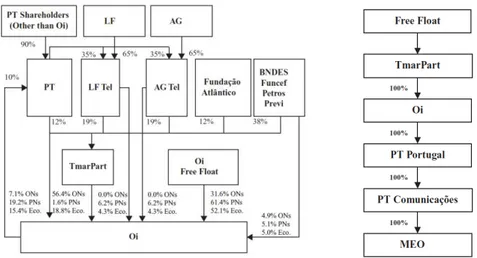
Figure 9 – Ownership structure of TmarPart (CorpCo) before (LHS) and after (RHS)
Note: PT, LF (Tel), AG (Tel), and BNDES stand for Portugal Telecom, La Fonte (Telecom), Andrade Gutierrez (Telecom), and Banco Nacional de Desenvolvimento Econômico e Social, respectively, whereas ONs, PNs, and Eco. stand for common, preferred, and total shares, respectively.
OI S.A. COMPANY REPORT
assets. Then, on July 28, 2014 both parties, PT SGPS and Oi S.A., agreed on new terms to proceed with the business combination, the so-called “Definitive Agreement”, which was later approved by the shareholders of PT SGPS and the board of directors of Oi S.A., comprising the following main conditions:
1. Upon approval of CVM, Oi S.A. will deliver the investments on Rioforte to PT SGPS in exchange for 47,434,872 and 94,869,744 common and preferred shares of Oi S.A. (or 134,819,393 common shares of CorpCo, should the exchange take place after the merger of shares)42 held by PT SGPS, representing 16.58% of Oi S.A.’s share capital and 17.10% of its voting rights.
2. Once the previous condition is approved, Oi S.A. will provide PT SGPS with an irrevocable and non-transferable call option to reacquire the abovementioned shares, with maturity of 6 years. The exercise price will be R$ 2.0104 per common share of Oi S.A. or CorpCo and R$ 1.8529 per preferred share of Oi S.A. (adjusted each year by the Brazilian CDI rate43 plus 1.50%). Plus, the number of shares that can be bought through this instrument is set to be reduced by 10% in the first anniversary of its effective date and by 18% in the subsequent ones.
3. The ultimate step of the business combination – the merger of PT SGPS with and into CorpCo – will no longer be possible as the former will still hold the investments on Rioforte and the call option on Oi S.A44 shares. As such, once the merger of shares and the migration of CorpCo to the Novo Mercado segment of BM&FBOVESPA is completed (i.e. the second major step), PT SGPS’s shareholders will receive CorpCo shares representing approximately 25.60% of the company’s share capital (adjusted for treasury shares), i.e. the stake that does not depend on the call option exercise. Additionally, after the merger of shares, the voting power of PT SGPS over CorpCo will be limited to 7.50%, regardless of the percentage interest it holds in the company.
Moreover, apart from the dramatic changes to the initial terms, a lot has changed ever since the default of Rioforte. Firstly, on October 7, 2014, Zeinal Bava, the CEO of PT SGPS from 2008 to 2013 and CEO of Oi S.A. since 2013 resigned his position and was replaced by Bayard Gontijo, who now accumulates the roles of interim CEO, CFO, and Investor Relations Officer. Besides, since Zeinal Bava
42 The original Definitive Agreement – signed before the share split – requested the delivery of 474,348,720 and 948,697,440
common and preferred shares of Oi S.A. (or 1,348,193,932 common shares of CorpCo, should the exchange take place after the merger of shares).
OI S.A. COMPANY REPORT
Figure 10 – Brazilian revenues per segment (R$ mn)
Source: Company fillings
Figure 11 – Brazilian nominal GDP per capita growth and inflation rate
Source: IMF
quitted his position, the company’s vision has been pointing more towards consolidation within the Brazilian market rather than following the primary intention of creating a giant multinational telecom company, as will be further discussed in section Scenario analysis.
All in all, the group is now awaiting45 (i) the approval from CVM to proceed with the exchange with PT SGPS, (ii) the SEC46 approvals regarding the registration of CorpCo shares – which are necessary steps to provide clearance for the listing on BM&FBOVESPA (Novo Mercado), NYSE Euronext Lisbon, and NYSE as well as for the merger of Oi S.A. into CorpCo (expected to happen during the first quarter of 2015) –, and (iii) the approval of PT SGPS’s shareholders to divest PT Portugal to Altice.
Brazilian operations
As previously mentioned, the Brazilian market is the main source of value for Oi S.A, forecasted to represent 56.90% of the group’s enterprise value (refer to Figure 2), as of December 31, 2015, with the residential services segment representing
the major component of revenues.
Regarding the macroeconomic and social contexts, Brazil has been through a dramatic transformation. As can be seen in Figure 11, from 2005 to 2013,
Brazilians been have accumulating real increases of their GDP47 per capita except for 2012, when prices grew 0.37 percentage points more than the domestic product per capita. This trend is forecasted by the IMF48 to keep gaining momentum from 2016 through 2019, after two consecutive downward adjustments in real terms projected to take place in 2014 and 2015.
As a consequence of this positive economic momentum that Brazil has been going through, demographics have also been changing. On one hand, the unemployment rate has decreased since 2005, when it stood at 9.83%, until 2014, period in which it is estimated by the IMF to hover around 5.50%, a figure that should remain rather stable through 2019 (refer to Figure 12). On the other hand,
the country has recorded a radical change as regards to the structure of its social classes. According to Figure 13, from 2003 to 2014, the population regarded as
45 Company fillings.
46 United States Securities and Exchange Commission.
47On an aggregate basis, the country’s GDP has been especially propelled by private and public consumption, as well as
gross capital formation, which represented 62.62%, 21.97%, and 17.89% of Brazil’s GDP by the end of 2013, whereas they
represented 60.27%, 19.91%, and 16.21%, respectively, in 2005, at the expense of the trade balance which became negative (3.61% of GDP in 2005 versus -2.48% in 2013). Plus, the country has not indebted itself to support this growth
trend, as the government’s gross debt represented 69.33% of the Brazilian GDP in 2005, while by 2013 its weight had
decreased by about 3 percentage points. Source: IMF.
OI S.A. COMPANY REPORT
low-income class ceased to represent almost half of the country’s population to denote exactly 25%, whereas the middle- and high-income classes increased their share in the whole society, representing by the end of 2014, 53.85% and 21.15% of the entire population, respectively.
Noticeably, all these changes ultimately have an impact throughout the various sectors of the economy, including the telecommunications sector. For instance, (i) the continuous increase in the annual spending per capita translates into a higher probability of people increasing their expenditures related to telecom services and (ii) the fact that inflation is predicted to steadily decrease from 2015 to 2019 decreases the risk that Oi S.A. would not be able to sustain its operating margin, given that the prices charged by the group in Brazil are regulated by ANATEL49 whereas the operating costs it has to bear are expected to reflect changes in inflation. Hence, it is expected that the company’s operations can benefit from the momentum the Brazilian economy is predicted to keep.
Competition
In Brazil, there are six major players in the telecommunications industry, namely: América Móvil (through its subsidiaries Embratel – operating under the trademarks Embratel and NET – and Claro), Telefónica Brasil (operating under the brand Vivo), Oi S.A. (operating under the brand Oi), Sky, TIM, and GVT50. However, not all of them have a considerable presence in each and every segment of operations51.
49 ANATEL regulates the annual price increases (for most telecom services) that operators might plan to implement. 50 Telefónica and Vivendi (owner of the entire equity of GVT) reached an agreement on September 19, 2014 that established
the acquisition of the stake held by Vivendi on GVT. As such, once all the required approvals from the regulatory agencies are met, the transaction will be performed and GVT will become a wholly-owned subsidiary of Telefónica.
51 Competition regarding the enterprise segment will not be covered due to lack of available information.
Figure 14 – Private consumption per capita in Brazil (constant R$)
Source: World Data Bank
Figure 12 – Unemployment rate in Brazil
Source: IMF
Figure 13 – Change in Brazilian demographics (social classes in % of total population)
Note: Classes AB, C, and DE correspond to high, middle, and low social classes, respectively.
OI S.A. COMPANY REPORT
Figure 17 – Wireline telephony market shares (% of accesses, main players)
Source: ANATEL
Wireline telephony
In the fixed telephony segment, Oi is the market leader, holding in its portfolio 36.50% of the total fixed accesses recorded in September 2014, despite it does not offer these services in Region III – São Paulo52–, which in 2011 accounted for 32.60% and 21.60% of Brazil’s GDP and population, respectively. However, its dominance has been deteriorating since 2010 (refer to Figure 17) mirroring the fact
that the company has historically had lower presence regarding pay TV and mobile telecommunications services, which impaired its ability to retain customers that were lured by convergent offers rolled out in the market by competitors that had a stronger footprint in such services. Moreover, the increase in the mobile users and the reduction of mobile service rates adversely affected the appetite by wireline telephony services53, further pushing Oi’s position downwards.
Wireline broadband
In what concerns the wireline broadband business, Oi has also observed a negative trend regarding its market share due to the same reasons that have been affecting its wireline phone business. Despite being able to sustain its market leader position until 2012, leveraged by its footprint in Brazilian households in terms of wireline telephony, from 2013 onwards the company’s market share kept declining (25.80% as of 3Q2014), lagging behind América Móvil’s brands (32.10% as of the same period).
Pay TV
The pay TV segment is a completely different game for Oi. The company started offering such services only in 200754 through DTH subscription TV services to
52According to company fillings, it keeps on assessing the possibility of offering these services in São Paulo, however, “due
to the size of the investment that would be required” it has decided not to enter in São Paulo.
53 Source: Company fillings. 54 Source: Company fillings.
Figure 15 – EBITDA margins
Sources: Teleco; Analyst estimates
Figure 16 – RGUs breakdown (3Q2014, in thousands)
Note: Wireline includes phone, broadband, and pay TV while wireless includes phone and broadband.
Source: Teleco
Figure 18 – Wireline broadband market shares (% of accesses, main players)
Sources: Analyst estimates; Teleco
Figure 19 – Pay TV market shares (% of subscriptions, main players)
OI S.A. COMPANY REPORT
income households in five Brazilian states, expanding its coverage to Regions I and II only by 2010. Plus, only in December 2012 the company began delivering pay TV services via fiber optic network, targeting higher-income classes. As such, the late entry combined with an initial low coverage has been crucial in the role that Oi plays in the subscription TV segment.
Personal mobility
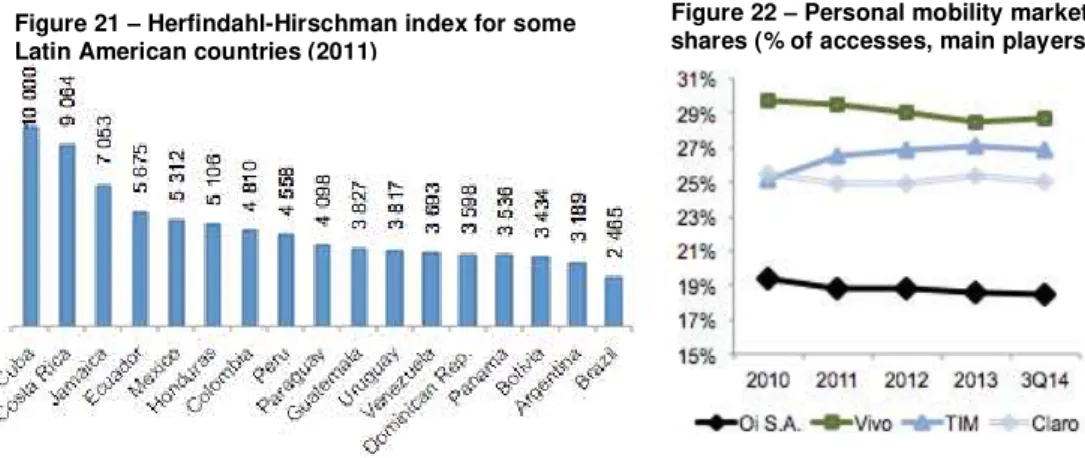
This is a segment that has played a major role in Brazil’s telecom industry. As previously mentioned, as the prices of mobile services decline and approach those of fixed line services, users are tempted to shift from wireline to wireless telecom services, provided that the latter offer a higher degree of flexibility at a similar cost for the user. However, despite the relevance of this segment, Oi has also lagged behind its major competitors as the company took too long to realize this change in customers’ preferences and increase its mobile coverage vis-à-vis the other main players, which, on top of the highly competitiveness that reigns in this segment (as measured by the Herfindahl-Hirschman index55 in Figure 21), has taken its tollin Oi’s market share.
Financial projections
Residential: bundling is the keystone
In our opinion, the residential segment is the key segment for Oi’s future prospects. As previously mentioned, the company possesses the biggest telecommunications backbone in Brazil and is the market leader in what concerns fixed telephony services, which makes us believe that there is a huge potential for leveraging such a footprint. However, its leadership has been challenged by its competitors due to three main reasons. Firstly, Oi derives most of its residential business from fixed
55 This index is computed as the sum of squared market shares of all firms in a market. Its output ranges from 0 (perfect
competition) to 10,000 (monopoly).
Figure 20 – Mobile coverage in Brazil (% of total population)
Source: Teleco
Figure 22 – Personal mobility market shares (% of accesses, main players)
Sources: ANATEL; Teleco
Figure 21 – Herfindahl-Hirschman index for some Latin American countries (2011)
Source: GSMA (Brazil Mobile Observatory 2012)
Figure 23 – Residential RGUs breakdown
OI S.A. COMPANY REPORT
Figure 25 – Complaints per 1,000 subscribers (Pay TV)
Source: Teleco
line telephone services (refer to Figure 23), having a reduced expression in the
pay TV business, as previously depicted through market shares. Secondly, both the fixed phone and pay TV services provided by Oi are those that are perceived by consumers as the lowest-quality ones amongst its peers, as measured by the average number of complaints per 1,000 subscribers56. Lastly, the Brazilian market has experienced a fixed-to-mobile shift in what regards to telecommunications services (compare Figure 27 to Figure 34), both prompted by the steady decrease
in mobile service rates – the effective price per minute of mobile phone calls in Brazil decreased 39% from 2008 to 201257– and the higher flexibility offered by mobile services versus fixed ones.
As a response to the deterioration of its market position, Oi is now turning into bundled offers (as of 3Q2014, 61% of Oi’s homes had multi-play packages, a 3 percentage point increase on a yearly basis58) that combine fixed phone, broadband, pay TV, and mobile services – with the roll-out of Oi Conta Total and Oi Voz Total –, which can offer the company the ability to leverage its position in
wireline telephony by cross-selling the other services, while reducing churn rates59, ultimately positively impacting the residential ARPU. Actually, according to Mr. Bayard Gontijo during the last earnings call, Oi is trying to mimic what PT Portugal did in Portugal regarding its very well succeeded convergent offers (pay TV customers represent 52% of PT Portugal’s unique customers in the residential segment, an increase of 63% from 2010 to 3Q201460).
In our opinion, this is in fact the right path for Oi to follow, not only because of the abovementioned reasons, but also because Brazil has been through a dramatic change in its social classes, thus benefiting from a wider population regarded as middle- and high-class, which, in turn, have higher disposable income, increasing the chances of both cross-selling (as services that were once regarded premium become a day-to-day need for such households) and up-selling (as the demand for higher connection speeds and premium TV content increases).
Nonetheless, we also believe that Oi will face some challenges that might impair its ability to fully exploit the potential of convergence. On one hand, the fact that it only started providing mobile services in Region III in 2008 (where it was only the
56 However, according to the Management Report of 2013 and to the 3Q2014’s earnings call, the company has been
experiencing a reduction in the rate of complaints especially after the implementation of the Workforce Management tool
by the end of 2012 as well as due to the recent sales channel and commission model restructuring, taking advantage of
PT’s experience and know-how in these specific matters.
57 Source: GSMA (Brazil Mobile Observatory 2012). 58 Source: Company fillings.
59 According to Oi S.A., its Brazilian triple-play offers have churn rates that are 46% and 52% lower for pay TV and fixed
line telephony, respectively, than on a standalone basis (as of 3Q2014).
60 Source: Company fillings.
Figure 24 – Complaints per 1,000 subscribers (Wireline telephony)
OI S.A. COMPANY REPORT
15 17 19 21 23 25
0% 10% 20% 30% 40% 50%
Penetration (per 100 inhabitants)
Market share
fourth main player in terms of market share – 12.91%61– as of 3Q2014,) and that it does not offer wireline telephony in this very region certainly decreases the capacity for the company to further converge its RGUs and up-sell its services vis-à-vis its main competitors (which operate in this market62). On the other hand, the expected increase in residential ARPU is likely to be partially offset by the fierce price competition that the residential market is facing63, as all players realize that convergent offers are the key for increasing customer retention and increasing ARPUs. Plus, we believe that this competitive environment is going to be pushed further by the full integration of GVT into Telefónica, through which Telefónica will become market leader in the fixed phone segment and number two in the fixed broadband segment (with market shares of 35.02% and 30.20%, respectively, as of 3Q2014) as well as a nationwide player in the pay TV market, increasing its ability to push for convergence amongst its current customer basis.
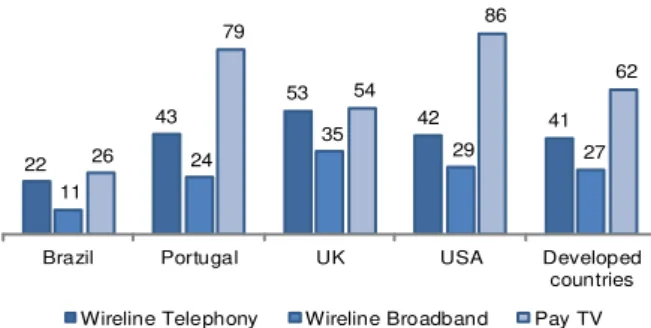
As for the penetration of such services in Brazil, we believe there are two different trends going on, despite the country lags behind the average developed country in all of them, as shown in the figure below.
Regarding fixed line telephony, we think that despite Brazil has only about half of the accesses per 100 inhabitants vis-à-vis developed countries, Brazilians will not see this capillarity expand considerably in the following years especially because demand for fixed voice services has reached a plateau in recent years64 due to the abovementioned fixed-to-mobile shift in the country. As such, we predict a growth in main telephone lines per 100 inhabitants slightly below the trend experienced from 2011 to September 2014, i.e. an annual growth rate of 0.50%. However, in what concerns wireline broadband and pay TV, both are still gaining momentum in
61 Source: Teleco.
62 Vivo, TIM, and Claro are market leaders in the mobile segment in São Paulo (with market shares equal to 32.92%,
27.83%, and 24.85%, respectively, as of 3Q2014) while Vivo (63.52%) and Embratel (30.45%) were the front-runners in the fixed telephony market in this region in 2012 (most up-to-date data available). Sources: ANATEL and Teleco.
63 Source: Company fillings 64 Source: Company fillings.
Figure 26 – Penetration rate per 100 inhabitants in 2013 (except for pay TV – per 100 households, in 2012)
Sources: OECD; International Telecommunications Union; Teleco
Figure 27 – Fixed line telephony
penetration rate (LHS) and Oi’s
market share (RHS)
Sources: Analyst estimates; Teleco
22
43
53
42 41
11
24
35
29 27 26
79
54
86
62
OI S.A. COMPANY REPORT 20% 25% 30% 35% 0 5 10 15
Penetration (per 100 inhabitants)
Market share
approaching the figures seen in rich countries (especially pay TV, which in 2012 reached only 22 of each 100 Brazilian households, whereas in Portugal, for instance, 79 out of each 100 households contracted pay TV services). Actually, according to a study conducted by Digital TV Research, it is expected that 35% of the Brazilian households will have paid TV inside their homes by 2016. As such, we assumed that fixed broadband penetration will keep growing at a high pace until 2019 (4.07% per year, compound-wise), whereas pay TV will grow at a rate aligned with Digital TV’s findings, i.e. 4.41% per year, on a compound basis. Regarding the market position vis-à-vis its competitors, we also believe there will be two different trends as for the services penetration. For starters, Oi’s fixed line telephony will continue to lose market share but at a lower rate, as the number of complaints decreases and the take-up of convergent plans by customers leverages the existing backbone. Secondly, we trust that the decrease in Oi’s market share of fixed broadband is stabilizing65 and will start to slowly recover during 2016 chiefly due to recent investments upgrading network capacity to deliver higher speeds which match clients’ needs66. Plus, we predict that pay TV – the main driver of Oi’s convergence strategy – is going to be the best performing segment of the residential services. Despite its late entrance in the market, Oi has adopted a strategy of using DTH services in low-density areas (through the implementation of a new TV platform using the SES-6 satellite, which provides the greatest capacity in the Brazilian market and can support next years’ growth67), while expanding its FTTH network in high-density, high-income areas which is proving successful and still gaining momentum, in our opinion. Moreover, as of 3Q2014, only 9.30% of Oi’s homes contracted pay TV services to the company, which demonstrates the potential to push for convergence.
Last but not least, we predict that the blended residential ARPU is going to continue to steadily increase over time. Despite the fierce competition, Oi has been able to increase its average revenue per residential customer even with a rather modest strategy of convergence. As so, the recent introduction of convergent plans including pay TV and their ability to reduce churn rates and promote cross- and up-selling strategies supports our conclusions. Moreover, according to Teleco, Brazilian fixed line telephony and broadband services are amongst the cheapest worldwide68, further supporting our belief.
65 As of 3Q2014 Oi achieved a 27.61% market shares, whereas it recorded 27.70%, 30.00%, and 30.20% by the end of
2013, 2012, and 2011, respectively.
66 The average speed was 4.30 Mbps (a 15.70% y.o.y. increase) and about 83% of Oi’s gross additions contracted speeds
higher than 5 Mbps as of 3Q2014.
67 Source: Company fillings.
68 During August 2014, Teleco collected data on the prices charged for these services in 18 countries (Argentina, Australia,
Brazil, Chile, China, Colombia, France, India, Italy, Japan, Peru, Portugal, Mexico, Russia, Spain, South Korea, the United
Figure 29 – Pay TV penetration rate
(LHS) and Oi’s market share (RHS)
Sources: Analyst estimates; Teleco
67.07 71.82
73.58 73.95 74.32
62 64 66 68 70 72 74 76
Figure 30 – Blended residential ARPU (R$)
Sources: Analyst estimates; Company fillings
Figure 28 – Fixed broadband
penetration rate (LHS) and Oi’s
market share (RHS)
Sources: Analyst estimates; Teleco
0% 2% 4% 6% 8% 0 10 20 30 40
OI S.A. COMPANY REPORT
Personal mobility: huge penetration, tiny market share
The Brazilian mobile telecom sector is at a maturity stage completely different from that of the fixed line segment, being a developed segment within a developing industry. As can be seen in the figure below, the average number of cellphones per person in Brazil is in fact above the level experienced in an average developed country. Hence, we project that the penetration rate of mobile devices will stabilize
at about 3Q2014 levels. However, one must bear in mind that Brazil’s population is still expected to increase69, which means that the absolute number of active cellphones is going to increase more than the penetration rate. Plus, in what regards to the usage of smartphones, the country still has room to increase the penetration of such devices, which in turn imply an increase in the consumption of mobile data services and thus a higher penetration of 3G and 4G frequencies. Despite the huge potential of the Brazilian mobile market, Oi has not been able to explore its full potential. As already mentioned, the company expanded its mobile coverage considerably later than its competitors, which translated into lower market shares (refer to Figure 20 and Figure 22). Moreover, as for the fixed line
services, Oi’s personal mobility segment has been constantly the number one in terms of complaints per 1,000 customers and only recently the company was able to match its records to those of its competitors (refer to the reasons mentioned in
Footnote 56).
We believe that Oi will follow a three-pillar approach regarding the personal mobility segment, aligned with the aim of increasing convergence70. On one hand, the company will continue to focus on prepaid services, giving their low customer acquisition costs, no billing and collection costs, as well as no bad debt, positively
Kingdom, and the United States of America) finding that Brazil charges the eight and third lowest prices (adjusted for purchasing power) for fixed phone and broadband services, respectively.
69 IBGE projects that the Brazilian population will increase by 0.77% (CAGR) on a yearly basis from 2014 to 2019.
70 According to company fillings, 26.53% of 3Q2014 fixed line accesses have an underlying mobile prepaid bundle, up from
19.09% as of 3Q2013, showcasing the increase in convergence.
135 159 124
96
121
26 32
62 56
#N/A
Brazil Portugal UK USA Developed
countries
Mobile Smartphone
Figure 31 – Penetration rate per 100 inhabitants in 2013
Note: There is no relevant data available regarding smartphone penetration for developed countries as a whole.
Sources: International Telecommunications Union; Our Mobile Planet
Figure 33 – Complaints per 1,000 subscribers (Personal Mobility)
Source: Teleco
Figure 32 – Mobile data traffic in Brazil (Pb/month)
Source: GSMA (Brazil Mobile Observatory 2012)
14.00 26.20 47.00 82.40 147.50 260.30 0 50 100 150 200 250 300
Figure 34 – Mobile phone penetration
rate (LHS) and Oi’s market share (RHS)
Sources: Analyst estimates; Teleco
0.00 0.20 0.40 0.60 0.80
2010 2011 2012 2013 5M14 Oi Vivo TIM Claro
15% 16% 17% 18% 19% 20% 80 100 120 140 160
Penetration (per 100 inhabitants)
OI S.A. COMPANY REPORT
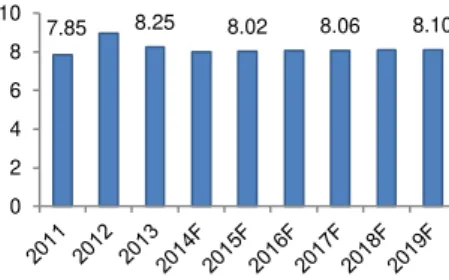
Figure 36 – Enterprise RGUs (million)
Sources: Analyst estimates; Company fillings
7.85 8.25 8.02 8.06 8.10
0 2 4 6 8 10
impacting the company’s working capital71. On the other hand, we expect the company to grow its postpaid customer basis (at a faster pace than its prepaid customer basis), leveraging the Oi Controle plan, which has absence of bad debt
since billing is automatically processed through customers’ credit cards but, at the same time, underlines a higher consumption profile and lower churn rates72. Lastly, taking advantage of the expected increase in smartphones penetration and last years’ extensive capital expenditures to expand 2G, 3G, and 4G coverage73 – which included a partnership signed with TIM in 2013 to build extra 4G capacity and consequently share the spectrum as well as a RAN sharing agreement also with TIM to share 3G installed capacity – we forecast that Oi will increase its share of revenues coming from mobile data consumption, having a positive impact in the segment’s ARPU.All in all, we project Oi’s mobile market share will benefit from this strategy, yet in a very modest way given that its competitors have strong positions in terms of market leadership.
Regarding this segment’s ARPU, we expect it to slightly increase mainly due to the following events: (i) abovementioned increase in mobile data consumption (positive impact), (ii) increase in Oi’s share of postpaid clients vis-à-vis prepaid ones (positive impact), and (iii) announced reduction of MTRs imposed by ANATEL – the rate charged per minute is currently at R$ 0.24 (25% y.o.y.) and is expected to decrease to a range between R$ 0.093 and R$ 0.112 by 2016 and to a range between R$ 0.013 and R$ 0.024 by 2019 – (negative impact).
Enterprise: less disclosure, more uncertainty
Although this segment represented about 30% of Oi’s revenues in 2013, the company (and the market in general) discloses scarce information on its performance. Nevertheless, one can clearly say that this is the segment that depends the most on the country’s economic performance, as the evolution in the existing number of enterprises, and thus potential clients, tend to mimic the economic cycle. According to IMF’s World Economic Outlook Database, Brazil’s GDP is expected to grow at a compounded annual rate of 2.45% from 2014 to 2019, on a constant-prices basis, which makes us believe that demand for such services will not be an issue for Oi, leading us to assume that the number of RGUs held by the company in the enterprise segment will keep evolving at a rate near that experienced from 2011 to 3Q2014.
71 Source: Company fillings.
72 According to 2Q2014 results, Oi Controle’s ARPU is approximately 2.20 times higher than the ARPU for the average
prepaid plan whereas its churn rate is lower by 3.90 percentage points.
73 As of 3Q2014, Oi’s 2G, 3G, and 4G coverage reached 93%, 77%, and 36% of Brazil’s urban population, respectively.
Source: Company fillings.
Figure 35 – Personal mobility ARPU (R$)
Sources: Analyst estimates; Company fillings
15.78
16.22 16.30 16.38 16.47
OI S.A. COMPANY REPORT
89.93
85.44 85.87 86.30 86.73
50 60 70 80 90 100
Regarding the strategy to be followed by Oi, we believe the group will keep on pushing for convergence in this segment (according to the company, 67% of 3Q2014’s mobile net adds were convergent which compares to just 3% during 3Q2013) as there seems to be room for such strategy – 17% of Oi’s enterprise RGUs were convergent as of 3Q2014, whereas in Portugal the company achieved a ratio of 45% as of 2Q201474– allowing it to experience lower churn rates. As a consequence, we predict that ARPU will continue to rise, at a CAGR equal to 0.25%.
Operating margins and capital expenditures
In what concerns operational efficiency, Oi did a remarkable job vis-à-vis its competitors, as can be seen in Figure 15. From 2011 to 2013, the company
increased its EBITDA margin from 30.09% to 34.04%, standing as second best amongst its peers. This improvement was mainly achieved due to: (i) implementation of best practices in Brazil aligned with those practiced in Portugal (refer to Footnote 56 for some examples), (ii) the increase in convergent offers that
reduce churn rates, and thus the costs of retaining clients, and (iii) the abovementioned reduction in MTRs that despite impacting negatively the company’s revenues, have a positive impact on its costs, as Oi also have to pay for such services.
However, according to 3Q2014’s earnings call and preliminary financial figures regarding the first two months of 4Q2014 released in December 2014, the company’s EBITDA margin decreased considerably during the past year, driven by: (i) the increase of rents and insurance (43.50% y.o.y. as of 3Q2014) due to the disposal of non-strategic assets75 (in tandem with the signature of leasing contracts to keep using them) initiated in 2012 and completed in December 2014, (ii) higher marketing expenses with the roll-out of Oi Conta Total and Oi Voz Total (17.70%
y.o.y. as of 3Q2014), and (iii) the higher personnel costs (9.50% y.o.y. as of 3Q2014). However, we believe that from 2015 through 2019, Oi will experience a modest increase of its EBITDA margin as the sale of the abovementioned assets is expected to decrease network maintenance expenses.
The company has also announced during 3Q2014’s earnings call that CAPEX in Brazil decreased 7.10% y.o.y., mirroring the fact that the massive non-recurrent outlays experienced in 201376 are now decreasing. Moreover, management has
74 Source: Company fillings.
75 The targeted assets consisted mainly of real estate and fixed and mobile telecom towers in Brazil as well as a submarine
fiber-optic cable system that connected the United States, Bermuda, Brazil, Venezuela, and Colombia.
76 In 2013, the company invested R$ 6,250 million especially to: (i) expand its 3G network, (ii) implement and expand its
4G network, and (iii) upgrade the quality and speed of broadband and TV services.
Figure 37 – Enterprise blended ARPU (R$)
Sources: Analyst estimates; Company fillings
30.09% 34.04%
23.84% 24.84% 25.84%
10% 15% 20% 25% 30% 35% 40%
Figure 38 – EBITDA margin
Sources: Analyst estimates; Company fillings
Figure 39 – CAPEX (LHS) and CAPEX as a percentage of revenues (RHS)
Source: Analyst estimates
10.0% 15.0% 20.0% 25.0%
4,000 4,500 5,000 5,500 6,000
CAPEX (R$ mn)