Submitted 1 July 2015 Accepted 23 August 2015 Published29 September 2015 Corresponding author Xavier Arnan,
Academic editor Darren Ward
Additional Information and Declarations can be found on page 15
DOI10.7717/peerj.1241 Copyright
2015 Arnan et al.
Distributed under
Creative Commons CC-BY 4.0 OPEN ACCESS
Partitioning the impact of environment
and spatial structure on alpha and beta
components of taxonomic, functional,
and phylogenetic diversity in European
ants
Xavier Arnan1,2, Xim Cerd´a3and Javier Retana2,4
1Departamento de Botˆanica, Universidade Federal de Pernambuco, Recife Pernambuco, Brazil 2CREAF, Cerdanyola del Vall`es Catalunya, Spain
3Estaci ´on Biol ´ogica de Do˜nana, CSIC, Sevilla, Spain
4Univ Autonoma Barcelona, Cerdanyola del Valles Catalunya, Spain
ABSTRACT
We analyze the relative contribution of environmental and spatial variables to the alpha and beta components of taxonomic (TD), phylogenetic (PD), and functional (FD) diversity in ant communities found along different climate and anthropogenic disturbance gradients across western and central Europe, in order to assess the mechanisms structuring ant biodiversity. To this aim we calculated alpha and beta TD, PD, and FD for 349 ant communities, which included a total of 155 ant species; we examined 10 functional traits and phylogenetic relatedness. Variation partitioning was used to examine how much variation in ant diversity was explained by environ-mental and spatial variables. Autocorrelation in diversity measures and each trait’s phylogenetic signal were also analyzed. We found strong autocorrelation in diversity measures. Both environmental and spatial variables significantly contributed to variation in TD, PD, and FD at both alpha and beta scales; spatial structure had the larger influence. The different facets of diversity showed similar patterns along environmental gradients. Environment explained a much larger percentage of variation in FD than in TD or PD. All traits demonstrated strong phylogenetic signals. Our results indicate that environmental filtering and dispersal limitations structure all types of diversity in ant communities. Strong dispersal limitations appear to have led to clustering of TD, PD, and FD in western and central Europe, probably because different historical and evolutionary processes generated different pools of species. Remarkably, these three facets of diversity showed parallel patterns along environmental gradients. Trait-mediated species sorting and niche conservatism appear to structure ant diversity, as evidenced by the fact that more variation was explained for FD and that all traits had strong phylogenetic signals. Since environmental variables explained much more variation in FD than in PD, functional diversity should be a better indicator of community assembly processes than phylogenetic diversity.
Subjects Biodiversity, Biogeography, Ecology, Entomology
Keywords βdiversity, Environmental gradients, Environmental determinism,
INTRODUCTION
A central goal in ecology is to describe patterns of species diversity and composition along broad environmental gradients and to identify the mechanisms that underlie them (e.g.,Pianka, 1966;Gaston, 1996). For instance, broad-scale patterns of species richness are often correlated with contemporary climate (Gaston, 1996). However, since climatic factors are usually correlated with latitude, and latitude is, in turn, correlated with other factors, the underlying causes of variation in species richness are much debated (e.g.,Pianka, 1966;Willig, Kaufman & Stevens, 2003). Moreover, other environmental factors besides (or in addition to) climate can affect diversity patterns. For instance, species richness and composition may vary along disturbance (Fox, 2013) or habitat heterogeneity gradients (Rahbek et al., 2007).
Spatial factors might also influence diversity patterns. In fact, environmental gradients are themselves spatially structured (Legendre & Legendre, 1998), and random but spatially limited dispersal of species (Tuomisto, Ruokolainen & Yli-Halla, 2003) can also generate spatially structured patterns. Consequently, dispersal limitations and habitat and environmental similarities may result in positive spatial autocorrelation in communities (Legendre et al., 2009). In particular, the extent to which species diversity patterns are determined by environmental filters versus random but spatially autocorrelated dispersal are intensely debated (e.g.,Tuomisto, Ruokolainen & Yli-Halla, 2003). It has been suggested that simultaneously examining the influence of environmental and spatial factors on communities could reveal their relative importance (e.g.,Borcard et al., 2004). If species diversity patterns solely vary along environmental gradients, it would indicate that the underlying mechanism is environmental filtering; if only spatial structure has an effect, variation in diversity patterns may arise from dispersal limitations. Although there has been a recent increase in the number of studies analyzing the relative contribution of environmental and spatial factors to species diversity patterns, taxonomic diversity (TD) has been the main focus; other diversity components have only rarely been examined (but seeMeynard et al., 2011).
thought that FD and PD are positively correlated with TD at the regional scale (e.g.,Forest et al., 2007;Faith, 2008;Meynard et al., 2011; but seeLosos, 2008;Devictor et al., 2010;Safi et al., 2011). If functional traits allow species to locally adapt to environmental conditions (Pavoine et al., 2011), it may be that environmental filters predominantly influence the functional structure of communities and that nothing is reflected by their taxonomic and phylogenetic structures (D´ıaz et al., 2007;Mouchet et al., 2010). However, a strong correlation between FD and PD would be expected if the functional traits that allow species to persist in the environment are evolutionarily conserved, that is to say, they display phylogenetic signals (Webb et al., 2002;Cavender-Bares et al., 2009).
Since the processes that shape biodiversity differ across scales (Whittaker, Willis & Field, 2001), it is also relevant to study the aforementioned facets of diversity at different scales of analysis (e.g., alpha and beta diversity) (Devictor et al., 2010;Bernard-Verdier et al., 2013). Analyzing patterns at only one of these scales can result in misleading or incomplete interpretations of the results (Whittaker, Willis & Field, 2001). For instance, if environmental determinism is at work via trait-based species sorting, significant patterns of turnover (i.e., beta diversity) in FD, PD (assuming niche conservatism), and TD will be found. In contrast, it may not translate into significant patterns in alpha-level TD, PD, and FD: their values may remain unchanged despite significant species, species-trait, or lineage turnover (Mouchet et al., 2010). In addition, addressing both scales of analysis provides complementary information. At the local-level, biotic interactions, environmental filtering, and stochastic processes play major roles in determining (alpha) diversity whereas, at more regional scales, environmental filtering as well as historical and evolutionary processes may largely drive (beta) diversity (Cavender-Bares et al., 2009). For instance, it is thought that environmental filtering operates more strongly at the regional scale (Cornwell, Schwilk & Ackerly, 2006), while species interactions (e.g., competition) drive local-level assembly patterns (Cavender-Bares et al., 2009;Slingsby & Verboom, 2006).
Figure 1 Map of the study area showing plot distribution.
(Mezger & Pfeiffer, 2011), we expected spatial factors to make a larger contribution. Second, the different facets of biodiversity should show similar responses along environmental gradients. Third, because environmental filtering is expected to limit community members to those that are preadapted to local conditions, and that are thus functionally similar, environmental factors should influence FD more than TD or PD; in turn, if strong niche conservatism exists, PD and FD should display similar patterns.
MATERIAL AND METHODS
Ant community data
data are more comparable among sites than are abundance data (usually measured in different ways: number of nests, individuals at baits, or individuals in pitfall traps), we focused our analyses on the presence-absence dataset.
Trait data
We characterized 155 ant species according to 10 traits that determine different dimensions of the ants’ functional niches with respect to morphology, life-history, and behavior at both the level of the individual worker and that of the colony (Tables S1andS2). These traits are considered important in ants because of their influence on ant autoecology and ecosystem functioning (e.g.,H¨olldobler & Wilson, 1990;Arnan, Cerd´a & Retana, 2012;Arnan et al., 2013;Arnan, Cerd´a & Retana, 2014); furthermore, they strongly respond to environmental gradients (Arnan, Cerd´a & Retana, 2012;Arnan et al., 2013;Arnan, Cerd´a & Retana, 2014).
Phylogenetic data
We built a complete phylogeny for the 155 ant species considered (phylogenetic tree provided inFig. S1). This tree was the product of a super tree derived from a genus-level phylogeny created using a molecular dataset (Moreau & Bell, 2013). We then added species to this basal tree by integrating the results of different studies, using a combination of molecular and taxonomic data (Appendix S1). The tree was reconstructed with Mesquite version 3.0 (Maddison & Maddison, 2014). For this phylogeny, reliable estimates of branch length and node ages were unavailable. First, to solve the polytomies, we used ‘multi2di’ from the R (R Development Core Team, 2010) package ‘phytools’. Second, the tree was ultrametrized applying Grafen’s Rho transformation to branch lengths, using the function ‘compute.brlen’ from the R package ‘ape.’
Environmental gradients
Sites were classified according to their positions along different environmental gradients, which were grouped into two broader gradients:
(a) Climate gradients. Climate data for each site came from the WORLDCLIM database (http://www.worldclim.org/bioclim); rasters of the highest available resolution (30 arc-seconds) were used. We obtained values for four climate variables: mean annual temperature, temperature amplitude (the difference between the maximum and the minimum annual temperatures), annual precipitation, and precipitation seasonality (coefficient of variation of the monthly precipitation level). Previous studies have high-lighted the independence of these climate variables (Arnan, Cerd´a & Retana, 2014). (b) Land-use gradients. A land-use diversity index was calculated by applying the Simpson
of the 2-km radius area around the center of each plot that was occupied by the aforementioned artificial surfaces. We assumed that natural sites within areas with a higher proportion of anthropogenic land-use would be more likely to suffer from anthropogenic disturbance.
All variables were standardized to have a mean of 0 and a variance of 1 (De Bello et al., 2010).
Spatial structure
In order to explore the sites’ spatial structure, we generated a set of multiscale principal coordinates of neighbor matrices (PCNM) from the geographic distance matrix using the R packagePCNM. PCNM eigenfunctions depict a spectral decomposition of the spatial relationships among sites. They are orthogonal sine waves that describe all the spatial scales that can be accommodated in the sampling design (Dray, Legendre & Peres-Neto, 2006), such that the first and last axes represent broad- and fine-scale patterns, respectively. Sixty PCNMs were generated.
Partitioning taxonomic, functional, and phylogenetic diversity
To partition each facet of biodiversity considered (TD, FD, and PD) into alpha and beta components, we used the Rao quadratic entropy index, which provides a standardized methodology for comparing these components within the same mathematical framework (Pavoine, Dufuor & Chessel, 2004;De Bello et al., 2010;Devictor et al., 2010). Moreover, this index makes it possible to calculate functional diversity for combinations of traits, and it can handle quantitative, categorical, and binary traits (e.g.,Rao, 1982;Lepˇs et al., 2006). Furthermore, its estimates of functional and phylogenetic diversity are relatively independent of taxonomic diversity (e.g.,Mouchet et al., 2010). We used additive partitioning to break down overall gamma diversity into within (alpha) and among (beta) community diversity. Within each communitykwithSspecies,α-diversity was calculated using Rao’s coefficient of diversity (Rao, 1982;Pavoine, Dufuor & Chessel, 2004) modified for presence-absence data:
αRao(k)= S
i=1 S
j=1
dij
wheredijis the distance between speciesiandj, which can be taxonomic, functional, or
phylogenetic. This index represents the expected dissimilarity between two individuals of different species chosen randomly from the community. Between communitieskandl,
β-diversity was computed using the Rao’s dissimilarity index (Rao, 1982;Pavoine, Dufuor & Chessel, 2004), which is the expected distance between two individuals of different species chosen randomly from two distinct communities:
βRaopairwise(k,l)=(γ(k+l)− ¯α(k,l))/γ(k+l)
whereγk+1is the gamma diversity of the pair of communities (calculated with the same
two communities) andα¯(k,l)is the meanα-diversity of the two communities. Prior to
performing the calculations, we applied Jost’s correction (Jost, 2007) toγ andαto properly quantifyβ-diversity independently ofα-diversity (De Bello et al., 2010). To carry out these calculations, we used the function ‘rao’ (De Bello et al., 2010) in R.
To calculate the Rao quadratic entropy index, different distance measures were used depending on the facet of diversity considered. Taxonomic distances between species were measured asdij =1 wheni̸=j, anddij =0 wheni=j. To compute functional
distances between species, we first conducted a principal component analysis (PCA) on the standardized (mean=0, SD=1) trait data to correct for dominance in the distance matrix by highly correlated traits (Devictor et al., 2010;Purschke et al., 2013). The resulting PCA axes were used to calculate Euclidean distances. Phylogenetic distances between species were measured with the cophenetic distances from the phylogenetic tree. We scaled all distances between 0 and 1 by dividing each type of distance by its maximum value in order to make taxonomic, functional, and phylogenetic distances comparable.
Statistical analyses
Moran’s I and Mantel tests were used to test for spatial autocorrelation between the alpha and beta components of TD, PD, and FD, respectively.
We used redundancy analysis (RDA) with variation partitioning (Borcard, Legendre & Drapeau, 1992) to assess the relative influence of environmental and spatial factors, alone and combined, on alpha- and beta-level variation in TD, PD, and FD. We partitioned the variation into multiple components: a pure environmental component, a pure spatial component, a spatially structured environmental component, and residual variation. Forward selection (Blanchet, Legendre & Borcard, 2008) was used for each set of environmental and spatial variables to select only those variables that significantly explained variation in the dependent variables (p<0.05, after 999 random permutations). Only the selected variables were used in variation partitioning.R2values adjusted for the number of sites and explanatory variables were used throughout because they provided corrected estimates of explained variation (R2adj;Peres-Neto et al., 2006). Monte Carlo permutation tests (9,999 permutations) were used to calculate the significance levels of the different components. Since the beta diversity indices estimated with the RaoQ index were dissimilarity matrices, they cannot be used directly as response variables in this type of variation-partitioning framework. Therefore, prior to conducting the RDA analysis and variation partitioning, we transformed the dissimilarity matrices into data frames by conducting a principal coordinate analysis (PCoA) on the dissimilarity matrices; we then used the scores of the significant axes as the representative values for each community (Legendre & Anderson, 1999). Mixing traits in the functional diversity index as we did could have resulted in FD demonstrating a neutral response to gradients; this does not occur when individual traits are used. To address this problem, we also conducted analyses of FD for each trait separately.
10 20 30 40 50 60
5 15 25 35 45 55
Alpha TD
Broad scale
Fine scale
10 20 30 40 50 60
5 15 25 35 45 55
Alpha PD
10 20 30 40 50 60
5 15 25 35 45 55
Alpha FD
10 20 30 40 50 60
5 15 25 35 45 55
Beta TD
10 20 30 40 50 60
5 15 25 35 45 55
Beta PD
10 20 30 40 50 60
5 15 25 35 45 55
Beta FD
Figure 2 Correlograms for the alpha and beta components of the taxonomic, phylogenetic and func-tional diversity.We used the Moran’s I and Mantel tests for alpha and beta diversity, respectively. Black circles indicate significant correlation (p<0.05).
λtest (Pagel, 1999), which assumes a Brownian motion (BM) model of trait evolution. To test for statistical significance, we used a likelihood ratio test approximated by a chi-squared distribution to compare the negative log likelihood obtained when there is no signal (i.e., using the tree transformedλ=0) to that estimated from the original topology.
All analyses were conducted in R using the packfor, PCNM, vegan, ade4, and Geiger packages.
RESULTS
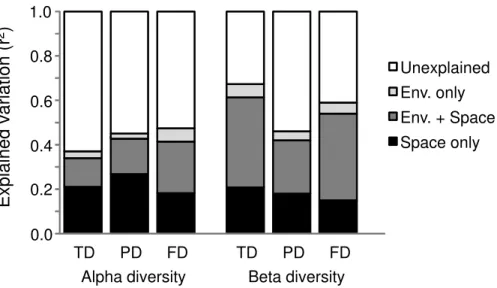
0.0 0.2 0.4 0.6 0.8 1.0
TD PD FD TD PD FD
Unexplained Env. only
Env. + Space
Space only
Alpha diversity Beta diversity
E
x
pl
ai
ne
d
v
a
ri
a
ti
o
n
(r
2)
Figure 3 Partitioning of variation in alpha- and beta-level taxonomic (TD), phylogenetic (PD), and functional (FD) diversity.The figure depicts the adjusted unique contribution (R2) of environmental factors (light gray), spatial factors (black), spatially structured environmental factors (dark gray), and unexplained variation (white), as calculated in the RDA analyses. Tests of significance for the environ-mental and spatial factors were all significant (p<0.05).
strongly structured by space. The PCNMs retained in the alpha- and beta-level models of spatial structure were mostly broad in scale (Fig. 4).
Although environmental factors made a relatively smaller contribution, they nonethe-less appear to play an important role in structuring ant diversity. Interestingly, the different facets of diversity mostly responded to similar environmental gradients in the same way (Table 1), which gives support to our second hypothesis. In the alpha-level RDAs, two of the six environmental variables (mean annual temperature and anthropogenic disturbance) were retained in the TD, PD, and FD models, which highlight the role of these two factors in determining ant diversity. In particular, warmer and less disturbed sites had higher levels of all three types of diversity. Mean annual temperature explained most of the variation in PD and FD; in the case of TD, anthropogenic disturbance explained an equivalent amount of variation. TD and FD were positively correlated with temperature amplitude, and TD and FD were negatively correlated with precipitation seasonality and annual precipitation, respectively (Table 1). No facet of diversity was influenced by land-use diversity. In the beta-level RDAs, four of the six environmental variables (mean annual temperature, temperature amplitude, precipitation seasonality, and anthropogenic disturbance) were retained in the TD, PD, and FD models (Table 1). More specifically, the greater the distance among these environmental variables, the higher the turnover in TD, PD, and FD. Once again, mean annual temperature explained most of the variation. Turnover in TD was mediated by differences in annual precipitation, while turnover in FD was mediated by annual precipitation and land-use diversity (Table 1).
A
lpha
B
e
ta
Distance (mean-of-class)
Taxonomic diversity Phylogenetic diversity Functional diversity
Distance (mean-of-class) Distance (mean-of-class)
C
orrel
at
io
n
C
orrel
at
io
n
Figure 4 Selected PCNMs from the 60 PCNMs that exhibit a positive spatial correlation for the alpha and beta components of taxonomic (TD), phylogenetic (PD) and functional (FD) diversity.The selected PCNMs from forward selection analyses are represented by red circles.
Table 1 Variables retained, adjusted R-squared, and significance values from the forward-selected models examining the effect of environmental factors on alpha- and beta-level taxonomic, phylogenetic, and functional diversity.The directions of the significant relationships are depicted in brackets.
Alpha diversity Beta diversity
Taxonomic diversity
Phylogenetic diversity
Functional diversity
Taxonomic diversity
Phylogenetic diversity
Functional diversity
Mean annual temperature (+) 0.06*** (+) 0.15*** (+) 0.18*** (+) 0.35*** (+) 0.24*** (+) 0.35*** Temperature amplitude (+) 0.01* (+) 0.09*** (+) 0.03*** (+) 0.02*** (+) 0.07***
Annual precipitation (−) 0.01* (+) 0.01*** (+) 0.005*
Precipitation seasonality (−) 0.02** (+) 0.06*** (+) 0.01** (+) 0.02***
Land-use diversity index (+) 0.01**
Anthropogenic disturbance index
(−) 0.06*** (−) 0.02** (−) 0.02** (+) 0.02*** (+) 0.01** (+) 0.005*
Full-model adjustedR2 0.15 0.17 0.29 0.47 0.28 0.45
Notes. *P<0.05. **p<0.01. ***p<0.001.
environmental factors had the greatest explanatory ability (TD: 41%, PD: 24%, and FD: 39%, respectively). Environmental factors (alone, and in tandem with space) made a greater contribution to TD and FD than to PD. Overall, they explained much more beta-than alpha-level variation in TD, PD, and FD, especially in the case of TD and FD (Fig. 3). When the functional traits were examined separately (Table S3andFig. S2), it was clear that FD was shaped by individual trait responses at both the alpha and beta scales. Traits responded differently (positively or negatively) to the various environmental gradients and made different contributions to the environmental and spatial components. Indeed, the global FD pattern did not seem to be driven by any particular trait, since no single trait showed the same pattern as global FD. Furthermore, individual functional responses did not mirror TD and FD patterns at either the alpha or the beta scale. However, all the functional traits had significant phylogenetic signals (Table S4), which is evidence (albeit not definitive) for niche conservatism. The values of Pagel’sλranged from 0.78 for polydomy to 1 for diet (seeds, in particular) and foraging strategy, which demonstrates that phylogenetic signals were strong for most of the functional traits.
DISCUSSION
Although we found that ant diversity patterns in western and central Europe are determined by spatial and environmental parameters, our results also highlight a large portion of unexplained variation in alpha and beta diversity patterns. This fact suggests that other processes are at work in determining ant diversity patterns. For instance, ant diversity patterns across Europe might also be determined by stochastic mechanisms, assuming that population dynamics do not depend on environmental characteristics and are primarily driven by ecological drift and dispersal (Hubbell, 2001). Also, the omission of non-spatially structured biological or environmental variation might also account for part of the unexplained variance. For instance, it is known the role of competitive interactions in structuring ant diversity at the local scale (Cerd´a, Arnan & Retana, 2013); the fact that the portion of unexplained variance is higher for the alpha than for the beta diversity (Fig. 3), might suggest that variation in competitive interactions along the gradients might account for part of the unexplained variance in ant diversity patterns.
We also found largely support for our second hypothesis: TD, PD, and FD in ant communities demonstrated parallel responses along most of the environmental gradients in western and central Europe. Given that spatially structured environmental factors had strong effects (Fig. 1), a possible explanation is that topography-related dispersal limitations affect particular functional groups and/or lineages, and consequently, particular species. It is worth mentioning here that we found strong phylogenetic signals in the traits we examined (Table S3), which might explain why PD and FD showed highly similar responses. Once again, our results corroborated those ofMeynard et al. (2011), the only other study conducted thus far that had similar aims and a comparably large spatial scale. The authors found general support for the idea that hypotheses generated for local and regional TD can be extended to PD and FD. Conversely,Bernard-Verdier et al. (2013)observed no congruence among alpha- and beta-level TD, PD, and FD along local gradients of soil type and resource availability.Purschke et al. (2013)found similar incongruence in a plant community over the course of plant succession. A recent study that analyzed the FD of plants along a latitudinal gradient in the New World found that patterns of alpha-, beta-, and gamma-level diversity failed to match any one theory of species diversity (Lamanna et al., 2014). A global comparison of mammalian diversity found that TD, PD, and FD are somewhat related and concluded that any mismatches were attributable to environmental factors (Safi et al., 2011).
niche conservatism might vary for different environmental gradients, which might explain why patterns among the three facets of diversity differed in some gradients. However, this speculation remains outside the scope of our paper.
In our study, the most striking environmental gradient was a climate gradient, along which mean annual temperature varied: it influenced all three facets of diversity and explained much more variation than the other environmental factors. This finding highlights the role of temperature as one of the main drivers of biodiversity, which supports concerns about the effects of climate change on species distributions (Dunn et al., 2009;Jenkins et al., 2011), as well as related ecosystem services and evolutionary responses. The negative effect that anthropogenic disturbance had on all three facets of diversity at both alpha and beta scales—triggering diversity turnover—should also be underscored. Furthermore, land-use diversity affected functional turnover. These findings are noteworthy given concerns about the functional consequences of current biodiversity losses (Loreau et al., 2001), especially those mediated by human-driven changes (Foley et al., 2005); indeed, the most important driver of declining biodiversity is changes in land use (Sala et al., 2000). In accordance with our third hypothesis, FD responded to more environmental gradients than either TD or PD did. Furthermore, when all three facets of diversity significantly responded to the same environmental gradient, relatively more variation in FD was explained. However, our single-trait analyses suggest that this finding might be contingent on the trait examined. At any rate, the large contribution of environmental gradients to the multi-trait FD index seems somewhat obvious, because a species’ traits clearly determine whether it will successfully pass through an environmental filter (Pavoine & Bonsall, 2011) and consequently are the underlying force shaping functional composition. Interestingly, environmental factors explained a similar amount of beta-level variation in TD and FD, which suggests that strong environmental filtering is operating along these gradients (Mouchet et al., 2010). If species sorting is weak, we would not expect to see major changes in functional traits, i.e., we would not expect high functional turnover even if species turnover occurred. In contrast, if there is strong species sorting along environmental gradients, we would expect both species and functional turnover (Mouchet et al., 2010).
related to the abiotic environment (Arnan et al., 2013;Arnan, Cerd´a & Retana, 2014) and may therefore reflect effective local adaptation. Our results lend credence to the idea that FD is a better indicator of community assembly processes than PD (D´ıaz et al., 2007).
We also found that environmental factors had a stronger effect on TD, PD, and FD at the beta level than at the alpha level, which supports the idea that environmental filtering is stronger at the regional scale (Cornwell, Schwilk & Ackerly, 2006). Other kinds of mechanisms, such as species interactions (e.g., competition or facilitation), might have larger effects at the local scale than at the regional scale (Cavender-Bares et al., 2009;Slingsby & Verboom, 2006). Moreover, beta diversity responded more similarly to environmental gradients than did alpha diversity. This finding concurs with the results of some past work (Devictor et al., 2010;Bernard-Verdier et al., 2013), which found relatively greater congruence among different facets of beta-level vs. alpha-level diversity.
Finally, we should assume that our study might have some limitations, mainly related to the fact that the communities we used are not evenly distributed across the spatial coverage of this study, and they account for a subset of species known to occur in western and central Europe. However, our study encompasses the most comprehensive dataset on ant commu-nities in Europe. Although our commucommu-nities do not display a regular spatial distribution, they encompassed most of the range that the environmental variables take across western and central Europe; moreover, the species we found in this study are the most common species of the region. All this suggest that the results from our sampled communities are representative of the patterns of ant diversity in western and central Europe.
CONCLUSIONS
relevance for diversity patterns in general. It is clear that incorporating phylogenetic relationships and functional ecology into analyses of ecological patterns allowed us to draw stronger conclusions regarding the mechanisms that underlie macroecological patterns at different spatial scales (Webb et al., 2002;Cavender-Bares et al., 2009). There is thus a definite need to integrate the information furnished by different facets of diversity to better understand the assembly rules responsible for current global patterns of biodiversity.
ACKNOWLEDGEMENTS
We are very grateful to Alejandro Gonz´alez-Voyer and Iv´an G ´omez-Mestre for their help with the phylogeny, Bernhard Seifert and Laszlo Gall´e for providing their data on central European ant communities and Jessica Pearce-Duvet for her English editing services.
ADDITIONAL INFORMATION AND DECLARATIONS
Funding
This study was partly funded by the Spanish ‘Ministerio de Econom´ıa y Competitividad’ and FEDER (project CGL2012-36181 to XC) and the ‘Ministerio de Ciencia e Innovaci ´on’ (project Consolider MONTES, CSD 2008-00040 to JR). XA was supported by the Conselho Nacional de Desenvolvimento Cient´ıfico e Tecnol ´ogico of Brazil (CNPq PDS-167533/2013-4). The funders had no role in study design, data collection and analysis, decision to publish, or preparation of the manuscript.
Grant Disclosures
The following grant information was disclosed by the authors:
Spanish ‘Ministerio de Econom´ıa y Competitividad’ and FEDER: CGL2012-36181. Ministerio de Ciencia e Innovaci ´on: 2008-00040.
Conselho Nacional de Desenvolvimento Cient´ıfico e Tecnol ´ogico of Brazil: PDS-167533/2013-4.
Competing Interests
The authors declare there are no competing interests.
Author Contributions
• Xavier Arnan conceived and designed the experiments, performed the experiments, analyzed the data, contributed reagents/materials/analysis tools, wrote the paper, prepared figures and/or tables.
• Xim Cerd´a performed the experiments, reviewed drafts of the paper.
• Javier Retana conceived and designed the experiments, performed the experiments, reviewed drafts of the paper.
Supplemental Information
REFERENCES
Arnan X, Cerd´a X, Retana J. 2012.Distinctive life traits and distribution along environmental gradients of dominant and subordinate Mediterranean ant species.Oecologia170:489–500
DOI 10.1007/s00442-012-2315-y.
Arnan X, Cerd´a X, Rodrigo A, Retana J. 2013.Response of ant functional composition to fire.
Ecography36:1182–1192DOI 10.1111/j.1600-0587.2013.00155.x.
Arnan X, Cerd´a X, Retana J. 2014.Ant functional responses along environmental gradients.
Journal of Animal Ecology83:1398–1408DOI 10.1111/1365-2656.12227.
Bernard-Verdier M, Flores O, Navas M, Garnier E. 2013.Partitioning phylogenetic and functional diversity into alpha and beta components along an environmental gradient in a Mediterranean rangeland.Journal of Vegetation Science24:877–889DOI 10.1111/jvs.12048.
Blanchet FG, Legendre P, Borcard D. 2008.Forward selection of explanatory variables.Ecology
89:2623–2632DOI 10.1890/07-0986.1.
Borcard D, Legendre P, Avois-Jacquet P, Tuomisto H. 2004.Dissecting the spatial structure of ecological data at multiple scales.Ecology85:1826–1832DOI 10.1890/03-3111.
Borcard D, Legendre P, Drapeau P. 1992.Partialling out the spatial component of ecological variation.Ecology73:045–1055DOI 10.2307/1940179.
Bossard M, Feranec J, Otahel J. 2000.CORINE land cover technical guide—addendum 2000. Technical Report no. 40. Copenhagen: European Environment Agency.
Cadotte MW, Cavender-Bares J, Tilman D, Oakley TH. 2009.Using phylogenetic, functional and trait diversity to understand patterns of plant community productivity.PLoS ONE4:e5695
DOI 10.1371/journal.pone.0005695.
Cavender-Bares J, Kozak KH, Fine PVA, Kembel SW. 2009.The merging of community ecology and phylogenetic biology.Ecology Letters12:693–715DOI 10.1111/j.1461-0248.2009.01314.x. Cerd´a X, Arnan X, Retana J. 2013.Is competition a significant hallmark of ant (Hymenoptera:
Formicidae) ecology?Myrmecological News18:131–147.
Cooper N, Purvis A. 2010.Body size evolution in mammals: complexity in tempo and mode.
American Naturalist175:727–738DOI 10.1086/652466.
Cornwell WK, Schwilk DW, Ackerly DD. 2006.A trait-based test for habitat filtering: convex hull volume.Ecology87:1465–1471DOI 10.1890/0012-9658(2006)87[1465:ATTFHF]2.0.CO;2. De Bello F, Lavergne S, Meynard CN, Leps J, Thuiller W. 2010.The partitioning of diversity:
showing Theseus a way out of the labyrinth.Journal of Vegetation Science21:992–1000
DOI 10.1111/j.1654-1103.2010.01195.x.
Devictor V, Mouillot D, Meynard C, Jiguet F, Thuiller W, Mouquet N. 2010.Spatial mismatch and congruence between taxonomic, phylogenetic and functional diversity: the need for integrative conservation strategies in a changing world.Ecology Letters13:1030–1040
DOI 10.1111/j.1461-0248.2010.01493.x.
D´ıaz S, Lavorel S, De Bello F, Qu´etier F, Grigulis K, Robson M. 2007.Incorporating plant functional diversity effects in ecosystem service assessments.Proceedings of the National Academy of Sciences of the United States of America104:20684–20689
DOI 10.1073/pnas.0704716104.
Dray S, Legendre P, Peres-Neto PR. 2006.Spatial modeling: a comprehensive framework for principal coordinate analysis of neighbor matrices (PCNM).Ecological Modelling196:483–493
DOI 10.1016/j.ecolmodel.2006.02.015.
Lessard JP, Longino JT, Majer JD, Menke SB, McGlynn TP, Parr CL, Philpott SM, Pfeiffer M, Retana J, Suarez AV, Vasconcelos HL, Weiser MD, Sanders NJ. 2009.Climatic drivers of hemispheric asymmetry in global patterns of ant species richness.Ecology Letters12:324–333
DOI 10.1111/j.1461-0248.2009.01291.x.
Faith DP. 2008.Threatened species and the potential loss of phylogenetic diversity: conservation scenarios based on estimated extinction probabilities and phylogenetic risk analysis.
Conservation Biology22:1461–1470DOI 10.1111/j.1523-1739.2008.01068.x.
Foley JA, DeFries R, Asner GP, Barford C, Bonan G, Carpenter SR, Chapin FS, Coe MT, Daily GC, Gibbs HK, Helkowski JH, Holloway T, Howard EA, Kucharik CJ, Monfreda C, Patz JA, Prentice IC, Ramankutty N, Snyder PK. 2005.Global consequences of land-use.
Science309:570–574DOI 10.1126/science.1111772.
Forest F, Grenyer R, Rouget M, Davies TJ, Cowling RM, Faith DP, Balmford A, Manning JC, Proches¸ S, Van der Bank M, Reeves G, Hedderson TA, Savolainen V. 2007.Preserving the evolutionary potential of floras in biodiversity hotspots.Nature445:757–760
DOI 10.1038/nature05587.
Fox JW. 2013.The intermediate disturbance hypothesis should be abandoned.Trends in Ecology and Evolution28:86–92DOI 10.1016/j.tree.2012.08.014.
Gaston KJ. 1996.Biodiversity–latitudinal gradients.Progress in Physical Geography20:466–476
DOI 10.1177/030913339602000406.
Hermant M, Hennion F, Bartish I, Yguel B. 2012.Disparate relatives: life histories vary more in genera occupying intermediate environments.Perspectives in Plant Ecology, Evolution and Systematics14:283–301DOI 10.1016/j.ppees.2012.02.001.
H¨olldobler B, Wilson EO. 1990.The ants. Cambridge: Harvard University Press.
Hubbell SP. 2001.The unified neutral theory of biodiversity and biogeography. Princeton: Princeton University Press.
Jenkins CN, Sanders NJ, Andersen AN, Arnan X, Br¨uhl A, Cerd´a X, Ellison AM, Fisher BL, Fitzpatrick MC, Gotelli NJ, Gove AD, Gu´enard B, Lattke JE, Lessard JP, McGlynn TP, Menke SB, Parr CL, Philpott SM, Vasconcelos HL, Weiser MD, Dunn RR. 2011.Global diversity in light of climate change: the case of ants.Diversity and Distributions17:652–662
DOI 10.1111/j.1472-4642.2011.00770.x.
Jones MM, Tuomisto H, Brocard D, Legendre P, Clark DB, Olivas PC. 2008.Explaining variation in tropical plant community composition: influence of environment and spatial data quality.
Oecologia155:593–604DOI 10.1007/s00442-007-0923-8.
Jost L. 2007.Partitioning diversity into independent alpha and beta components.Ecology
88:2427–2439DOI 10.1890/06-1736.1.
Kraft NJB, Cornwell WK, Webb CO, Ackerly DD. 2007.Trait evolution, community assembly, and the phylogenetic structure of ecological communities.American Naturalist170:271–283
DOI 10.1086/519400.
Lamanna C, Blonder B, Violle C, Kraft NJ, Sandel B, ˇS´ımov´a I, Donoghue JC, Svenning JC, McGill BJ, Boyle B, Buzzard V, Dolins S, Jørgensen PM, Marcuse-Kubitza A,
Morueta-Holme N, Peet RK, Piel WH, Regetz J, Schildhauer M, Spencer N, Thiers B, Wiser SK, Enquist BJ. 2014.Functional trait space and the latitudinal gradient.Proceedings of the National Academy of Sciences of the United States of America 111:13745–13750
DOI 10.1073/pnas.1317722111.
Legendre P, Anderson MJ. 1999.Distance-based redundancy analysis: testing multispecies responses in multifactorial ecological experiments.Ecological Monographs 69:1–24
Legendre P, Legendre L. 1998.Numerical ecology. 2nd edition. Amsterdam: Elsevier Science. Legendre P, Mi X, Ren H, Ma K, Yu M, Sun I-F, He F. 2009.Partitioning beta diversity in a
subtropical broad-leaved forest of China.Ecology90:663–674DOI 10.1890/07-1880.1. Leith H, Whittaker RH. 1975.Primary productivity of the biosphere. New York: Springer-Verlag. Lepˇs J, De Bello F, Lavorel S, Berman S. 2006.Quantifying and interpreting functional diversity
of natural communities: practical considerations matter.Preslia78:481–501.
Loreau M, Naeem S, Inchausti P, Bengtsson J, Grime JP, Hector A, Hooper DU, Huston MA, Raffaelli D, Schmid B, Tilman D, Wardle DA. 2001.Biodiversity and ecosystem functioning: current knowledge and future challenges.Science294:804–808DOI 10.1126/science.1064088. Losos JB. 2008.Phylogenetic niche conservatism phylogenetic signal and the relationship between
phylogenetic relatedness and ecological similarity among species.Ecology Letters11:995–1003
DOI 10.1111/j.1461-0248.2008.01229.x.
Maddison WP, Maddison DR. 2014.Mesquite: a modular system for evolutionary analysis. Version 3.0.Available athttp://mesquiteproject.org.
Meynard CN, Devictor V, Mouillot D, Thuiller W, Jiguet F, Mouquet N. 2011.Beyond taxonomic diversity patterns. How doα,β andγ components of bird functional and phylogenetic diversity respond to environmental gradients across France?Global Ecology and Biogeography20:893–903DOI 10.1111/j.1466-8238.2010.00647.x.
Mezger D, Pfeiffer M. 2011.Partitioning the impact of abiotic factors and spatial patterns on species richness and community structure of ground ant assemblages in four Bornean rainforests.Ecography34:39–48DOI 10.1111/j.1600-0587.2010.06538.x.
Moreau CS, Bell CD. 2013.Testing the museum versus cradle biological diversity hypothesis: phylogeny, diversification, and ancestral biogeographic range evolution of the ants.Evolution
67:2240–2257DOI 10.1111/evo.12105.
Mouchet MA, Vill´eger S, Mason NWH, Mouillot D. 2010.Functional diversity measures: an overview of their redundancy and their ability to discriminate community assembly rules.
Functional Ecology24:867–876DOI 10.1111/j.1365-2435.2010.01695.x.
Mouquet N, Devictor V, Meynard CN, Munoz F, Bersier LF, Chave J, Couteron P,
Dalecky A, Fontaine C, Gravel D, Hardy OJ, Jabot F, Lavergne S, Leibold M, Mouillot D, M¨unkem¨uller T, Pavoine S, Prinzing A, Rodrigues AS, Rohr RP, Th´ebault E, Thuiller W. 2012. Ecophylogenetics: advances and perspectives.Biological Reviews 87:769–785
DOI 10.1111/j.1469-185X.2012.00224.x.
Pagel M. 1999.Inferring the historical patterns of biological evolution.Nature401:877–884
DOI 10.1038/44766.
Pavoine S, Bonsall MB. 2011.Measuring biodiversity to explain community assembly: a unified approach.Biological Reviews86:792–812DOI 10.1111/j.1469-185X.2010.00171.x.
Pavoine S, Dufuor AB, Chessel D. 2004.From dissimilarities among species to dissimilarities among communities: a double principal coordinate analysis.Journal of Theoretical Biology
228:523–537DOI 10.1016/j.jtbi.2004.02.014.
Pavoine S, Vela E, Gachet S, De B´elair G, Bonsall MB. 2011.Linking patterns in phylogeny, traits, abiotic variables and space: a novel approach to linking environmental filtering and plant community assembly.Journal of Ecology99:165–175DOI 10.1111/j.1365-2745.2010.01743.x. Peres-Neto PR, Legendre P, Dray S, Borcard D. 2006.Variation partitioning of species
data matrices: estimation and comparison of fractions. Ecology87:2614–2625
Petchey OL, Gaston KJ. 2006.Functional diversity: back to basics and looking forward.Ecology Letters9:741–758DOI 10.1111/j.1461-0248.2006.00924.x.
Pianka ER. 1966.Latitudinal gradients in species diversity: a review of concepts. American Naturalist100:33–46DOI 10.1086/282398.
Purschke O, Schmid BC, Sykes MT, Poschlod P, Michalski SG, Durka W, K¨uhn I, Winter M, Prentice HC. 2013.Contrasting changes in taxonomic, phylogenetic and functional diversity during a long-term succession: insights into assembly processes.Journal of Ecology101:857–866
DOI 10.1111/1365-2745.12098.
R Development Core Team. 2010.R: a language and environment for statistical computing. Vienna: R Foundation for Statistical Computing.Available athttp://www.R-project.org.
Rahbek C, Gotelli NJ, Colwell RK, Entsminger GL, Rangel FLVB, Graves GR. 2007.Predicting continental-scale patterns of bird species richness with spatially explicit models.Proceedings of the Royal Society B274:165–174DOI 10.1098/rspb.2006.3700.
Rao CR. 1982.Diversity and dissimilarity coefficients: a unified approach.Theoretical Population Biology21:24–43DOI 10.1016/0040-5809(82)90004-1.
Safi K, Cianciaruso MV, Loyola RD, Brito D, Armour-Marshall K, Diniz-Filho JAF. 2011. Understanding global patterns of mammalian functional and phylogenetic diversity.
Philosophical Transactions of the Royal Society B366:2536–2544DOI 10.1098/rstb.2011.0024. Sala OE, Chapin FS, Armesto JJ, Berlow E, Bloomfield J, Dirzo R, Huber-Sanwald E,
Huenneke LF, Jackson RB, Kinzig A, Leemans R, Lodge DM, Mooney HA, Oesterheld M, PoffNL, Sykes MT, Walker BH, Walker M, Wall DH. 2000.Global biodiversity scenarios for the year 2100.Science287:1770–1774DOI 10.1126/science.287.5459.1770.
Schelhaas M-J, Nabuurs G-J, Schuck A. 2003.Natural disturbances in the European forests in the 19th and 20th centuries.Global Change Biology9:1620–1633
DOI 10.1046/j.1365-2486.2003.00684.x.
Slingsby JA, Verboom GA. 2006.Phylogenetic relatedness limits co-occurrence at fine spatial scales: evidence from theSchoenoid sedges(Cyperaceae: Schoeneae) of the Cape Floristic Region, South Africa.American Naturalist168:14–27DOI 10.1086/505158.
Tuomisto H, Ruokolainen K, Yli-Halla M. 2003.Dispersal, environment, and floristic variation of western Amazonian forests.Science299:241–244DOI 10.1126/science.1078037.
Webb CO, Ackerly DB, McPeek MA, Donoghue MJ. 2002.Phylogenies and community ecology.
Annual Review of Ecology, Evolution and Systematics33:475–505
DOI 10.1146/annurev.ecolsys.33.010802.150448.
Weir JT, Schluter D. 2007.The latitudinal gradient in recent speciation and extinction rates of birds and mammals.Science315:1574–1576DOI 10.1126/science.1135590.
Whittaker RJ, Willis KJ, Field R. 2001.Scale and species richness: towards a general hierarchical theory of species diversity.Journal of Biogeography28:453–470
DOI 10.1046/j.1365-2699.2001.00563.x.
Willig MR, Kaufman DM, Stevens RD. 2003.Latitudinal gradients of biodiversity: pattern, process, scale, and synthesis.Annual Review of Ecology, Evolution and Systematics34:273–309
DOI 10.1146/annurev.ecolsys.34.012103.144032.
Zupan L, Cabeza M, Maiorano L, Roquet C, Devictor V, Lavergne S, Mouillot D, Mouquet N, Renaud J, Thuiller W. 2014.Spatial mismatch of phylogenetic diversity across three vertebrate groups and protected areas in Europe.Diversity and Distributions20:674–685