Lyssavirus
Seroprevalence in Spanish Bats
Jordi Serra-Cobo1,2*, Marc Lo´pez-Roig1,2, Magdalena Seguı´1, Luisa Pilar Sa´nchez3, Jacint Nadal2, Miquel Borra´s4, Rachel Lavenir5, Herve´ Bourhy5
1Centre de Recerca en Infeccions Vı´riques, Illes Balears (CRIVIB), Fundacio´ d’Investigacio´ Sanita`ria de les Illes Balears, Conselleria de Salut i Consum, Govern de les Illes Balears, Palma de Mallorca, Spain,2IRBIO and Departement de Biologia Animal, Facultat de Biologia, Universitat de Barcelona, Barcelona, Spain,3Centro Nacional de Epidemiologı´a, Instituto de Salud Carlos III, CIBERESP, Madrid, Spain,4Unitat de Toxicologia Experimental i Ecotoxicologia, Parc Cientı´fic de Barcelona, Barcelona, Spain,
5Institut Pasteur, Unite´ Dynamique desLyssaviruset Adaptation a` l’Hoˆte, Paris, France
Abstract
Bats have been proposed as major reservoirs for diverse emerging infectious viral diseases, with rabies being the best known in Europe. However, studies exploring the ecological interaction between lyssaviruses and their natural hosts are scarce. This study completes our active surveillance work on Spanish bat colonies that began in 1992. Herein, we analyzed ecological factors that might affect the infection dynamics observed in those colonies. Between 2001 and 2011, we collected and tested 2,393 blood samples and 45 dead bats from 25 localities and 20 bat species. The results for dead confirmed the presence of EBLV-1 RNA in six species analyzed (for the first time inMyotis capaccinii). Samples positive for European bat lyssavirus-1 (EBLV-1)–neutralizing antibodies were detected in 68% of the localities sampled and in 13 bat species, seven of which were found for the first time (even inMyotis daubentonii, a species to date always linked to EBLV-2). EBLV-1 seroprevalence (20.7%) ranged between 11.1 and 40.2% among bat species and seasonal variation was observed, with significantly higher antibody prevalence in summer (July). EBLV-1 seroprevalence was significantly associated with colony size and species richness. Higher seroprevalence percentages were found in large multispecific colonies, suggesting that intra- and interspecific contacts are major risk factors for EBLV-1 transmission in bat colonies. Although bat-roosting behavior strongly determines EBLV-1 variability, we also found some evidence that bat phylogeny might be involved in bat-species seroprevalence. The results of this study highlight the importance of life history and roost ecology in understanding EBLV-1–prevalence patterns in bat colonies and also provide useful information for public health officials.
Citation:Serra-Cobo J, Lo´pez-Roig M, Seguı´ M, Sa´nchez LP, Nadal J, et al. (2013) Ecological Factors Associated with European BatLyssavirusSeroprevalence in Spanish Bats. PLoS ONE 8(5): e64467. doi:10.1371/journal.pone.0064467
Editor:Michelle L. Baker, CSIRO, Australia
ReceivedSeptember 18, 2012;AcceptedApril 16, 2013;PublishedMay 20, 2013
This is an open-access article, free of all copyright, and may be freely reproduced, distributed, transmitted, modified, built upon, or otherwise used by anyone for any lawful purpose. The work is made available under the Creative Commons CC0 public domain dedication.
Funding:This work was financed by the Conselleria de Salut, FamA˜-lia i Benestar Social, Govern de les Illes Balears (PI 32/2009), the Researchers Stabilization Program and Technical Support Research, and Intensification of Research Activity in the National Health System of the Ministry of Health (Instituto de Salud Carlos III), Instituto de Salud Carlos III (EMER 07/051), RABMEDCONTROL UE project No. 517727, and PREDEMICS UE project No. 278433. The funders had no role in study design, data collection and analysis, decision to publish, or preparation of the manuscript.
Competing Interests:The authors have declared that no competing interests exist.
* E-mail: [email protected]
Introduction
High species diversity (about 1,150 in the world), worldwide distribution, high mobility and the fact that they represent a continuing source of emerging infections for humans make bats one of the most epidemiologically relevant groups of mammals to study disease ecology. Indeed, bats were shown to be involved in several emergent viral diseases (Coronaviruses, Flaviviruses, Astroviruses, and Adenoviruses etc.), with rabies being one of them [1],[2]. Numerous bat species have been found to be infected by lyssaviruses [3] and bats serve as the reservoirs of 10 of the 11 Lyssavirus species described, suggesting that the lyssaviruses originated in these mammals and progressively diverged from a common ancestor [4],[5]. Two new recently described tentative of the three novel Lyssavirus species further enlarged the genetic diversity of lyssaviruses found in bats [6–8]. In Europe, two Lyssavirusspecies, European batLyssavirusTypes 1 and 2 (EBLV-1 and EBLV-2, respectively), and one tentative species, Bokeloh bat lyssavirus, circulate among several bat species [7]. EBLV-1 is widely distributed throughout Europe and two variants have
distinct distributions and evolutionary histories: one is EBLV-1a, which has an east–west distribution from Russia to France, with very little genetic variation; and the other is EBLV-1b, which exhibits a south–north distribution and far more genetic diversity [9].
The firstLyssavirusinfections in European bats were diagnosed in 1954 in Serbia–Montenegro [10] and Germany [11]. The number of positive cases increased considerably from 1985, when several European countries began routine passive surveillance. From 1977 to 2012, 1033 bats were found to be infected with lyssaviruses in Europe (http://www.who-rabies-bulletin.org). The substantial number of positive bats diagnosed, the number of European countries affected and, above all, the finding that EBLV-1 and EBLV-2 can cross the species barrier to infect other domestic and wild non-flying mammals and humans raised public health issues related to these and other viruses [12],[13].
that several other bat species has serological evidence of previous infection. The role of these species in EBLV-1 epidemiology, particularly Lyssavirus cross-species-infection dynamics, remains unknown. Given the fact thatE. serotinus is a non-migratory bat [15], it is possible that migratory species may have a more important role in the dispersion [16],[17] and distribution of the different EBLV-1 genetic variants. With the aim of understanding more about the role of the different bat species in EBLV-1 dynamics and identifying ecological factors that might favor EBLV-1 transmission and, consequently, serological responses to infection in bat colonies, active surveillance of bat colonies in Spain was implemented in 1992. In this study, we analyzed ecological and epidemiological factors that might be associated with the infection dynamics observed in colonies where we previously detected EBLV-1 infection [17–19], and completed with data collected during 2001–2010.
Materials and Methods Ethics Statement
All animals were handled in strict accordance with good animal practices, as defined by current European legislation. Bat capture and blood-sampling were authorized by permit from the Spanish Regional Committee for Scientific Capture.
Sample Collection
From 2001 through 2010, bats were collected from 25 localities in three autonomous Regions: Aragon, Balearic Islands and Catalonia (Figure 1). Localities were selected on the basis of bat-behavior criteria: synanthropic (urban areas), migratory and gregarious species. Bat colonies were sampled throughout the year, avoiding hibernation (from mid-December to the end of February) and the birthing periods (from mid-June to mid-July).
Insectivorous bats were captured inside the roosts with long-handled butterfly nets during the day or with mist nets at sunset, when they emerged to forage. The latter nets were used only when access to the roost interior was not possible. Thick leather gloves were worn when bats were handled and transferred into individual cotton pouches for transportation and processing.
All bats were identified to species, based on the identification key to the bats of Europe [20]. Individuals were sexed and aged as juveniles or adults based on the degree of epiphyseal fusion [21]. Reproductive status of adult females was classified as pregnant or lactating, based on palpation of the abdomen and nipple condition [22]. For future long-term studies on population dynamics only in some localities, bats were banded with a uniquely coded alloy ring (Porzana Limited, East Sussex, UK) on the forearm.
Bat Sampling
Bats were arbitrarily captured and blood was drawn for analyses. Bats identified as juveniles were not analyzed in this study. However, some individuals, whose age category was difficult to determine precisely according to the criterion applied, were included in the statistical analysis. Blood samples (0.1–0.5 mL, depending on the bat’s size) were obtained by a small puncture made in median artery. Pressure with a sterile towel was applied to the wound until the bleeding stopped and a sterile absorbent hemostatic sponge impregnated with gelatin was place on the site to prevent bleeding and facilitate healing, and the bat was released. The bats were offered 10% glucose–water orally to prevent dehydration and provide rapidly assimilated compounds for energy. Vials containing blood were stored at 4uC for a few hours. Samples were centrifuged for 20 minutes at 12,000 rpm, and the serum was extracted with a micropipette. Serum samples
and clot pellets were frozen at220uC and –80uC respectively, before analysis. The 45 carcasses analyzed during the study were dead bats found during fieldwork or those that died during handling. The bats were not further discriminated into subgroups based upon whether they were found dead or died during processing, with the latter deaths probably being attributable to cardiomyopathy or other stress; none exhibited any symptoms associated with rabies. Independently of blood samples, brain, pharynx–esophagus, larynx, lung, heart and tongue samples were collected aseptically from dead bats in the laboratory and stored at –80uC.
Detection of EBLV-1 Neutralizing Antibodies
The technique used to detect EBLV-1 neutralizing antibodies is an adaptation of the Rapid Fluorescent Focus Inhibition Test (RFFIT) [17],[23]. A constant dose of a titrated (calibrated to give 80% fluorescent foci (infected cells)), cell-culture–adapted, EBLV-1 challenge virus (89EBLV-18 FRA) was incubated with 3-fold dilutions of the sera to be titered. After incubation of the serum–virus mixtures, a suspension of BSR cells was added. Twenty-four hours later, the cell monolayer was acetone-fixed and labeled with a fluoresceinated anti-nucleocapsid antibody (BioRad, Marnes-la-Coquette, France) to detect the presence of non-neutralized virus (fluorescent foci). The optimal challenge dose (the dilution giving 80% infected cells for each virus production) is calculated. Further, titers are expressed as the arithmetic means of two independent Figure 1. Map of the Iberian Peninsula showing the localities sampled.(A) Bat-sampling locations in Spain, 1992–2010. (B) Expanded area showing the localities sampled for this study. Red circles indicate localities where seropositive bats or individuals with EBLV-1 RNA were found, and black circles indicate seronegative localities sampled. Black triangles indicate previously sampled localities [17]. Stars indicate bibliographic cases of EBLV-1 infection [17],[31–36].
repetitions. Samples were considered positive when the number of fluorescent foci was reduced by 50% at the 1:27 dilution (starting dilution). This cut-off value is similar to that applied in other studies [17],[19],[24].
Detection of EBLV-1 RNA
Total RNA was extracted from individual blood clots and organs, and tested by nested real-time polymerase chain reaction (nRT-PCR) [17].
RNA was extracted in a P3 laboratory. Then, template preparation, RT-PCR mix preparation and DNA addition to the mix were done using aerosol-resistant tips in two distinct rooms. In all these procedures, negative controls were performed individually for each step (extraction, reverse transcription, first and second PCR) and were negative. In addition, RNA extracted omitting reverse transcriptase was also subjected to nRT-PCR to serve as controls. A 394-bp amplicon of the nucleoprotein gene was obtained with primers N41 and N60. The second PCR amplicon (N62–N63) was 161-bp. The Sanger method was used to sequence the PCR products, which were analyzed with Sequencher 10.1 software. The 161-bp sequences obtained by the second PCR with the N62–N63 primer set were compared. They were blasted against Genbank.
Statistical Analyses
In an attempt to identify ecological factors associated with EBLV-1–antibodies prevalence, we analyzed the probability of being ELBV-1–seropositive as a function of five explanatory variables: taxon, month, sex, colony size and species richness. In this statistical analyses we only consider the months included, from April to October, period during which the bats are more active and occur higher infection rates [25],[26]. The taxon variable included four families of bats sampled in Europe (Rhinolophidae, Vespertilionidae,MiniopteridaeandMolossidae) [27].
The colony size was estimated at each sampling time and for each species found in the roost from direct census conducted inside the refuge or when bats had left the roost to forage at night. Because accurate colony-size estimates were only available for some localities, we categorized the colony-size variable as small, medium or large. We considered colonies not exceeding 100 individuals small, those harboring 100–500 individuals medium and those home to$ 500 individuals large. For each sampling time, we also calculated the number of species (species-richness variable) present in the refuge that form clusters, independently of whether the species were sheltering separately or in proximity to other species. Solitary individuals, mostly of theRhinolophusgenus, were not considered in species richness. Sibling species, such as Myotis myotis and Myotis blythii, and Pipistrellus pipistrellus and Pipistrellus pygmaeus, were assimilated to form two groups due to the difficulty of identifying them when they were not captured. We also categorized the species richness as 1, 2 or$3 species.
Prior to the analysis, we checked for potential collinearity by using the variance-inflation factors (VIF) from a standard linear model, excluding the random effect to assess the absence of multicollinearity among the explanatory variables selected. Because all VIF values were,2, we considered that collinearity was not a serious issue for this data set [28].
We used a generalized linear-mixed model and assumed a binomial distribution to investigate the relationships among EBLV-1 seroprevalence and the five explanatory variables. The 74 distinct sampling times were distributed over 16 localities and 10 years (Table S1 in File S1). We did not take in consideration of those localities with the small numbers of captured bats (fewer than 7 individuals). We excluded also five individuals of undetermined
sex. For this analysis, we used 2,144 sera from 12 bat species. To control for variability due to several sampling times among years and localities, the corresponding variables were included as random effects in the models. We also excluded the few bats captured more than once within the same month.
We used an information–theoretic procedure and the Akaike information criterion corrected for small sample sizes (AICc) to compare models [29]. We generated a set of different models that consisted of all combinations of the five explanatory variables. All the models considered for the analysis included the fixed additive effects of the five explanatory variables and the random effects of year and site. For each modeli, we computed the Akaike weight (wi), which can be interpreted as the likelihood that modeliis the
best model within the set in terms of trade-offs between data fit and parsimony. For each independent explanatory variables, we calculated the sum of Akaike weights (gwi), computed for these 16
models in the set including that variable [30]. Finally, we created other models from the best model selected in the previous set that incorporated biological interactions among the explanatory variables and the random-effect terms. Odds ratios and their 95% confidence intervals were computed for the explanatory variables of the resulting model.
All analyses were conducted using the R package version 2.14.2 [31]. Models were run with the ‘glmer’ function in ‘lme4’, using the Laplace approximation of the maximum-likelihood and a logit link function. VIF were calculated using the function ‘‘vif’’ from the R package ‘car’ [28], and likelihood ratio tests between models were calculated using the R-function ‘anova’. McNemar’s test was calculated using the ‘‘mcnemar.test’’ function from the R package to investigate significant differences between ELBV-1–seropositiv-ity and taxon (different families).
Results
Serological Analysis
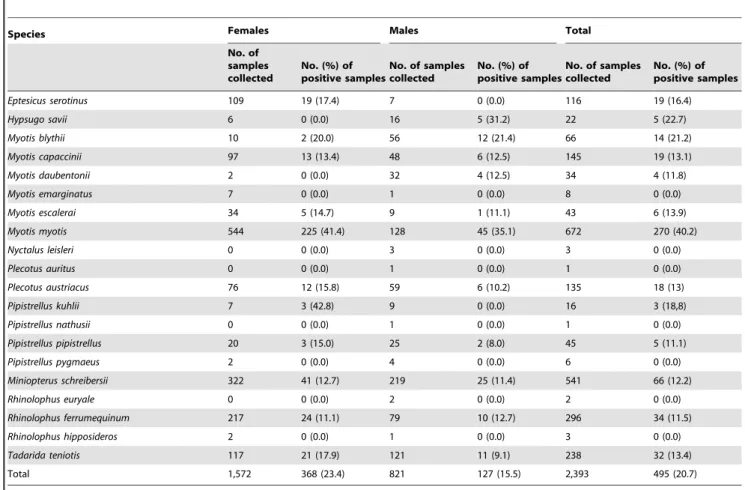
Among the 2,393 sera obtained, 495 (20.7%) were positive for EBLV-1–neutralizing antibodies. Among the 25 different Spanish localities, 17 (68%) harbored positive bats (one in Aragon, seven in the Balearic Islands and nine in Catalonia) (Figure 1) [17],[32–37]. Fifteen of the 25 localities were sampled for the first time. Highly variable EBLV-1 seroprevalences were observed (3–37%) among localities. EBLV-1–neutralizing antibodies were detected in 13 (65%) of the 20 species analyzed and showed broad variations among bat species (11.1–40.2%) (Table 1), representing the first time that EBLV-1–neutralizing antibodies were detected in P. pipistrellus, Pipistrellus kuhlii, Hypsugo savii, Myotis daubentonii, Myotis escalerai,Myotis capacciniiandPlecotus austriacus.
EBLV-1–RNA Analysis
Among the 45 dead bats from seven species analyzed, 12 (27%) were positive by nRT-PCR (Table 2), and EBLV-1 RNA was detected in six species analyzed (Rhinolophus ferrumequinum, M. myotis,P. pipistrellus,Miniopterus schreibersii, Tadarida teniotisand, for the first time,M. capaccinii) (Table 3) [7],[14],[34],[38–43].
indicating a close relationship between all these isolates and the previously identified EBLV-1b Spanish isolates. A NJ phylogenetic tree was built using a 122-nucleotide long sequence obtained from the blood clots (Figure S1 in File S1).
Ecological Factors Associated with EBLV-1–Antibodies Prevalence
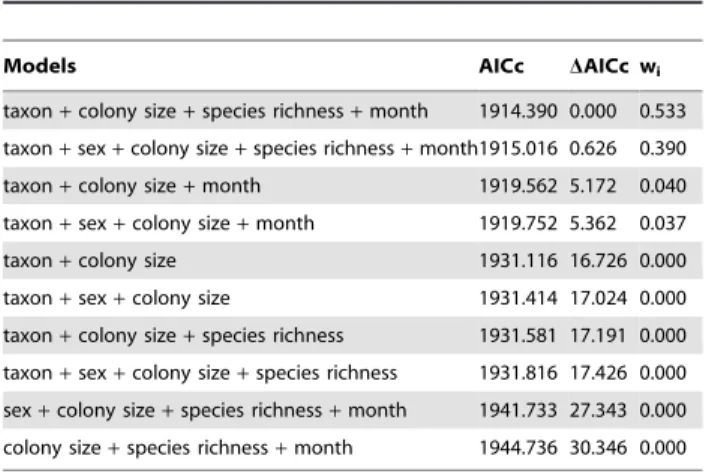
The best model indicated that four of the five explanatory variables contributed to explaining the variation of EBLV-1 seroprevalence (Table 4). These four variables (taxon, month, colony size and species richness) had high Akaike importance weights (gwi . 0.92) and were included in all high ranking Table 1.Serological results of EBLV-1 neutralizing antibodies analyses in Spanish bats (2001 – 2010).
Species Females Males Total
No. of samples collected
No. (%) of positive samples
No. of samples collected
No. (%) of positive samples
No. of samples collected
No. (%) of positive samples
Eptesicus serotinus 109 19 (17.4) 7 0 (0.0) 116 19 (16.4)
Hypsugo savii 6 0 (0.0) 16 5 (31.2) 22 5 (22.7)
Myotis blythii 10 2 (20.0) 56 12 (21.4) 66 14 (21.2)
Myotis capaccinii 97 13 (13.4) 48 6 (12.5) 145 19 (13.1)
Myotis daubentonii 2 0 (0.0) 32 4 (12.5) 34 4 (11.8)
Myotis emarginatus 7 0 (0.0) 1 0 (0.0) 8 0 (0.0)
Myotis escalerai 34 5 (14.7) 9 1 (11.1) 43 6 (13.9)
Myotis myotis 544 225 (41.4) 128 45 (35.1) 672 270 (40.2)
Nyctalus leisleri 0 0 (0.0) 3 0 (0.0) 3 0 (0.0)
Plecotus auritus 0 0 (0.0) 1 0 (0.0) 1 0 (0.0)
Plecotus austriacus 76 12 (15.8) 59 6 (10.2) 135 18 (13)
Pipistrellus kuhlii 7 3 (42.8) 9 0 (0.0) 16 3 (18,8)
Pipistrellus nathusii 0 0 (0.0) 1 0 (0.0) 1 0 (0.0)
Pipistrellus pipistrellus 20 3 (15.0) 25 2 (8.0) 45 5 (11.1)
Pipistrellus pygmaeus 2 0 (0.0) 4 0 (0.0) 6 0 (0.0)
Miniopterus schreibersii 322 41 (12.7) 219 25 (11.4) 541 66 (12.2)
Rhinolophus euryale 0 0 (0.0) 2 0 (0.0) 2 0 (0.0)
Rhinolophus ferrumequinum 217 24 (11.1) 79 10 (12.7) 296 34 (11.5)
Rhinolophus hipposideros 2 0 (0.0) 1 0 (0.0) 3 0 (0.0)
Tadarida teniotis 117 21 (17.9) 121 11 (9.1) 238 32 (13.4)
Total 1,572 368 (23.4) 821 127 (15.5) 2,393 495 (20.7)
doi:10.1371/journal.pone.0064467.t001
Table 2.EBLV-1 RNA results in Spanish bats (2001 – 2010).
Species Clots Organs Type of organs
No. of clots collected
No. (%) of positive
clots No. of bats collected
No. (%) of positive
bats B Ph-E L H T
M. capaccinii 73 0 (0.0) 6 1 (16.7) + 2 2 2 2
M. myotis 557 15 (2.7) 5 1 (20.0) + 2 2 + +
P. austriacus 101 1 (1.0) nd nd
P. pipistrellus 40 1 (2.5) 3 1 (33.3) 2 2 + 2 +
M. schreibersii* 376 3 (0.8) 17 3 (17.6) + + 2 2 2
R. ferrumequinum{ 233 18 (7.7) 10 5 (50.0) + + + + +
T. teniotis 154 5 (3.2) 3 1 (33.3) 2 + 2 2 2
Total 1,823 43 (2.4) 45 12 (26.7)
B, Brain. E-Ph, Pharynx-Esophagus. L, Lung. H, Heart. T, Tongue. nd, not done. *details of the individuals positives for each organ: B(1), E-Ph(1), B/E-Ph(1).
{details of the individuals positives for each organ: B(2), E-Ph(1), B/E-Ph(1), B/L/T(1).
models. The two best-fitting models (DAICc,2) explained .90% of the seroprevalence variability observed and both included these four variables. Inclusion of the variable sex (gwi= 0.43) produced an equally valid model (x2= 2.18, df = 1,
p = 0.14) but fit the data less well. Although the model with one interaction was a little better, we retained the first model without interaction to explain the EBLV-1–seroprevalence variation because it did not differ significantly from the former and it was more parsimonious.
The results obtained with the best model indicated that EBLV-1 seroprevalence varied widely among months, with July having highest seroprevalence. Seroprevalence also differed among the taxon, with theVespertilionidaefamily having the highest EBLV-1 seroprevalence, compared to other families, that was significantly higher than those of Rhinolophidae and Molossidae families (McNemar test, p,0.001 for both).
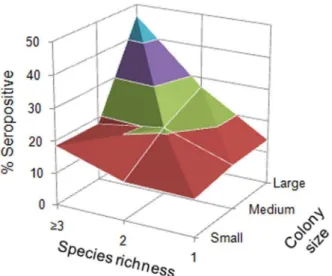
The estimatedb-coefficients indicated that seroprevalence was positively associated with colony size. EBLV-1 seroprevalence was significantly higher in medium and large colonies than small colonies (Figure 2, Table 5). Bats living in medium (ORs = 1.96) or large colonies (ORs = 4.50) had, respectively, nearly two and more than four times greater probability of being seropositive than bats roosted in small colonies. Seroprevalence also increased with the species richness present in the colony but was significantly higher only when the colonies were constituted of three or more
species (b= 0.88, p,0.001). In these cases, bats had more twice higher probability of being seropositive (ORs = 2.42) than in monospecific colonies.
Table 4.Summary of the ten first models and two
best-supported models (DAICc,2) fitted to estimate variations in
EBLV-1 prevalence in bats. In bold the best model selected.
Models AICc DAICc wi
taxon+colony size+species richness+month 1914.390 0.000 0.533
taxon+sex+colony size+species richness+month1915.016 0.626 0.390
taxon+colony size+month 1919.562 5.172 0.040
taxon+sex+colony size+month 1919.752 5.362 0.037
taxon+colony size 1931.116 16.726 0.000
taxon+sex+colony size 1931.414 17.024 0.000
taxon+colony size+species richness 1931.581 17.191 0.000
taxon+sex+colony size+species richness 1931.816 17.426 0.000
sex+colony size+species richness+month 1941.733 27.343 0.000
colony size+species richness+month 1944.736 30.346 0.000
doi:10.1371/journal.pone.0064467.t004
Table 3.Families and genera of European bat species whereLyssavirusinfection has been reported (period 1954 – 2011).
Family Species Lyssavirus RNA Country Antibodies Country
Miniopteridae Miniopterus schreibersii EBLV-1 E EBLV-1 E,F
Miniopterus schreibersii WCBLV R nd nd
Vespertilionidae Eptesicus serotinus EBLV-1 CZ,G,DK,E,F,HU,NL,PL,U,A EBLV-1 E,UK,F
Eptesicus isabellinus EBLV-1 E EBLV-1 E
Barbastella barbastellus EBLV-1 G EBLV-1 F
Myotis capaccinii EBLV-1 E EBLV-1 E
Myotis dasycneme EBLV-1 NL nd nd
Myotis dasycneme EBLV-2 DK,NL nd nd
Myotis daubentonii EBLV-1 nd EBLV-1 E
Myotis daubentonii EBLV-2 CH,UK,F,I EBLV-2 CH,UK
Myotis blythii nd nd EBLV-1 E,F
Myotis myotis EBLV-1 G,E EBLV-1 B,E,F
Myotis escalerai EBLV-1 E EBLV-1 E
Myotis nattereri nd nd EBLV-1 B
Myotis nattereri BBLV G nd nd
Nyctalus noctula EBLV-1 G nd nd
Pipistrellus kuhlii nd nd EBLV-1 E
Pipistrellus nathusii EBLV-1 G nd nd
Pipistrellus pipistrellus EBLV-1 G,E,F EBLV-1 E
Hypsugo savii nd nd EBLV-1 E
Plecotus austriacus EBLV-1 E EBLV-1 E
Plecotus auritus EBLV-1 B,G nd nd
Verpertilio murinus EBLV-1 UA nd nd
Rhinolophidae Rhinolophus ferrumequinum EBLV-1 E,TR EBLV-1 E,F
Molossidae Tadaridas teniotis EBLV-1 E EBLV-1 E
nd, not done. EBLV,European Bat Lyssavirus. WCBLV,West Caucasian Bat Lyssavirus. BBLV,Bokeloh bat Lyssavirus. B, Belgium. CH, Switzerland. CZ, Czech Republic. G, Germany. DK, Denmark. E, Spain. F, France. FI, Finland. HU, Hungary. NL, Nederland. PL, Poland. R, Russia. UA, Ukraine. TR, Turkey. [7],[14],[33–44].
Discussion
We completed our active surveillance of Spanish bat colonies that began in 1992 [17] and this analysis extends our knowledge of EBLV-1 infection in bats. Herein, we report the detection of specific EBLV-1–neutralizing antibodies in seven bat species and a considerably higher number of species exposed to Lyssavirus in Europe than previously described (Table 3). The high percentage (65%) of seropositive species found suggests that most Spanish species of bats can be exposed to EBLV-1 (Table 1). Even EBLV-1 neutralizing antibodies were identified inM. daubentonii, a species so far linked only to EBLV-2 infection in more northern parts of Europe [40],[42],[44] (Table 3). Furthermore, evidence of EBLV-1 infection was found in 68% of the bat colonies sampled. These findings are in agreement with a wide geographic distribution of EBLV-1 infection of bats in the Spanish Mediterranean region [17],[35–37] (Figure 1).
Our results indicate that EBLV-1–seroprevalence varies among bats at a national scale were associated with several ecological factors operating at species and community levels, including breeding period, taxonomic family, colony size, and species richness in the colony. Our results showed that EBLV-1 seroprevalence varied broadly among the bat species and localities sampled. Previous studies demonstrated that bat Lyssavirus dynamics exhibited a strong seasonal pattern [25] and that the breeding period could favor bat infection [26]. This seasonal variability was also detected by our model, which indicated significantly higher EBLV-1 seroprevalence in summer (July), when maternity colonies are present in most of the localities. The model that includes the variable sex was not better than the best model (without sex), suggesting that sex-ratio changes observed during the year did not influence EBLV-1 seroprevalence.
EBLV-1–seroprevalence differences were also found among bat families. This variability might be explained by different suscep-tibilities to infection or immunological responses of the bat species to EBLV-1 virus. For example, we observed important differences between two species from two families: R. ferrumequinum had the highest percentage of positive clots and organs compared to other species, e.g., M. myotis, while the percentage of seropositive R. ferrumequinumwas much lower than that of M. myotis. Our results
are less in favor of the hypothesis of the difference in susceptibility becauseR. ferrumequinumbats were infected (nRT-PCR–positive in this study). These differences might rather suggest different seroconversion rates in these two species. In this sense, Turmelle et al. [45] reported that significant differences in seroconversion probabilities were found among bats depending on whether they had previously been infected, suggesting that long-term repeated infections of bats might confer significant immunological memory and reduced susceptibility to rabies infection. Immune compe-tence in bats can vary with body condition (via nutritional status and stress) and reproductive activity and, as a consequence, can lead to a lower rabies seroprevalence between or within bat species [26],[46],[47].
Determining whether these differences are a consequence of ecological, immunological or phylogenetic factors is very difficult. Perhaps the phylogenetic distance between theRhinolophidaeand Vespertilionidaecontributes to these differences [27], as was shown in studies on Coronavirus in bats [48]. However, further studies are needed to investigate this hypothesis.
Our analyses revealed that the colony size and species richness it harbored were two important ecological factors and showed their relevant roles in seroprevalence variability. Notably, EBLV-1 seroprevalence and the colony size, especially large colonies, had a strong positive association. Previous studies suggested that larger colony size could also raise host density and simultaneously favor Figure 2. Variations of the percentages of seropositive bats as
a function of the species richness and colony size.Seropositive rates are as follows: Red, 10–20%; green, 20–30%, purple, 30–40%; blue, 40–50%.
doi:10.1371/journal.pone.0064467.g002
Table 5.Parameter estimates (logit scale) from the best model on the seroprevalence of EBLV-1.
Explanatory
variables b error
odds-ratio 95 CI z-value p
intercept 24.310 0.667 26.463 ,0.001
taxon
Rhinolophidae*
Vespertilionidae 0.992 0.307 2.696 1.475–4.927 3.225 0.001
Miniopteridae 0.129 0.322 1.138 0.606–2.138 0.403 0.687
Molossidae 20.158 0.394 0.853 0.394–1.847 20.402 0.687 months
April*
May 0.612 0.504 1.844 0.686–4.952 1.215 0.224
June 0.791 0.515 2.205 0.804–6.048 1.537 0.124
July 1.499 0.517 4.480 1.625–12.347 2.899 0.004
August 0.519 0.530 1.681 0.594–4.753 0.980 0.327
September 1.118 0.692 3.059 0.788–11.878 1.615 0.106
October 0.449 0.573 1.567 0.509–4.816 0.784 0.433
species richness
1 species*
2 species 0.149 0.227 1.160 0.744–1.809 0.657 0.511
$3 species 0.883 0.234 2.419 1.527–3.831 3.767 ,0.001
colony size
Small*
medium 0.674 0.214 1.962 1.289–2.896 3.146 0.002
large 1.506 0.209 4.501 2.994–6.786 7.214 ,0.001
random effects s2 error
locality 0.000 0.000
year 1.344 1.159
*Reference.
contact rates between individuals and, hence, the probability of infection spread [49–51]. However, colony size alone could not explain all the variability observed, especially when the colonies were comprised principally of one species, suggesting that other factors might be involved in bat seroprevalence. In this sense, Streicker et al. [52] showed that rabies virus (RABV) seroprev-alence in common vampire bats was independent of bat-colony size. The absence of a relationship between RABV seroprevalence and colony size in that study could be explained by Desmodus rotundus generally forming small- or medium-sized monospecific colonies. Our results suggested that EBLV-1 seroprevalence was strongly affected by the colony size and species richness, and indicated that multispecies, large colonies, especially those with three or more different bat species, had a higher probability of EBLV-1 infection (Figure 2). Large colonies and multispecies associations occurred frequently among cave-dwelling bats, principally during the maternity period. This colonial behavior confers thermodynamic and social advantages to reproductive females during pregnancy and lactation [53]. Higher seropreva-lence was observed in multispecies colonies compared to monospecific colonies, suggesting that interspecific virus transmis-sion plays an important role in EBLV-1 dynamics. A higher number of species might not only increase the rates of contact between bat groups but could also facilitate virus entry or spread through the higher mobility of individuals among colonies, especially if there are migratory species.
Cross et al [54] showed that the probability of a pandemic event depended on the interaction between colony size and movement of hosts among groups during their infectious lifetime. They suggested that large groups and frequent movements were more heavily impacted by acute diseases than hosts with small groups and infrequent movement. This could explain the high EBLV-1 seroprevalence observed in large multispecific colonies comprising M. schreibersii and, sometimes, M. capaccinii, both species being considered regionally migratory [15]. Indeed, these species migrate seasonally a few hundred kilometers [55],[56], and even between Balearic Islands [19]. This migratory behavior can be important for EBLV-1 dispersion within colonies or among localities at local and regional scales [17].
The results obtained since 1992 showed that M. myotis is an important species for epidemiological studies of lyssaviruses [17],[19],[35]. Its wide geographical distribution in Europe, high
percentage (40.2%) of seropositive individuals, long lifespan of Lyssavirus neutralizing antibodies [19] and that it almost always forms multispecific colonies, principally with migratory species, makeM. myotisa good sentinel species (Table 1).
The ability of bats to occupy man-made structures is of particular importance to public health, because it can increase the probability of contact with domestic animals and humans. However, all synanthropic colonies found during our active surveillance were monospecific. P. pipistrellus, one of the most abundant species in southern Europe, has strong synanthropic behavior. In accordance with our results, this species might be less exposed to lyssavirus than cave-dwelling bats because it colonizes buildings and its colonies are often monospecific, small, highly philopatric. These observations could be indicative of a low public health risk associated withP. pipistrellus.
The integration of wildlife ecology, behavior and disease dynamics is a relatively new area of research. This approach illustrates the pertinent contribution of integrating ecology and epidemiology to enhancing our understanding of complex multi-host epidemiological systems for bat lyssaviruses. The results provide a number of novel insights and improve our knowledge of batLyssavirusdynamics.
Supporting Information
Figure S1 NJ phylogenetic tree using 122-nucleotide long sequence obtained from the blood clots.
(DOC)
Table S1 Details of the total 74 sampling events yielding 2144 of sera samples from 2001 to 2010.
(DOC)
Acknowledgments
The authors wish to thank Dr Sergi Vives, Departament Estadı´stica Facultat de Biologia, University of Barcelona, for his mathematical support. We thank Xavier Bayer for sharing his team’s fieldwork.
Author Contributions
Conceived and designed the experiments: JS-C. Performed the experi-ments: JS-C ML-R HB. Analyzed the data: JS-C ML-R HB MS RL. Wrote the paper: JS-C ML-R HB LS JN MB.
References
1. Calisher CH, Childs JE, Field HE, Holmes KV, Schountz T (2006) Bats: important reservoir hosts of emerging viruses. Clin Microbiol Rev 19: 531–545. 2. Drexler JF, Corman VM, Wegner T, Fumie A, Melin R, et al. (2011) Amplification of emerging viruses in a bat colony. Emerg Infect Dis 17: 449– 456.
3. Kuzmin IV, Bozick B, Guagliardo SA, Kunkel R, Shak JR, et al. (2011) Bats, emerging infectious diseases, and the rabies paradigm revisited. Emerg Health Threats J 4: 7159–7176.
4. Badrane H, Tordo N (2001) Host switching in Lyssavirus history from the Chiroptera to the Carnivora orders. J Virol 75: 8096–8104.
5. Delmas O, Holmes EC, Talbi C, Larrous F, Dacheux L, et al. (2008) Genomic diversity and evolution of the lyssaviruses. PLoS One 3: e2057.
6. Kuzmin IV, Mayer AE, Niezgoda M, Markotter W, Agwanda B, et al. (2010)
Shimoni bat virus,a new representative of theLyssavirusgenus. Virus Res 149: 197– 210.
7. Freuling CM, Beer M, Conraths FJ, Finke S, Hoffmann B, et al. (2011) Novel
Lyssavirusin Natterer’s Bat, Germany. Emerg Infect Dis 17: 1519–1522. 8. Marston DA, Horton DL, Ngeleja C, Hampson K, McElhinneyet LM, et al.
(2012) Ikoma Lyssavirus, Highly Divergent Novel Lyssavirus in an African Civet. Emerg Infect Dis 18: 664-667.
9. Davis P, Holmes EC, Larrous F, Van der Poel WHM, Tj rneh j K, et al. (2005) Phylogeography, population dynamics, and molecular evolution of European bat lyssaviruses. J Virol 79: 10487–10497.
10. Nikolic M, Jelesic Z (1956) Isolation of rabies virus from insectivorous bats in Yugoslavia. WHO Bull 14: 801–804.
11. Mohr W (1957) Die Tollwut. Med Klin 52: 1057–1060.
12. Wong S, Lan S, Wo P, Yuen K-Y (2007) Bats as a continuing source of emerging infections in humans. Rev Med Virol 17: 67–91.
13. Dacheux L, Larrous F, Mailles A, Boisseleau D, Delmas O, et al. (2009) European batLyssavirustransmission among cats, Europe. Emerg Infect Dis 15: 280–284.
14. Muller T, Johnson N, Freuling CM, Fooks AR, Selhorst T, et al. (2007) Epidemiology of bat rabies in Germany. Arch Virol 152: 273–288.
15. Hutterer R, Ivanova T, Meyer-Cords C, Rodrigues L (2005) Bat migrations in Europe. Bonn: Federal Agency for Nature Conservation. 180 p.
16. Brosset A (1990) Les migrations de la pipistrelle de Nathusius,Pipistrellus nathusii, en France. Ses incidences possibles sur la propagation de la rage. Mammalia 54: 207–212.
17. Serra-Cobo J, Amengual B, Abella´n C, Bourhy H (2002) European batLyssavirus
infection in Spanish bat populations. Emerg Infect Dis 8: 413–420.
18. Serra-Cobo J, Bourhy H, Lo´pez-Roig M, Sa´nchez LP, Abella´n C, et al. (2008) La rabia en murcie´lagos: circulacio´n de EBLV-1 (Lyssavirus de murcie´lagos europeos tipo 1) en murcie´lagos de Espan˜a. Bol Epidem 16: 169–180. 19. Amengual B, Bourhy H, Lo´pez-Roig M, Serra-Cobo J (2007) Temporal
dynamics of European batLyssavirustype 1 and survival ofMyotis myotisbats in natural colonies. PLoS One 2: e566.
21. Racey PA (1974) Ageing and assessment of reproductive status of pipistrelle bats,
Pipistrellus pipistrellus. J Zool 173: 264–271.
22. Racey PA (2009) Reproductive assessment of bats. In: Kunz TH, Parsons S, editors. Ecological and Behavioral Methods for the Study of Bats. Baltimore: Johns Hopkins University Press. 249–264 pp.
23. Bourhy H, Sureau P (1990) Rapid fluorescent focus inhibitions test (RFFIT). In: Commission des Laboratoires de Re´fe´rence et d’Expertise, editors. Me´thodes de Laboratoire pour le Diagnostique de la Rage. Paris: Institut Pasteur. 191–193 pp.
24. Lumlertdacha B, Boongird K, Wanghongsa S, Wacharapluesadee S, Chanhome L, et al. (2005) Survey for batLyssavirus, Thailand. Emerg Infect Dis 11: 232– 236.
25. George DB, Webb CT, Farnsworth ML, O’Shea TJ, Bowen RA, et al. (2011) Host and viral ecology determine bat rabies seasonality and maintenance. PNAS 108: 10208–10213.
26. Turmelle AS, Allen LC, Jackson FR, Kunz TH, Rupprecht CE, et al. (2010) Ecology of rabies virus exposure in colonies of Brazilian free-tailed bats (Tadarida brasiliensis) at natural and man-made roosts in Texas. Vector Borne Zoonotic Dis 10: 165–175.
27. Teeling EC, Springer MS, Madsen O, Bates P, O’Brien SJ, et al. (2005) A molecular phylogeny for bats illuminates biogeography and the fossil record. Science 307: 580–584.
28. Fox J (2009) Car: companion to applied regression. R package version 1.2–14. 29. Quinn GP, Keough MJ (2002) Experimental design and data analysis for
biologists. Cambridge University Press, Cambridge, UK. 537 p.
30. Burnham KP, Anderson DR (2002) Model selection and multimodal inference: a practical information–theoretic approach. New York: Springer. 496 p. 31. R Development Core Team (2008) R: A language and environment for
statistical computing. R Foundation for Statistical Computing, Vienna, Austria. ISBN 3-900051-07-0. Available: http://www.R-project.org. Accessed 2013 Apr 22.
32. Sa´nchez-Serrano LP (1999) Rabia transmitida por Murcie´lagos insectı´voros en Espan˜a [Rabies transmitted by insectivorous bats in Spain]. Bol Epidem Semanal 7: 149–153.
33. Echevarria JE, Avellon A, Juste J, Vera M, Ibanez C (2001) Screening of active
Lyssavirus infection in wild bat populations by viral RNA detection on oropharyngeal swabs. J Clin Microbiol 39: 3678–3683.
34. Sa´nchez-Serrano LP, Abella´n C, Dı´az O (2003) The new face of rabies in Spain: infection through insectivorous bats, 1987–2002. Euro Surveill 7: pii = 2250 35. Serra-Cobo J, Amengual B, Lo´pez-Roig M, Bourhy H (2008) Temporal
dynamics of European batLyssavirustype 1 and survival ofMyotis myotisbats in natural colonies. Scivee.TV. Available: http://www.scivee.tv/node/5380. Accessed 2013 Apr 23.
36. Va´zquez-Moro´n S, Juste J, Iba´n˜ez C, Ruiz-Villamor E, Avello´n A, et al. (2008) Endemic circulation of European batLyssavirustype 1 in serotine bats, Spain. Emerg Infect Dis 14: 1263–1266.
37. Va´zquez-Moro´n S, Juste J, Iba´n˜ez C, Berciano JM, Echevarrı´a JE (2011) Phylogeny of European batLyssavirus1 inEptesicus isabellinusbats, Spain. Emerg Infect Dis 17: 520–523.
38. Botvinkin AD, Poleschuk EM, Kuzmin IV, Borisova TI, Gazaryanet SV, et al. (2003) Novel lyssaviruses isolated from bats in Russia. Emerg Infect Dis 9: 1623– 1625.
39. Van der Poel WHM, Van der Heide R, Verstraten ERAM, Takumi K, Lina PHC, et al. (2005) European bat lyssaviruses, the Netherlands. Emerg Infect Dis 11: 1854–1859.
40. Harris SL, Brooke SM, Jones G, Hutson AM, Racey PA, et al. (2006) European bat lyssaviruses: distribution, prevalence and implications for conservation. Biol Conserv 131: 193–210.
41. Smreczak M, Orłowska A, Z˙ mudzin´ski JF (2009) First case of the European bat
Lyssavirustype 1b in bats (Eptesicus serotinus) in Poland in retrospective study. Bull Vet Inst Pulawy 53: 589–595.
42. Megali A, Yannic G, Zahno ML, Bru¨gger D, Bertoni G, et al. (2010) Surveillance for European batLyssavirusin Swiss bats. Arch Virol 155: 1655– 1662.
43. Picard-Meyer E, Dubourg-Savage MJ, Arthur L, Barataud M, Be´cu D, et al. (2011) Active surveillance of bat rabies in France: a 5-year study (2004–2009). Vet Microbiol 151: 390–395.
44. Nokireki T, Huovilainen A, Sihvonen L, Jakava-Viljanen M (2011) Bat rabies surveillance in Finland. Rabies Bull – Europe 35: 8–10.
45. Turmelle AS, Jackson FR, Green D, McCracken GF, Rupprecht CE. (2010) Host immunity to repeated rabies virus infection in big brown bats. J Gen Virol 91: 2360–2366.
46. Christe P, Arelettaz R, Vogel P (2000) Variation in intensity of a parasitic mite (Spinturnix myoti) in relation to the reproductive cycle and immunocompetence of its bat host (Myotis myotis). Ecol Lett 3:207–212.
47. Allen LC, Turmelle AS, Mendonca MT, Navara KJ, Kunz TH et al. (2009) Roosting ecology and variation in adaptive and innate immune system function in the Brazilian free-tailed bat (Tadarida brasiliensis). J Comp Physiol [B] 197:315– 323.
48. Ar Gouilh M, Puechmaille SJ, Gonzalez JP, Teeling E, Kittayapong P, et al. (2011) SARS–Coronavirus ancestor’s foot-prints in south-east Asian bat colonies and the refuge theory. Infect Genet Evol 11: 1690–1702.
49. Coˆte´ IM, Poulin R (1995) Parasitism and group-size in social animals – a metaanalysis. Behav Ecol 6: 159–165.
50. Arneberg P (2002) Host population density and body mass as determinants of species richness in parasite communities: comparative analyses of directly transmitted nematodes of mammals. Ecography 25: 88–94.
51. Begon M, Hazel SM, Telfer S, Bown K, Carslake D, et al. (2003) Rodents, cowpox virus and islands: densities, numbers and thresholds. J Anim Ecol 72: 343–355.
52. Streicker DG, Recuenco S, Valderrama W, Gomez Benavides J, Vargas I, et al. (2012) Ecological and anthropogenic drivers of rabies exposure in vampire bats: implications for transmission and control. Proc R Soc B 279: 3384–3392. 53. Willis CK, Brigham RM (2007) Social thermoregulation exerts more influence
than microclimate on forest roost preferences by a cavity-dwelling bat. Behav Ecol Sociobiol 62: 97–108.
54. Cross PC, Lloyd-Smith JO, Johnson PLF, Getz WM (2005) Dueling timescales of host movement and disease recovery determine invasion of disease in structured populations. Ecol Lett 8: 587–595.
55. Serra-Cobo J, Sanz-Trulle´n V, Martı´nez-Rica JP (1998) Migratory movements ofMiniopterus schreibersiiin the north-east of Spain. Acta Theriol 43: 271–283. 56. Serra-Cobo J, Lo´pez-Roig M, Bayer X, Amengual-Pieras B, Guasch F (2009)