Financial frictions and substitution between internal and external funds
in publicly traded brazilian companies*
Márcio Telles Portal - Brazil
M.Sc. in Accountancy, Universidade do Vale do Rio dos Sinos, Brazil
Auxiliary Professor, Center of Economic Sciences, Universidade do Vale do Rio dos Sinos, Brazil e-mail: [email protected]
João Zani – Brazil
Ph.D. in Business Administration, Universidade Federal do Rio Grande do Sul, Brazil Adjunct Professor, Universidade do Vale do Rio dos Sinos, Brazil
e-mail: [email protected]
Carlos Eduardo Schönerwald da Silva – Brazil Ph.D. in Economics, University of Utah, USA
Adjunct Professor, Universidade Federal do Rio de Janeiro, Brazil e-mail: [email protected]
Received on 8.23.2011 - Accepted on 11.17.2011 - 3rd version on 2.27.2012
ABSTRACT
The present study aimed to document the effects of financial constraints on the negative relationship between cash flow and external funds, a phenomenon associated with the Pecking Order Theory. This theory suggests that companies subject to more expensive external funds (financially constrained firms) should demonstrate a stronger negative relationship with cash flow than companies subject to minor financial frictions (financially unconstrained firms). The results indicate that the external funds of constrained firms consistently present less negative sensitivity to cash flow compared with those of unconstrained companies. Additionally, the internal funds of constrained companies demonstrate a positive sensitivity to cash flow, whereas those of unconstrained companies do not show any such significant behavior. These results are in accordance with the findings of Almeida and Campello (2010), who suggest the following: first, because of the endogenous nature of investment decisions in constrained companies, the complementary relationship between internal and external funds prevails over the substitutive effects suggested by the Pecking Order Theory; and second, the negative relationship between cash flow and external funds cannot be interpreted as evidence of costly external funds and therefore does not corroborate the Pecking Order Theory.
Keywords: Financial constraint. Pecking order. Cash policy. Debt policy. Capital structure.
1 IntroductIon
The literature on capital structure has treated in-vestments as exogenous to financial policies (Fama and French, 2002; Shyam-Sunder and Myers, 1999). Howe-ver, extensive studies on financial constraints (Fazzari, Hubbard and Petersen, 1988; Hubbard, 1998; Almeida, Campello and Weisbach, 2004) have presented evidence that because of financial frictions, not all companies can fully finance their investment opportunities. As a result, some companies experience financial constraints. In this state, investment decisions become endogenous to financial policies.
Few studies have attempted to reconcile these two views from the literature with regard to financing-in-vestment interactions. Almeida and Campello (2010) attempt to do so in a study re-interpreting capital struc-ture, which is a consolidated fact in the literastruc-ture, in the light of the Pecking Order Theory. Specifically, the authors find that there is a negative relationship betwe-en the gbetwe-eneration of internal funds and the demand for external financing. The authors present evidence that a reduction in the demand for external funds is less sen-sitive to the internal generation of funds in constrained companies (i.e., is subject to greater financial frictions). This finding contradicts the Pecking Order Theory and suggests that this behavior is associated with the comple-mentarity between external and internal funds because of the effect of endogenous investment.
Prior evidence suggests that the individual charac-teristics of each company affect the company’s ability to raise external funds and that environmental varia-bles exert a moderating effect. Institutional charac-teristics shape the orientation of the financial system and companies because countries with weak protection for investors and lenders tend to have less developed capital markets, and companies, which are ownership structures that primarily serve as a substitute for legal protection (La Porta, Lopez-de-Silanes, Shleifer and Vishny, 1998, 1999), tend to raise transaction and capi-tal costs and limit access to external financing sources
by increasing incentives to maintain liquidity (Diit-tmar, Mahrt-Smith and Servaes, 2003; Kalcheva and Lins, 2007; Baum, Shäfer and Talavera, 2009; Khurana, Martin and Pereira, 2006).
The present study sought to question whether the behavior of Brazilian companies fits the arguments and the USA-derived evidence of Almeida and Campello (2010). In other words, the study aimed to evaluate em-pirically whether the relationship between the genera-tion of internal funds and the demand for external funds is more negative for financially unconstrained firms than for constrained firms and whether such behavior is asso-ciated with the endogenous nature of investments under financial constraints. This study is relevant to Brazilian companies in several ways. First, the evidence suggests that environmental differences determine the behavior of companies while changing the funding structures and the degree of financial friction, which may involve a change in the substitutive/complementary relationship between external and internal funds. Second, Bekaert and Harvey’s (2002) arguments about the need to deve-lop research in emerging markets present theoretical and empirical challenges. Third, the environmental differen-ces (La Porta et al., 1998) between Brazil and the United States are reflected in the companies’ cash (Koshio and Cia, 2004) and debt policies (Leal, 2008).
The gap addressed in the present study shows the need to reconcile capital structure theories with the en-dogenous investment implications arising from finan-cial constraints in emerging economies such as Brazil. The results obtained here indicate the need for a review of significant national data that support the research on capital structures.
The present study is structured as follows: section 2 presents the literature review; section 3 presents the methodological aspects; section 4 analyzes the results of empirical testing; and section 5 presents the final considerations.
2 LIterature revIew
Modigliani and Miller (1958) suggest that the value of a company is independent from the form in which it is financed. Therefore, the separation theorem is va-lid (i.e., in a friction-free environment, companies can fully finance their investment opportunities to create value without depending on financing decisions). The-oretical studies have questioned the validity of these propositions in the presence of market friction, such as asymmetric information (Myers and Majluf, 1984) and agency problems (Jensen and Meckling, 1976). These frictions can generate anything from an increase in the cost of external funds for internally generated funds to credit rationing (Stiglitz and Weiss, 1981). Under these
conditions, companies are characterized as financially constrained in that they make suboptimal investment decisions because of their insufficient internal and ex-ternal sources of financing. Thus, these companies un-derinvest and incur a reduction in value.
accor-ding to the degree of financial constraint. The authors’ largest empirical contribution is to examine the in-fluence of financial frictions on corporate investment by empirically comparing investment-cash flow sensi-tivity among groups of companies subject to varying degrees of financial friction (and hence to varying de-grees of financial constraint).
However, some authors, such as Erickson and Whi-ted (2000), have questioned Fazzari, Hubbard and Petersen’s (1988) empirical strategy, which focuses mainly on the potentially informative content of cash flow on investment opportunities. The study by Almei-da, Campello and Weisbach (2004) responds to such criticism. Their work not only proposes a new empiri-cal strategy but also enables the relationship between financial constraints, financial policies and investment to be extended in light of the companies' cash policies. This extension follows from the assumption that if com-panies face a costly financing source, they modify their current financial policies by increasing their cash vo-lume to enable more valuable future investments. The trade-off from the costs and benefits of the inter-tem-poral adjustments of liquidity prioritization generates the empirical implication that constrained companies should demonstrate a systematic and positive sensitivi-ty to cash flow. In contrast, unconstrained companies should not present this systematic behavior.
However, the literature on capital structure has ne-glected to address the effects of financial constraints on the interaction between financing and investment, despi-te the theoretical arguments and evidence regarding this subject (Fazzari, Hubbard and Petersen, 1988; Almeida, Campello and Weisbach, 2004; Baum, Shäfer and Tavalera, 2009; Khurana, Martin and Pereira, 2006; Faulkender and Wang, 2006). Almeida and Campello’s (2010) study helps to address this gap, particularly with regard to the Pecking Order Theory.
The Pecking Order Theory suggests that in the face of high external financing costs, companies should prefer to finance their investments with internal fun-ds because of information asymmetry. This prefe-rence causes the companies subject to costly external funds to present a negative ratio of the generation of internal funds (cash flow) to the demand for external funds (Myers, 1984; Myers and Majluf, 1984). Empi-rical studies in Brazil have documented this negative relationship and have suggested a behavioral element of the Pecking Order Theory (Bastos, Nakamura and Basso, 2009; Medeiros and Daher, 2008; Nakamura et al., 2007).
Thus, if the negative relationship between cash flow and the demand for external funds is due to the cost of external financing, companies subject to costly exter-nal funds must present a stronger negative relationship
than companies not subject to financial frictions. Ho-wever, Almeida and Campello (2010) present robust evidence suggesting that this negative relationship is stronger in those companies less likely to be under strong financial frictions (financially unconstrained firms). Thus, contrary to the viewpoint established in the literature, these findings cannot be interpreted as evidence for external financing costs arising from in-formation asymmetry.
Almeida and Campello (2010) suggest that the en-dogenous effects of investment on external financing decisions may explain this behavior. The pecking order argument ignores the possibility that investment deci-sions become endogenous because internal funds are insufficient to finance them and the cost of external funds is prohibitively high. The endogeneity of invest-ment presents three fundainvest-mental soothing effects of the substitutivity between external and internal funds in constrained companies.
First, constrained companies face sub-investments and subject the decision to use internal funds to a trade-off between the reduction in their exposure to external funds and the increase in their current invest-ments. Given the high cost of investment opportuni-ties, constrained companies would find it relatively more advantageous to direct more internal funds to-ward their current investments.
Second, constrained companies adjust their current financial policies to mitigate the adverse effects of fi-nancial constraints on both current and future invest-ments. Constrained companies adjust to ensure that sufficient funds are available to meet their investment opportunities by targeting the generation of internal funds (cash flow) to increase the available volume of liquid assets (internal funds) as cash and short-term investments (Almeida, Campello and Weisbach, 2004) and working capital (Fazzari and Petersen, 1993) while directing less internal funds towards the reduction of external funds.
1 Auxiliary tests: diagnosis of multicollinearity using the correlation matrix of the variables for each group and variance inlation factor (VIF); heteroscedasticity diagnostics using modiied Wald statistics for ixed effects-OLS and Pagan-Hall for ixed effects-IV; and use of the Baltagi-Wu autocorrelation test and Bhargava, Franzini and Narendranathan’s test, which is appropriate for ixed effects. The estimates are robust to section 4 heteroscedasticity and autocorrelation using the Eiker-Huber-White variance estimator.
2 Corresponds to Availability and Short-Term Investments in the Economática Database.
3 The inal decision to consider an endogenous variable depended on the Wu-Hausman test for endogeneity. The two-step GMM was operated by the xtivreg2 command in the Stata software v. 11.
t
i
3 MethodoLogIcaL Procedures
To document how the relationship between external and internal funds is affected by financial constraints,
we followed three steps: 1) define the empirical tests1 to
be used; 2) define the classification criteria of the
com-panies a priori according to their financial state
(cons-trained or uncons(cons-trained); and 3) define the sample, the procedures for collecting and processing the data and the sampling restrictions.
3.1 empirical tests
The first test aimed to verify whether the classification criteria selected to separate financially constrained and unconstrained companies were consistent. Following the approach suggested by Almeida, Campello and Weisbach (2004), we expected constrained companies to have a signi-ficant and positive sensitivity to cash flow and unconstrai-ned companies to show no such significant behavior. The following model estimated by least squares in two stages (LS2S) was adopted, with fixed effects for company and year (Model 1):
ΔRCi,t = β0 + β1CFi,t + β2Qi,t + β3Ln(TA)i,t+ β4Δ (CA-C)i,t
+ β5STDi,t+ β6PAAi,t + ei,t' 1
where ∆CR was defined as the annual change in
the sum of cash and short-term financial investments2.
Cash flow (CF) is defined as net income plus deprecia-tion and minus dividends and interest on the company’s own capital. The size Ln (TA) was defined as the ne-perian logarithm of the book value of the company's assets for the period. Including the size allows us to control for the effects of transaction costs and econo-mies that affect cash and debt policy decisions. As a proxy for investment opportunity, we used Tobin’s Q, measured as total assets – equity + market value of sha-res / total assets.
The following additional variables were used as con-trols for substitutes and cash flow: ∆CA-C, the sum of the change in current assets minus the change in cash reser-ves (CR); ∆STD, the variation in the short-term financial debt (bonds and financing); and applications in permanent assets (PAA), including affiliated companies and subsidia-ries. All of the variables except Ln (TA) were divided by the total assets. To recognize a possible endogeneity of the variables, we used a two-year gap of endogenous variables as the instrument.
The second test aimed to verify whether investment en-dogeneity mitigates the substitutive relationship between external and internal funds, which would imply that exter-nal funds (debt and equity) are more sensitive to reduced cash flow for constrained companies than for unconstrai-ned companies. The model used two alternative
specifica-tions for the sensitivity of external funds to cash flow. The first specification, estimated by Ordinary Least Squares (OLS) with fixed effects for company and year (Model 2), only includes proxies for the variables that are believed to capture primary information related to the theory: cash flow, investment opportunities and size. This model was calculated as:
ΔFEi,t = α1CFi,t + α2Qi,t + α3Ln(TA)i,t+ Σ companyi
+ Σ yeart + ei,t' 2
where (∆EF) is defined as the change in external sources of financing and the proxy is measured as the sum of the net issuance of debt (annual change of the debentures and short-term and long-term financing) and net emission of shares (NES), measured as the an-nual change of stockholders' equity minus the retained profits. Cash flow is defined as the net income plus de-preciation and amortization. These variables were divi-ded by the total assets.
The second specification for the sensitivity of ex-ternal financing considers the effects of pre-existing balances (one year lag) in the internal funds, the initial capital structure and the collateralizable assets on the debt policy. To control the pre-existing internal funds, we adopted the cash reserve (CR) and the sum of the client accounts and stocks, defined as other liquid assets (OLA). As tangible/collateralizable assets, we used the balance in fixed assets (FA) and measured the initial ca-pital structure as the ratio of debt to equity (Debt/Eq). These variables were divided by the total assets, with the exception of Debt/Eq. The model was estimated by the Generalized Method of Moments (GMM) in two steps, with fixed effects for company and year. The model was specified as follows:
ΔFEi,t = α1CFi,t + α2Qi,t + α3Ln(TA)i,t+ α4CRi,t-1 + α5OLAi,t-1
+ α6FAi,t-1+ α7 Debt/EQt-1 +Σi company+Σt year+ εi,t, 3
where FA and Debt/Eq were considered to be endoge-nous variables. Two lags of the endogeendoge-nous variables were
used as instruments3.
in-t
i FE
t
i FI
4 The law 6404/76 and the more recent law 10303/01 predict that if the status is omitted and the General Assembly considers changing it to introduce a standard on the dividend policy, the mandatory dividend may not be less than 25% of the adjusted net income. Therefore, the companies with zero payouts may be separated because, otherwise, some companies with this characteristic or with less than 0.25 payouts could be classiied as unconstrained. No company classiied as unrestricted presented a total payout of less than 25%. Additionally, the descriptive statistics reported in Table 1 indicate that the criteria adopted are capable of discriminating between the companies in those two states.
ternal and external funds to their cash flows. We used the Seemingly Unrelated Regressions (SUR) with fixed effects for company and year to capture this concurrent behavior between the policies from the same company (Models 4 and 5):
ΔFEi,t = α1FCi,t + α2Qi,t + α3Sizei,t+ Σ companyi
+ Σ year+ ei,t 4
ΔFIi,t = β1FCi,t + β2Qi,t + β3Sizei,t+ Σ companyi
+ Σ yeart + ei,t, 5
where ∆IF captures the variation in internal funds. In this study, the proxy was measured as the variance of the sum of the CR and OLA. These variables were divided by the total assets.
We ran Models 3 and 4 to verify the sensitivity of the external funds and to detect the isolated debt sensitivity. The objective was to identify the possible differences in behavior due to the source of external funds and to avoid potential problems with measuring the proxy for net share issuance.
3.2 classification method a priori regarding the
financial state
Considering the criteria used in previous studies and the local characteristics and limitations of publicly availa-ble data, we proposed the following criteria for classifying the companies’ financial constraints: total payout (PAY); American Depositary Receipt (ADR) issuance; and the intersection between the Size and Total Payout criteria
(SIZE∩PAY). For the 1995-2005 period, the companies
were ranked annually according to these criteria.
3.2.1 classiication based on total Payout (PaY)
PAY is defined as the sum of dividends and interest on the company’s own capital divided by its net profit. The
com-panies that did not pay annual dividends4 or interest on
capi-tal and that did not make any repurchases were classified as financially restricted. Among the companies that submitted a PAY greater than zero, the companies of the lower three deciles of the distribution were considered financially cons-trained companies, whereas the companies of the top three deciles were classified as financially unconstrained.
This classification is justified by Fazzari, Hubbard and Petersen’s (1988) argument because the conditioning from the payment of dividends is supported by the effects of asymmetric information on the differential of the costs and limits of internal and external funds. According to Myers and Majluf (1984), this differential justifies the existence of financial clearance and the preference for internally gene-rated funds, which creates a hierarchy of financing sources. In this situation, not paying or reducing dividends would benefit shareholders because these resources can be applied
in investment opportunities with positive NPV, which otherwise could not be financed because of the depletion of other internal funds.
Other evidence from prior studies strengthens this ar-gument. Fama and French (2002) suggest that the lowest dividend payment can be associated with difficulties in ac-cessing external sources of financing. In Brazil, a negative relationship has been found between growth opportunities and payout (Futema, Basso and Kayo, 2009; Iquiapaza, Amaral and Lamounier, 2008).
3.2.2 adr issuers (adr)
The companies were classified annually based on the condition that they are broadcasting American Deposi-tary Receipts (ADR) of levels 2 and 3. The companies is-suing ADRs were considered financially unconstrained, whereas those that did not present ADRs annually were considered financially constrained. Unlike Brazilian stu-dies, studies in the USA do not adopt this criterion. Ho-wever, according to Bruni (2002), this criterion can be used to identify companies that are subject to major in-formational requirements by the Securities and Exchan-ge Commission (SEC) and subject to the lower costs of capital and limitations to local offers of external funds. In Brazil, Costa, Paz and Funchal (2008) find evidence consistent with the findings of Almeida, Campello and Weisbach (2004) by using the ADR issuance as a classi-fication criterion.
3.2.3 Intersection between the criteria of size and total Payout (sIZe ∩PaY)
We used the intersection between the observations of the companies classified according to the criteria of Size and Total Payout. In other words, only the compa-nies that presented the same state in both criteria were classified as constrained or unconstrained. The goal of this classification scheme was to promote more restric-tive conditions among classifications because the Bra-zilian studies (e.g., Costa and Paz, 2004) that applied the two criteria separately have failed to achieve the theoretical results.
Using the criterion Size, we classified the companies for each year by using the total asset proxy. The compa-nies in the three lower deciles of the distribution of total asset size were considered financially constrained, and those in the three higher deciles were considered finan-cially unconstrained.
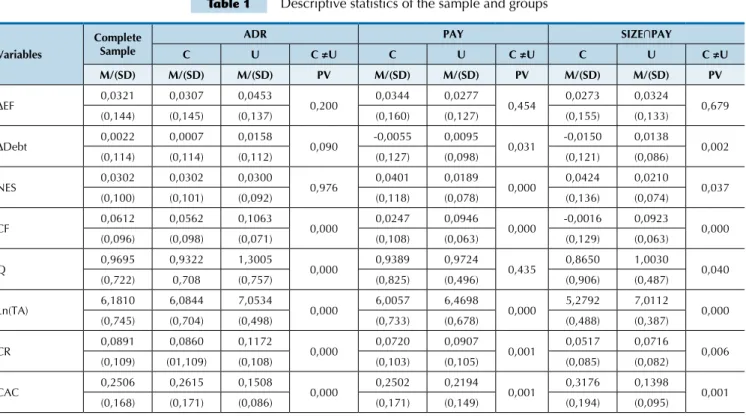
be-Table 1 Descriptive statistics of the sample and groups
Variables
Complete Sample
ADR PAY SIZE∩PAY
C U C ≠U C U C ≠U C U C ≠U
M/(SD) M/(SD) M/(SD) PV M/(SD) M/(SD) PV M/(SD) M/(SD) PV
ΔEF 0,0321 0,0307 0,0453 0,200 0,0344 0,0277 0,454 0,0273 0,0324 0,679 (0,144) (0,145) (0,137) (0,160) (0,127) (0,155) (0,133)
ΔDebt 0,0022 0,0007 0,0158 0,090 -0,0055 0,0095 0,031 -0,0150 0,0138 0,002
(0,114) (0,114) (0,112) (0,127) (0,098) (0,121) (0,086)
NES 0,0302 0,0302 0,0300 0,976 0,0401 0,0189 0,000 0,0424 0,0210 0,037 (0,100) (0,101) (0,092) (0,118) (0,078) (0,136) (0,074)
CF 0,0612 0,0562 0,1063 0,000 0,0247 0,0946 0,000 -0,0016 0,0923 0,000 (0,096) (0,098) (0,071) (0,108) (0,063) (0,129) (0,063)
Q 0,9695 0,9322 1,3005 0,000 0,9389 0,9724 0,435 0,8650 1,0030 0,040 (0,722) 0,708 (0,757) (0,825) (0,496) (0,906) (0,487)
Ln(TA) 6,1810 6,0844 7,0534 0,000 6,0057 6,4698 0,000 5,2792 7,0112 0,000 (0,745) (0,704) (0,498) (0,733) (0,678) (0,488) (0,387)
CR 0,0891 0,0860 0,1172 0,000 0,0720 0,0907 0,001 0,0517 0,0716 0,006 (0,109) (01,109) (0,108) (0,103) (0,105) (0,085) (0,082)
CAC 0,2506 0,2615 0,1508 0,000 0,2502 0,2194 0,001 0,3176 0,1398 0,001 (0,168) (0,171) (0,086) (0,171) (0,149) (0,194) (0,095)
continues
nefit from financial economies of scale (i.e., they have greater difficulties in accessing external sources of fi-nancing). According to Fama and French (2002), becau-se size is positively correlated with age, smaller compa-nies are less likely to have developed histories that allow investors to distinguish between companies with good and poor abilities to pay.
3.3 sample
The population of the present study includes all non-financial publicly traded Brazilian companies whose accounting and market information were avai-lable in the Economática database for the 1995-2005 period. We adjusted the data to 2005 values by using the General Price Index-Internal Availability (GPI-IA).
We eliminated the observations that presented at least one of the following restrictions: (a) did not provide indebtedness in any year in the period under review; (b) had surplus cash reserves below R$500,000; (c) had annual growth in net sales or total assets that excee-ded 100%; (d) exhibited a Q value less than 0 or greater than 10; and (e) had debts greater than the book value of the assets.
These sample restrictions have the following purposes: (a) and (b) serve to exclude the companies that were unable to adopt active cash and debt policies; (c) eliminates the compa-nies that experienced significant changes in the fundamentals of their businesses; (d) mitigates the potential effects of mea-surement errors related to the variable Q; and (e) eliminates the companies that could have been close to default.
4 anaLYses oF the resuLts
The sample consisted of 1,836 observations and 326 companies. Table 1 provides the descriptive statistics as well as the mean (M) and standard deviation (SD) of the variables used in the estimates for the full sample and for the groups of constrained (C) and unconstrai-ned (U) companies for each of the three sorting crite-ria. It also presents the p-value (PV) of the t test for the mean differences (C ≠ U) of the variables between the groups.
In general, the independent variables mainly presen-ted mean differences that were statistically significant at a 10% level, which indicates that the classification crite-ria presented discriminating behavior for the vacrite-riables tested. In short, the constrained companies revealed lo-wer cash flows, lolo-wer investment opportunities, lolo-wer Ln (TA), lower cash reserves, less application in permanent
assets, less debt and fewer fixed assets while presenting a greater balance in other liquid assets, a greater balan-ce in internal funds and a higher debt/Eq ratio than the unconstrained companies. These descriptive statistics suggest that the theoretical profiles of the constrained and unconstrained companies most strongly identified by the debt, internal funds and cash flow variables are empirically valid.
Variables
Complete Sample
ADR PAY SIZE∩PAY
C U C ≠U C U C ≠U C U C ≠U
M/(SD) M/(SD) M/(SD) PV M/(SD) M/(SD) PV M/(SD) M/(SD) PV
PAA 0,0768 0,0725 0,1136 0,000 0,0680 0,0873 0,000 0,0483 0,0974 0,000 (0,074) (0,072) (0,081) (0,069) (0,078) (0,053) (0,079)
Debt/Eq 1,1614 1,1865 0,9349 0,173 1,5614 0,8827 0,000 1,5317 1,0602 0,000 (2,412) (2,511) (1,169) (3,148) (1,258) (3,474) (1,150)
ΔIF 0,0087 0,0074 0,0207 0,153 0,0035 -0,0017 0,464 -0,0098 0,0045 0,131 (0,114) (0,116) (0,092) (0,126) (0,096) (0,120) (0,065)
Debt 0,2482 0,2415 0,3084 0,000 0,2661 0,2419 0,014 0,2097 0,2873 0,013 (0,167) (0,168) (0,142) (0,176) (0,155) (0,171) (0,148)
Fixed Asset 0,4342 0,4265 0,5029 0,000 0,4346 0,4742 0,002 0,3746 0,5640 0,002 (0,219) (0,223) (0,167) (0,226) (0,211) (0,214) (0,200)
Descriptive statistics: mean (M) and standard deviation (SD) of the variables used in the estimates for the full sample and for the groups of companies classiied as
inancially constrained (C) and unconstrained (U) for each of the three classiication criteria. The period is 1995-2005. Variation in external inancing (ΔEF) was me
-asured as the sum of ΔDEBT and NES. * DEBT was me-asured as the sum of short- and long-term inancial indebtedness (debentures and inancing). ΔDEBT was me
-asured as the short- and long-term variation in inancial debt (debentures and inancing). NES was me-asured as the changes in stockholders' equity minus retained proits. CF was measured as net income plus depreciation and amortization minus dividends and interest on equity capital. Q was measured as total assets – equity
+ market value of shares / total assets. Ln (TA) was measured as the logarithm of the assets’ book value. CR was measured as the sum of cash and short-term inan
-cial investments. ΔCA-C was measured as the variation in current assets minus the variation in the cash reserve (CR). PAA was measured as the sum of permanent assets, including applications in afiliates and subsidiaries. DEBT/Eq was measured as the ratio of debt to equity. The variation in internal funds (ΔIF) was measured as the sum of the variance in the cash reserve (CR) and the change in customers and inventory. FA was measured as ixed assets. All of the variables were staggered by total assets, except for Q, Ln (TA) and DEBT/Eq. The p-value (PV) represents the t test for the mean differences (C ≠ U) of the variables between the groups.
Table 1 continued
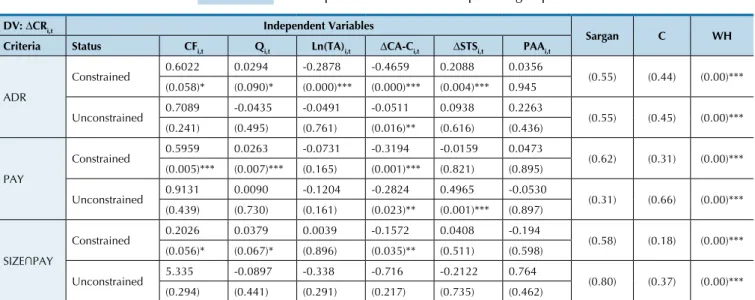
Table 2 Descriptive statistics of the sample and groups
DV: ΔCRi,t Independent Variables
Sargan C WH
Criteria Status CFi,t Qi,t Ln(TA)i,t ΔCA-Ci,t ΔSTSi,t PAAi,t
ADR
Constrained 0.6022 0.0294 -0.2878 -0.4659 0.2088 0.0356 (0.55) (0.44) (0.00)***
(0.058)* (0.090)* (0.000)*** (0.000)*** (0.004)*** 0.945
Unconstrained 0.7089 -0.0435 -0.0491 -0.0511 0.0938 0.2263 (0.55) (0.45) (0.00)***
(0.241) (0.495) (0.761) (0.016)** (0.616) (0.436)
PAY
Constrained 0.5959 0.0263 -0.0731 -0.3194 -0.0159 0.0473 (0.62) (0.31) (0.00)***
(0.005)*** (0.007)*** (0.165) (0.001)*** (0.821) (0.895)
Unconstrained 0.9131 0.0090 -0.1204 -0.2824 0.4965 -0.0530 (0.31) (0.66) (0.00)***
(0.439) (0.730) (0.161) (0.023)** (0.001)*** (0.897)
SIZE∩PAY
Constrained 0.2026 0.0379 0.0039 -0.1572 0.0408 -0.194 (0.58) (0.18) (0.00)***
(0.056)* (0.067)* (0.896) (0.035)** (0.511) (0.598)
Unconstrained 5.335 -0.0897 -0.338 -0.716 -0.2122 0.764 (0.80) (0.37) (0.00)***
(0.294) (0.441) (0.291) (0.217) (0.735) (0.462)
The results of the estimates by 2SLS (ixed effects for company and year) applying Model 1 to the groups of inancially constrained (C) and unconstrained (U) companies for each of the three classiication criteria. ΔCR was measured as the change in the sum of cash and short-term investments. CF was measured as net income plus depreciation and amortization minus dividends and interest on equity capital. Q was measured as total assets - equity market value of shares / total assets. Ln (TA) was measured as the logarithm of the assets’ book value. ΔCA-C was measured as the change in current assets minus the change
in the cash reserve (CR). ΔSTD was measured as the changes in short-term inancial debt (debentures and inancing). PAA was measured as the sum of per
-manent assets, including applications in afiliates and subsidiaries. All of the variables were staggered by total assets, except for Q and Ln (TA). The results (p-values) of the diagnostic statistics for over-identiication constraints (Sargan test), exogeneity of instruments (difference in Sargan test, C) and endogeneity
(Wu-Hausman test, WH) are also illustrated. The CF variables, Ln (TA), ΔSTD, ΔCA-C and PAA, were considered endogenous in the model and were instru
-mentalized with the irst and second lags. The sample comprises the annual observations for the 1995-2005 period. Robust estimates were performed using
the Eiker-Huber-White estimator5. The p-values are presented in parentheses.
Note: ***, ** and * indicate statistical signiicance levels of 1, 5 and 10%, respectively.
5 Estimates were conducted via two-step GMM, which we proved to be robust to heteroscedasticity by using the xtivreg2, gmm2s command in the Stata/IC software 11.0, but the results proved to be qualitatively similar.
The estimates indicated a significant and positive sensitivity to cash flow for the constrained companies, whereas the un-constrained companies showed no such statistically significant behavior. These results occurred regardless of the classification criteria and corresponded to the behavior advocated by Almei-da, Campello and Weisbach’s (2004) theory. The estimates in-dicate that for each Real normalized by the total assets of cash
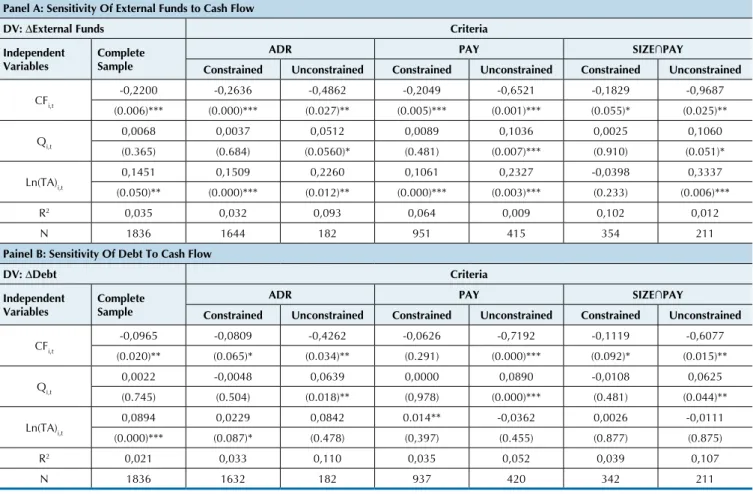
Table 3 Sensitivity of External Funds/Debt to Cash Flow
Panel A: Sensitivity Of External Funds to Cash Flow
DV: ΔExternal Funds Criteria
Independent Variables
Complete Sample
ADR PAY SIZE∩PAY
Constrained Unconstrained Constrained Unconstrained Constrained Unconstrained
CFi,t
-0,2200 -0,2636 -0,4862 -0,2049 -0,6521 -0,1829 -0,9687
(0.006)*** (0.000)*** (0.027)** (0.005)*** (0.001)*** (0.055)* (0.025)**
Qi,t
0,0068 0,0037 0,0512 0,0089 0,1036 0,0025 0,1060
(0.365) (0.684) (0.0560)* (0.481) (0.007)*** (0.910) (0.051)*
Ln(TA)i,t
0,1451 0,1509 0,2260 0,1061 0,2327 -0,0398 0,3337
(0.050)** (0.000)*** (0.012)** (0.000)*** (0.003)*** (0.233) (0.006)***
R2 0,035 0,032 0,093 0,064 0,009 0,102 0,012
N 1836 1644 182 951 415 354 211
Painel B: Sensitivity Of Debt To Cash Flow
DV: ΔDebt Criteria
Independent Variables
Complete Sample
ADR PAY SIZE∩PAY
Constrained Unconstrained Constrained Unconstrained Constrained Unconstrained
CFi,t
-0,0965 -0,0809 -0,4262 -0,0626 -0,7192 -0,1119 -0,6077
(0.020)** (0.065)* (0.034)** (0.291) (0.000)*** (0.092)* (0.015)**
Qi,t
0,0022 -0,0048 0,0639 0,0000 0,0890 -0,0108 0,0625
(0.745) (0.504) (0.018)** (0,978) (0.000)*** (0.481) (0.044)**
Ln(TA)i,t
0,0894 0,0229 0,0842 0.014** -0,0362 0,0026 -0,0111
(0.000)*** (0.087)* (0.478) (0,397) (0.455) (0.877) (0.875)
R2 0,021 0,033 0,110 0,035 0,052 0,039 0,107
N 1836 1632 182 937 420 342 211
The results of the estimates by OLS (ixed effects for company and year) using Model 2 on the groups of inancially constrained (R2) and unconstrained (N)
companies for each of the three classiication criteria. Panel A presents the results of the estimates using the variation in external funds (net issuance of
shares plus net debt issuance) as a dependent variable (DV). Panel B presents the results of the estimates using the short- and long-term annual changes in
inancial indebtedness (inancing and debentures) as the DV debt variation. ΔCR was measured as the change in the sum of cash and short-term inancial in
-vestments. CF was measured as net income plus depreciation and amortization minus dividends and interest on own capital. Q was measured as total assets
- equity market value of shares / total assets. Ln (TA) was measured as the neperian logarithm of the assets’ book value. The sample comprises the annual observations from 1995 to 2005. Robust estimates were performed using the Eiker-Huber-White estimator. The p-values are reported in parentheses.
Note: ***, ** and * indicate statistical signiicance levels of 1, 5 and 10%, respectively. In addition, Tobin’s Q proved to be positive and signifi-cant only for the constrained companies. This finding was consistent with the empirical implications of the theory, ac-cording to which investment opportunities would be a con-cern only for constrained companies. As a result, these com-panies must adjust their financial policies (in this case, their cash policies) to avoid underinvestment.
Given the success with the measurement, the empirical verification and the theoretical correspondence of cash sen-sitivity to cash flow, we were able to start the second phase of the empirical tests.
The second test involved estimates intended to observe the pecking order behavior, as commonly reported in the li-terature, of negative and significant sensitivity between cash flow and debt. Equal estimates were performed to verify whe-ther external funds (debt and equity) were negatively sensi-tive to cash flow. Panel A in Table 3 reveals a negasensi-tive and statistically significant sensitivity (at 1%) of external funds to cash flow for the complete sample. Thus, for each Real of internally generated funds (cash flow) normalized by assets, approximately 22 cents are used to reduce the demand for external funds. Panel B presents similar results. The results for the complete sample indicate a negative and significant
sensitivity (at 5%) of debt to cash flow. This finding indicates that for each Real of cash flow normalized by assets, approxi-mately 9 cents are used to reduce the demand for debt.
When the companies are separated by their financial sta-tuses, Table 3 demonstrates that the external funds (Panel A) and debt (Panel B) of both the constrained and unconstrai-ned companies show a significant and negative sensitivity (at 10%) to cash flow. However, the negative sensitivity of external funds is systematically higher for the unconstrained companies. For every Real normalized by the total assets of cash flow, the unconstrained companies use between 48 and 96 cents to reduce the demand for external funds, where-as the constrained companies use between 18 and 26 cents for this purpose. The same situation occurs with regard to the negative sensitivity of debt to cash flow; in this case, the unconstrained companies use between 42 and 61 cents to re-duce the demand for debt, whereas the restricted companies use between 6 and 11 cents.
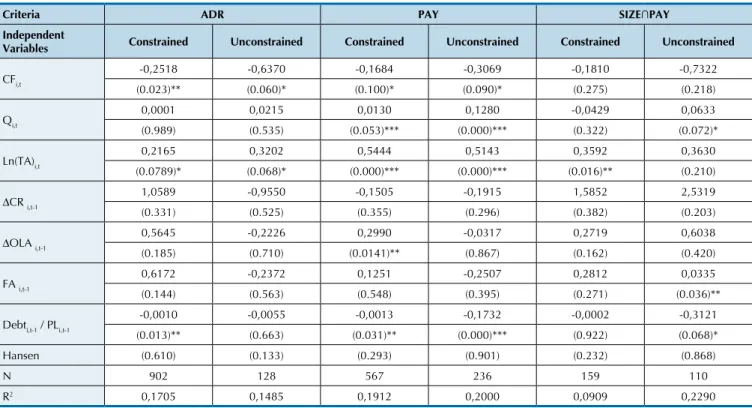
Table 4 Sensitivity of External Funds to Cash Flow: Expanded Model
Criteria ADR PAY SIZE∩PAY
Independent
Variables Constrained Unconstrained Constrained Unconstrained Constrained Unconstrained
CFi,t
-0,2518 -0,6370 -0,1684 -0,3069 -0,1810 -0,7322
(0.023)** (0.060)* (0.100)* (0.090)* (0.275) (0.218)
Qi,t
0,0001 0,0215 0,0130 0,1280 -0,0429 0,0633
(0.989) (0.535) (0.053)*** (0.000)*** (0.322) (0.072)*
Ln(TA)i,t 0,2165 0,3202 0,5444 0,5143 0,3592 0,3630
(0.0789)* (0.068)* (0.000)*** (0.000)*** (0.016)** (0.210)
ΔCR i,t-1
1,0589 -0,9550 -0,1505 -0,1915 1,5852 2,5319
(0.331) (0.525) (0.355) (0.296) (0.382) (0.203)
ΔOLA i,t-1
0,5645 -0,2226 0,2990 -0,0317 0,2719 0,6038
(0.185) (0.710) (0.0141)** (0.867) (0.162) (0.420)
FA i,t-1 0,6172 -0,2372 0,1251 -0,2507 0,2812 0,0335
(0.144) (0.563) (0.548) (0.395) (0.271) (0.036)**
Debti,t-1 / PLi,t-1 -0,0010 -0,0055 -0,0013 -0,1732 -0,0002 -0,3121
(0.013)** (0.663) (0.031)** (0.000)*** (0.922) (0.068)*
Hansen (0.610) (0.133) (0.293) (0.901) (0.232) (0.868)
N 902 128 567 236 159 110
R2 0,1705 0,1485 0,1912 0,2000 0,0909 0,2290
The results of the two-step GMM estimates (ixed effects for company and year) using Model 3 for the groups of inancially constrained (R2) and
uncons-trained (N) companies for each of the three sorting criteria. The variation in External Financing (ΔEF) was measured as the sum of ΔDEBT and NES. CF was measured as net income plus depreciation and amortization minus dividends and interest on own capital. ΔCR was measured as the change in the sum of cash and short-term investments. Q was measured as total assets - equity + market value of shares / total assets. LN (TA) was measured as the logarithm of the assets’ book value. ΔFA was measured as the annual change in ixed assets. DEBT/Eq was measured as the ratio of DEBT to equity. All of the variables
were staggered by total assets, except for Q, Ln (TA) and DEBT/Eq. The table also presents the p-value of Hansen's test statistic for the restrictions on iden
-tiication. The sample comprises the annual observations from 1995 to 2005. Robust estimates were performed using the Eiker-Huber-White estimator. The
p-values are reported in parentheses.
Note: ***, ** and * indicate statistical signiicance levels of 1, 5 and 10%, respectively.
6 After performing the Wu-Hausman endogeneity test, we adopted the proxies’ variables for tangibility and capital structure as endogenous variables by using the second and third lags as instruments.
The control variables for both Panel A and Panel B revealed low adherence to expectations. Investment opportunities presented a significant and positive re-lationship only for the unconstrained companies. The company size systematically revealed statistical signi-ficance only in Panel A, where it presented a positive relationship regardless of the classification criteria and the financial status.
Table 4 pertains to alternative specifications for the se-cond test, where the model was estimated by GMM in two steps, including control variables for the sources of pre-existing internal resources and lagged proxies for tangibi-lity and capital structure. The estimates performed for the constrained and unconstrained companies in accordance with the three classification criteria reinforce the results described in Table 3.
Using the ADR and PAY classification criteria, we found that the external funds of the constrained compa-nies presented a sensitivity to cash flow of between 16 and 25 normalized cents of assets, whereas those of the uncons-trained companies presented a negative sensitivity to cash
flow of between 30 and 63 cents. Using the SIZE∩PAY
criterion, we observed no statistically significant beha-vior, although the cash flow coefficient of the unconstrai-ned companies was larger than that of the constraiunconstrai-ned companies. The Hansen test indicated that the employed
instruments can be considered valid6. Additional control
variables did not individualize systematic and significant behavior in the estimates, with the exception of the proxy for capital structure, which was negative in the estimates regardless of the companies’ financial states.
The average of the coefficients of the cash flow variable
in Model 3 for the sensitivity of capital was -0.2004 for the constrained companies and -0.5587 for the unconstrained companies, whereas Almeida and Campello (2010) repor-ted values of -0.0194 and -0.1602, respectively.
The results of the second test showed agreement with the results of past Brazilian empirical studies (Bastos, Nakamura and Basso, 2009; Medeiros and Daher, 2008; Nakamura et al., 2007), which associate the negative re-lationship between the generation of internal funds and the demand for external funds/debt with the Pecking Order Theory.
nega-Table 5 Financial Constraints and the Sensitivity of Internal/External Funds (Debt) to Cash Flow
Constrained
Variáveis Independentes R2 N
Criteria Dependent Variable CFi,t(P-value) Qi,t (P-value) Ln(TA)i,t (P-value)
Panel A
ADR ΔInternal Funds 0,2998 (0,00)*** 0,0129 (0,00)*** 0,0051 (0,30) 0,183 1515
ΔExternal Funds -0,1506 (0,00)*** 0,0164 (0,00)*** 0,0111 (0,04)** 0,200
PAY ΔInternal Funds 0,3473 (0,00)*** 0,0217 (0,00)*** 0,006 (0,37)*** 0,223 870
ΔExternal Funds -0,1852 (0,00)*** 0,033 (0,00)*** 0,0174 (0,03)** 0,228
SIZE∩PAY ΔInternal Funds 0,3296 (0,00)*** -0,0079 (0,48) 0,0168 (0,25) 0,345 327
ΔExternal Funds -0,1165 (0,04) ** 0,0248 (0,08) * 0,0218 (0,24) 0,287
continues
tive relationship, which indicates that this relationship was mitigated. This behavior is systematic and incompatible with the explanation of the pecking order standard for the substitutivity between internal and external funds, which is based precisely on the cost of external financing. As dis-cussed earlier, the investment endogeneity induced by the financial constraints most likely explains the greater com-plementarity between external and internal funds in the constrained companies.
Thus, in the third test, we sought to verify whether the complementarity between internal and external funds was greater for the constrained companies than for the un-constrained companies. The empirical implication is as-sociated with the argument that investment decisions and financing are determined simultaneously. Additionally, it is associated with the credit multiplier effect that occurs if constrained companies manage their internal funds to in-crease their abilities to raise external funds. We expected the constrained companies’ external and internal funds to present a minor negative sensitivity and a higher positive sensitivity to cash flow, respectively, in comparison with the unrestricted companies.
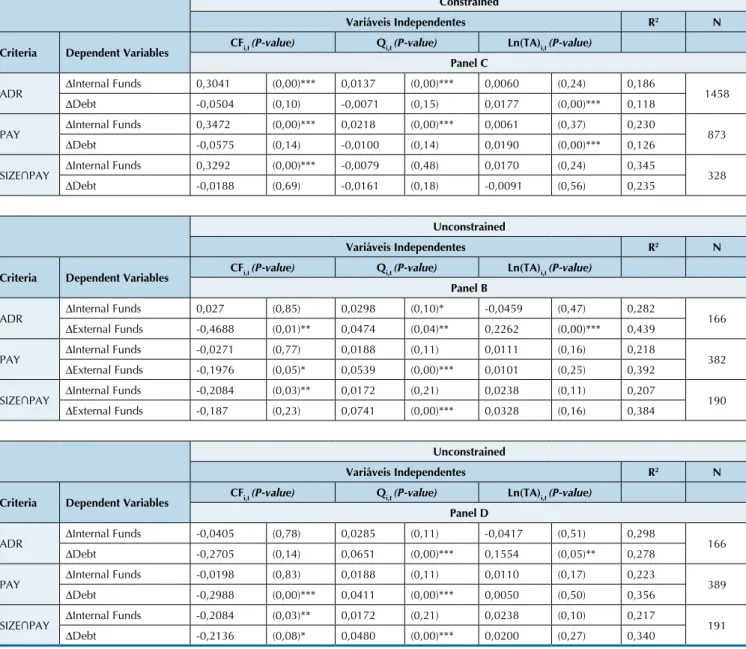
Table 5 presents the results estimated by seemingly un-related regression (SUR) equations with fixed effects for company and year. These estimations used Models 4 and 5 on the groups of financially constrained and unconstrai-ned companies for each of the three classification criteria. The SUR estimation allowed us to capture simultaneous behavior arising from each company’s policies. The obser-ved effect contrasts the sensitivity of the constrained and unconstrained companies’ internal and external funds to their cash flows.
Panel A of Table 5 shows that the internal funds of cons-trained companies systematically present a positive sensi-tivity to cash flow. At the same time, the panel highlights the negative sensitivity of external funds to cash flow. Pa-nel B shows that the internal funds of the unconstrained companies do not show a significant and systematic
sen-sitivity to cash flow. Rather, their external funds exhibit a systematic, significant negative sensitivity to cash flow. Pa-nel C indicates that the internal funds of the constrained companies systematically present a positive sensitivity to cash flow. However, their debt presents a non-significant negative sensitivity to cash flow. Panel D shows that the in-ternal funds of the unconstrained companies do not reveal a significant, systematic sensitivity to cash flow. However, their debt demonstrates a systematic, significant negative sensitivity to cash flow.
The sensitivity of external funds to cash flow was syste-matically more negative for the financially unconstrained companies than for the financially constrained companies. In general, the results for the third test, which are reported in Table 5, support Almeida and Campello’s (2010) hypo-thesis that the complementarity between internal funds and external funds is greater for constrained companies than for unconstrained companies because of the endoge-neity of investment decisions, which contradicts the substi-tutivity between internal and external funds implied by the Pecking Order Theory.
We found that the mean of the coefficients of the cash flow variable for the sensitivity of internal funds in Model 4 was 0.3268 for the constrained companies, whereas Al-meida and Campello (2010) reported a value of 0.0547. Si-milarly, we found that the average of the coefficients of the cash flow variable in Model 5 for the sensitivity of exter-nal funds was -0.0422 for the constrained companies and -0.2610 for the unconstrained companies. In comparison, Almeida and Campello (2010) reported values of -0.0128 and -0.1545, respectively.
Constrained
Variáveis Independentes R2 N
Criteria Dependent Variables CFi,t(P-value) Qi,t (P-value) Ln(TA)i,t (P-value)
Panel C
ADR ΔInternal Funds 0,3041 (0,00)*** 0,0137 (0,00)*** 0,0060 (0,24) 0,186 1458
ΔDebt -0,0504 (0,10) -0,0071 (0,15) 0,0177 (0,00)*** 0,118
PAY ΔInternal Funds 0,3472 (0,00)*** 0,0218 (0,00)*** 0,0061 (0,37) 0,230 873
ΔDebt -0,0575 (0,14) -0,0100 (0,14) 0,0190 (0,00)*** 0,126
SIZE∩PAY ΔInternal Funds 0,3292 (0,00)*** -0,0079 (0,48) 0,0170 (0,24) 0,345 328
ΔDebt -0,0188 (0,69) -0,0161 (0,18) -0,0091 (0,56) 0,235
Unconstrained
Variáveis Independentes R2 N
Criteria Dependent Variables CFi,t(P-value) Qi,t (P-value) Ln(TA)i,t (P-value)
Panel B
ADR ΔInternal Funds 0,027 (0,85) 0,0298 (0,10)* -0,0459 (0,47) 0,282 166
ΔExternal Funds -0,4688 (0,01)** 0,0474 (0,04)** 0,2262 (0,00)*** 0,439
PAY ΔInternal Funds -0,0271 (0,77) 0,0188 (0,11) 0,0111 (0,16) 0,218 382
ΔExternal Funds -0,1976 (0,05)* 0,0539 (0,00)*** 0,0101 (0,25) 0,392
SIZE∩PAY ΔInternal Funds -0,2084 (0,03)** 0,0172 (0,21) 0,0238 (0,11) 0,207 190
ΔExternal Funds -0,187 (0,23) 0,0741 (0,00)*** 0,0328 (0,16) 0,384
Unconstrained
Variáveis Independentes R2 N
Criteria Dependent Variables CFi,t(P-value) Qi,t (P-value) Ln(TA)i,t (P-value)
Panel D
ADR ΔInternal Funds -0,0405 (0,78) 0,0285 (0,11) -0,0417 (0,51) 0,298 166
ΔDebt -0,2705 (0,14) 0,0651 (0,00)*** 0,1554 (0,05)** 0,278
PAY ΔInternal Funds -0,0198 (0,83) 0,0188 (0,11) 0,0110 (0,17) 0,223 389
ΔDebt -0,2988 (0,00)*** 0,0411 (0,00)*** 0,0050 (0,50) 0,356
SIZE∩PAY ΔInternal Funds -0,2084 (0,03)** 0,0172 (0,21) 0,0238 (0,10) 0,217 191
ΔDebt -0,2136 (0,08)* 0,0480 (0,00)*** 0,0200 (0,27) 0,340
The results of the SUR estimates (ixed effects for company and year) using Models 4 and 5 in the groups of inancially constrained (Panels A and C) and unconstrained companies (Panels B and D) for each of the three classiication criteria. Panels A and B present the results of the estimates for the sensitivity of external funds to cash low, whereas panels C and D present the results of the estimates for the sensitivity of debt to cash low. ΔDEBT was measured as the short- and long-term changes in inancial debt (debentures and inancing). The variation in internal funds (ΔIF) was measured as the sum of the annual
variation in the cash reserve (ΔCR) and the variation in the other net assets (ΔOLA). Cash low (CF) was measured as net income plus depreciation and amor
-tization minus dividends and interest on own capital. Investment opportunities (Q) were measured as total assets - equity + market value of shares / total assets. Size (Ln (TA)) was measured as the logarithm of the assets’ book value. All of the variables were staggered by total assets, except for Q and Ln (TA). The sample comprises the annual observations from 1995 to 2005. Robust estimates were performed using the Eiker-Huber-White estimator. The p-values
are reported in parentheses.
Note: ***, ** and * indicate statistical signiicance levels of 1, 5 and 10%, respectively.
Table 5 continued
Similarly, we noted that the external funds and debt of the constrained and unconstrained Brazilian compa-nies systematically present greater negative sensitivity to cash flow than those of their US peers. This finding reinforces Khurana, Martin and Pereira’s (2006) and Baum, Schäfer and Talavera’s (2009) hypotheses that the
internal funds of companies subject to less developed financial environments are prone to displaying greater positive sensitivity to cash flow because of the degree of financial development and the characteristics of the fi-nancial architecture (in terms of the companies’ capabi-lities to access external funds).
5 FInaL consIderatIons
The present study aimed to test the empirical im-plications suggested by Almeida and Campello (2010) in Brazilian companies with respect to the effects of financial constraint and the resulting endogeneity of
cash flow and external funds). These authors suggest that if this negative relationship is larger in unconstrai-ned than in constraiunconstrai-ned companies, it cannot be asso-ciated with the presence of costly external funds and cannot therefore be interpreted as evidence of behavior in accordance with the Pecking Order Theory.
The results from this study reveal that the sensitivi-ty of external funds to cash flow is negative and statis-tically significant for the subsamples of both uncons-trained and consuncons-trained companies. Additional results show that the external funds of the constrained com-panies present lower sensitivity to cash flow than those of the unconstrained companies. Finally, the internal funds of the constrained companies show a positive sensitivity to cash flow, whereas those of the uncons-trained companies do not suggest significant and sys-tematic behavior. The results were not susceptible to the econometric specifications and to the classification criteria.
These findings also maintain correspondence with the study of Almeida and Campello (2010). Thus, we can state that in companies subject to high external fi-nancing costs (constrained companies), the endogenei-ty of the investment makes internal and external funds more complementary than substitutive. This finding reasonably explains the behavior not explained by the Pecking Order Theory.
The present study also maintains theoretical corres-pondence with Khurana, Martin and Pereira’s (2006) and Baum, Schäfer and Talavera’s (2009) hypotheses that the positive sensitivity of internal funds to cash flow is conditioned by the financial system’s structure and degree of development. The results of this study show that financial policies are more sensitive to cash flow among Brazilian companies than among US com-panies. This conclusion suggests that Brazilian compa-nies invest greater effort into adjusting their financial policies to reduce the possibility of underinvestment.
This study helps to address the gap between capital structure theories and the behavior commonly repor-ted in the literature as associarepor-ted with the Pecking Or-der Theory and as contrary to the static trade-off the-ory: the negative relationship between cash flow and external funds. The fact that this study corroborates the evidence of Almeida and Campello (2010) indicates the explanatory inadequacy of these theories. The gap is addressed when the dynamic trade-off emerges as a theory with explanatory power regarding the behavior addressed in this study.
The dynamic trade-off theory explains how a nega-tive relationship occurs between internal and external funds in unconstrained companies when, according to the arguments of Modigliani and Miller (1958), they should present indefinite behavior. According to the
theory, the adjustment costs of capital structure can cause companies behaving optimally to not adjust their capital structures (i.e., maintain low debt levels) if the costs of adjusting the level of debt exceed the costs of maintaining a sub-optimal capital structure (Hennessy and Whited, 2005). In this direction, Strebulaev (2007) suggests that companies do not adjust their capital structures frequently because of market frictions.
In Brazil, studies involving dynamic trade-off are still incipient, but a few studies, such as those of Rocha and Amaral (2007) and Machado and Maia (2009), have presented evidence of the importance of adjustment costs in determining the capital structure. Similarly, no known studies in Brazil have explored the joint interac-tion between investments and funding decisions while considering the dynamic trade-off theoretical approach in an underinvestment risk context in the same manner as the international studies of Hennessy and Whited (2005) and Harford, Klasa and Walcott (2009). This study helps to fill this gap in the national literature.
Therefore, the present study contributes to the na-tional literature on financial restrictions and capital structures. For analyses of financial constraints, this study contributes by successfully applying classification criteria concerning the degree of financial constraints to companies. Brazilian studies have found
difficul-ties in establishing consistent classification criteria a
priori concerning the degree of financial constraints to companies (Aldrighi and Bisinha, 2010; Costa and Paz, 2004; Hamburger, 2004; Zani and Procianoy, 2005).
The present study also contributes to the unders-tanding of how corporate and environmental charac-teristics affect companies’ capabilities to meet their investment opportunities fully. In fact, the presence of financial frictions not only affects the real economy by quantitatively reducing investments but also chan-ges the qualitative aspects of the investments (Almei-da, Campello and Weisbach, 2011; Crisóstomo, 2009) if constrained companies prioritize investments with better payback and with the ability to generate colla-teral. Therefore, understanding corporate behavior in the face of financial frictions allows us to estimate more accurately the level and profile of the investments made by companies in the economy.
as-Aldrighi, D. M., & Bisinha, R. (2010, Janeiro-Março). Restrição inanceira em empresas com ações negociadas na Bovespa. RBE, 64 (1), 25-47. Almeida, H., & Campello, M. (2007, April). Financial constraints, asset
tangibility, and corporate investment. he Review of Financial Studies, 20 (5), 1429-1460.
Almeida, H., & Campello, M. (2010, June). Financing frictions and the substitution between internal and external funds. Journal of Financial and Quantitative Analysis, 45 (3), 589-622.
Almeida, H., Campello, M., & Weisbach, M. S. (2004). he cash low sensitivity of cash. Journal of Finance, 59, 1777-1804.
Almeida, H., Campello, M., & Weisbach, M. S. (2011). Corporate inancial and investment policies when future inancing is not frictionless.
Journal of Corporate Finance, 17 (3) 675-693.
Bastos, D. D., Nakamura, W. T., & Basso, L. F. C. (2009, Novembro-Dezembro). Determinantes da estrutura de capital das companhias abertas na América Latina: um estudo empírico considerando fatores macroeconômicos e institucionais. RAM, 10 (6).
Baum, C. F., Schäfer, D., & Talavera, O. (2009, February). Impact of inancial structure on irm’s inancial constraints: a cross-country
analysis. Recuperado em 02 fevereiro, 2009, de http://www.ssrn.com/
abstract=1431344.
Bekaert, G., & Harvey, C. R. (2002, September). Research in emerging
markets inance: looking to the future. Recuperado em 20 março, 2009,
de http://www.papers.ssrn.com/sol3/ papers.cfm?abstract_id=795364. Bernanke, B., & Gertler, M. (1989). Agency cost, net worth, and business
luctuations. American Economic Review, 79 (1), 14-31. Bruni, A. L. (2002). Globalização inanceira, eiciência informacional
e custo de capital: uma análise das emissões de ADRS brasileiros
no período 1992-2001. Tese de doutorado, Departamento de
Administração, Universidade de São Paulo, São Paulo, SP, Brasil. Costa, C. M., & Paz, L. S. (2004). Are Brazilian irms savings sensitive to
cash windfalls? Anais do Encontro da Associação Nacional dos Centros
de Pós-Graduação em Economia - ANPEC, João Pessoa, Niterói, RJ,
XXXII.
Costa, C. M., Paz, L. S., & Funchal, B. (March-August, 2008). Are Brazilian irms savings sensitive to cash windfalls? Brazilian Business Review, 5 (2), 136-142.
Crisóstomo, V. L. (2009, Maio-Agosto). Diiculdades das empresas brasileiras para inanciar seus investimentos em capital físico e em inovação. Revista de Economia Contemporânea, 13 (2), 259-280. Dittmar, A., Mahrt-Smith, J., & Servaes, H. (2003). International
Corporate Governance and Corporate Cash Holdings. Journal of
Financial and Quantitative Analysis, 38, 111-134.
Erickson, T., & Whited, T. M. (2000). Measurement Error and the Relationship between Investment and Q. Journal of Political Economy, 108 (5), 1027-1057.
Fama, E., & French, K. (2002). Testing tradeof and pecking order predictions about dividends and debt. Review of Financial Studies, 15, 1-33.
Faulkender, M. (2002, March). Cash holding among small businesses. Recuperado em 01 dezembro, 2008, de http://www.papers.ssrn.com/ sol3/papers.cfm?abstract_id=305179.
Faulkender, M., & Wang, R. (2006). Corporate Financial Policy and the Value of Cash. Journal of Finance, 61, 1957-1990.
Fazzari, S. R., Hubbard, G., & Petersen, B. (1988). Financing constraints and corporate investment. Brooking Papers on Economic Activity, 1, 141-195.
Fazzari, S. R., & Petersen, B. (1993). Working capital and ixed investment: new evidence on inancing constraints. RAND Journal of Economics, 24, 328-342.
Frank, M., & Goyal, V. (2003). Testing the pecking order theory of capital structure. Journal of Financial Economics, 67, 217-248.
Futema, M. S., Basso, L. F. C., & Kayo, E. K. (2009). Estrutura de capital, dividendos e juros sobre o capital próprio: testes no Brasil. Revista Contabilidade & Finanças, São Paulo: USP, 20 (49), 44-62.
Hamburger, R. R. (2004). O efeito da variação do luxo de caixa nos investimentos corporativos no Brasil. Anais do Encontro Nacional dos
Programas de Pós-Graduação em Administração - EnANPAD, São
Paulo, Rio de Janeiro, RJ, IV.
Harford, J., Klasa, S., & Walcott, N. (2009, July). Do irms have leverage target? Evidence from acquisitions. Journal of Financial Economics, 93 (1), 1-14.
Hennessy, C. A., & Whited, T. M. (2005). Debt dynamics. Journal of Finance, 60 (3), 1129-1165.
Hubbard, R. G. (1998). Capital Market imperfections and investment.
Journal of Economic Literature, 36, 193-227.
Iquiapaza, R. A., Lamounier, W. M., & Amaral, H. F. (2008). Assimetria de informações e pagamento de dividendos na Bovespa. Advances in Scientiic and Apllied Accounting, 1 (1), 1-15.
Jensen, M. (1986). Agency costs of free cash low, corporate inance, and takeovers. American Economic Review, 76, 323-29.
Jensen, M. C., & Meckling, W. H. (1976). heory of the irm: managerial behavior, agency cost and ownership structure. Journal of Financial
Economics, 3, 305-360.
Kalcheva, I., & Lins, K. V. (2007). International evidence on cash holdings and expected managerial agency problems. Review of Financial Studies, 20, 1087-1112.
Khurana, I. K., Martin, X., & Pereira, R. (2006, December). Financial development and the cash low sensitivity of cash. Journal of Financial and Quantitative Analysis, 41 (4), 787-808.
Kiyotaki, N., & Moore, J. (1997). Credit cycles. Journal of Political
Economy, 105, 211-248.
Koshio, S., & Cia, J. N. de S. (2004). he determinants of corporate cash holdings: a comparation between Brazilian and US irms. Anais do Encontro Brasileiro de Finanças - EBFin, São Paulo, IV.
La Porta, R., Lopez-de-Silanes, F., Shleifer, A., & Vishny, R. (1998). Law and inance. Journal of Political Economy, 106, 1113-1155.
La Porta, R., Lopez-de-Silanes, F., Shleifer, A., & Vishny, R. (1999). Legal determinants of external inance. Journal of Finance, 12, 1131-1150. Leal, R. P. C. (2008, Outubro-Dezembro). Estrutura de capital comparada:
Brasil e mercados emergentes. RAE, 48 (4), 67-78.
Machado, G. L. B., & Maia, M. V. (2009). Custos de ajustamento e a dinâmica da estrutura de capital em empresas brasileiras. Anais do Encontro Brasileiro de Finanças - EBFin, São Paulo, IX.
Medeiros, O. R. de, & Daher, C. E. (2008, Janeiro-Março). Testando teorias alternativas sobre estrutura de capital nas empresas brasileiras. RAC, 12 (1), 177-199.
Modigliani, F., & Miller, M. H. (1958, June). he cost of capital, corporate inance and the theory of investment. American Economic Review, 48, 261-280.
Myers, S. C. he capital structure puzzle. (1984). Journal of Finance, 39, 575-592.
Myers, S. C., & Majluf, N. S. (1984, June). Corporate inancing and investment decisions when irms have information that investors do not have. Journal of Financial Economics, 13, 187-222.
Nakamura, W. T. et al. (2007, Maio-Agosto). Determinantes de estrutura de capital no mercado brasileiro – análise de regressão com painel de dados no período 1999-2003. Revista Contabilidade & Finanças, 44, 72-85.
Rocha, F. D., & Amaral, H. F. (2007). A explicação da escolha da estrutura de capital por modelos de ajuste parcial: uma aplicação no Brasil.
Anais do Encontro Nacional dos Programas de Pós-Graduação em
Administração - EnANPAD, Rio de Janeiro, RJ, XXXI.
Shyam-Sunder, L., & Myers, S. (1999). Testing static tradeof against pecking order models of capital structure. Journal of Financial
Economics, 51, 219-244.
Silva, A. H. C. (2008). Escolha de práticas contábeis no Brasil: uma análise
sob a ótica da hipótese dos Covenants Contratuais. Tese de doutorado,
Programa de Pós-Graduação em Ciências Contábeis, Universidade de São Paulo, São Paulo, SP, Brasil.
references
sumptions underlying the theoretical arguments of this study: net assets can be collateralized. For such assets to be collateralized, contractual covenants with adhe-rents and effective enforcement are needed. According
Stigliz, J. E., & Weiss, A. (1981, June). Credit rationing in market with imperfect information. he American Economic Review, 71 (3), 393-410.
Strebulaev, I. A. (2007). Do tests of capital structure theory mean what they say? Journal of Finance, 62, 1747-1787.