INTRODUCTION
The preparation of ceramic surfaces by grinding and polishing inevitably introduces flaws in the form of surface-breaking cracks. These flaws are likely to influence the strength of components and the wear behaviour of their surfaces. Flaw sizes can be measured by Hertzian indentation [1-8], by measuring the loads required to initiate ring cracks from surface flaws and the radii of the ring cracks formed.
The resistance to erosion, wear, machining and grinding of polycrystalline alumina generally shows an inverse correlation to fracture toughness [9-13]. However, the toughness relevant to such processes is that probably associated with relatively short cracks (of the order of a few microns); fracture toughness values derived from bend or Vickers indentation tests may overestimate the small-scale toughness due to the T-curve (R-curve) effect. This effect is strong in alumina specimens with larger grain sizes and lower contents
Surface mechanical analyses by Hertzian indentation
(Análises mecânicas de superfície via indentação Hertzian)
A. Franco Jr.
1, S. G. Roberts
21
Núcleo de Pesquisa em Química, Universidade Católica de Goiás
C. P. 86, Setor Universitário, 74605-010, Goiânia, GO, Brazil
[email protected]
2
Department of Materials, University of Oxford, Parks Road, OX1 3PH, Oxford, UK
of grain-boundary glassy phase [14-17]. The use of conventional fracture toughness evaluations to predict resistance to wear, erosion, and machining may lead to incorrect choices of materials for such applications.
Fracture toughness may be determined from Hertzian tests by measuring the minimum load, Pmin, necessary to propagate cracks in a set of tests [18] on abraded samples (i.e., ones with a high surface flaw density). The test method uses flaws a few microns deep, and so gives results relevant to wear and erosion properties.
Here we present surface flaw sizes of polished polycrystalline alumina specimens, with G=1.2, 3.8 and 14.1 µm, determined using the Hertzian indentation method [6-8, 18], and fracture toughness values determined by the Hertzian method. These fracture toughness values are compared to those derived from Vickers indentation tests. The results are also compared to the rates of wet erosive wear for the same materials.
Abstract
Hertzian indentation technique was used to measure surface flaw sizes on polished dense polycrystalline alumina specimens with grain sizes G = 1.2, 3.8 and 14.1 µm. Two surfaces finishes were studied: well-polished (Syton) and coarse-polished (45 µm diamond paste). Flaw sizes depended on the surface finish and increased with increasing grain size. Fracture toughness (KIc) for each material (relating to the propagation of flaws of a fewµm depth) was determined from the minimum fracture load in a series of Hertzian tests. KIc values were 3.58, 3.45 and 2.96 MPam1/2 for G=1.2, 3.8 and 14.1µm, respectively. Fracture toughness values were also determined by Vickers indentation over a range of loads; the KIc values determined from the Hertzian tests were consistent with the trends in KIc with crack size from the Vickers indentation tests.
Keywords: surface, Hertzian indentation, flaw size, alumina.
Resumo
A técnica de indentação Hertziana foi usada para medir o tamanho das trincas nas superfícies de amostras densas de alumina policristalina de grão G = 1,2, 3,8 e 14,1µm. Duas superfícies foram estudas quando ao polimento: uma bem polida (Sayton) e a outra mal polida (pasta de diamante de 45µm). O tamanho das trincas dependem de como a superfície foi polida e aumenta com o aumento do tamanho dos grãos da amostra. A tenacidade (KIc) de cada material (relacionada a propagação de trincas da ordem de alguns microns de dimensão) foi determinada através da carga mínima de fratura obtidos em uma série de ensaios Hertziana. Os valores de KIc foram 3,58, 3,45 e 2,96 MPam1/2 para G = 1,2, 3,8 e 14,1 µm,respectivamente. Os valores da tenacidade também
foram determinados através da indentação Vickers para várias cargas. Os valores de KIc determinados pela indentação Hertziana foram consistentes com o tamanho das trincas associadas aos valores de KIc por indentação Vickers.
Theoretical background - Hertzian indentation
The Hertzian indentation test is an alternative to the familiar Vickers indentation test for evaluation of the fracture properties of brittle materials. A great advantage of the Hertzian indentation test is that the deformation in the substrate produced by the indenter is wholly elastic until fracture occurs. This means that the complications associated with the residual stresses in Vickers indentation test do not exist. The stress field is independent of the plasticity properties of the substrate and varies continuously and smoothly near to the contact area. The contact stress field is not substantially affected by minor defects in the indenter geometry. The stress state induced can be found rigorously and exactly [19].
On the other hand the Hertzian indentation test has some drawbacks. The stress fields have steep gradients in depth, thus it is difficult to accurately estimate the stress intensity factors for cracks driven by Herztian loads. The principal data needed are the loads at which small flaws (pre-existing in the surface) extend immediately to ring or ring/cone cracks and the diameter of the ring crack. The load is readily detectable by acoustic emission. The ring cracks produced cannot easily be observed in opaque materials (but with chemical etching this problem can be reduced). The results of the analysis are very sensitive to the value of Poisson’s ratio of the substrate [8]. If the indenters and the substrates are made of elastically dissimilar materials there is an elastic mismatch and friction in the contacts can alter the stress fields, complicating the analysis. Also the coefficient of friction must be determined. Below is a summary of the main aspects of the theory of Hertzian fracture. This includes a method for determing the fracture toughness, KIc, surface flaw sizes and densities of brittle materials.
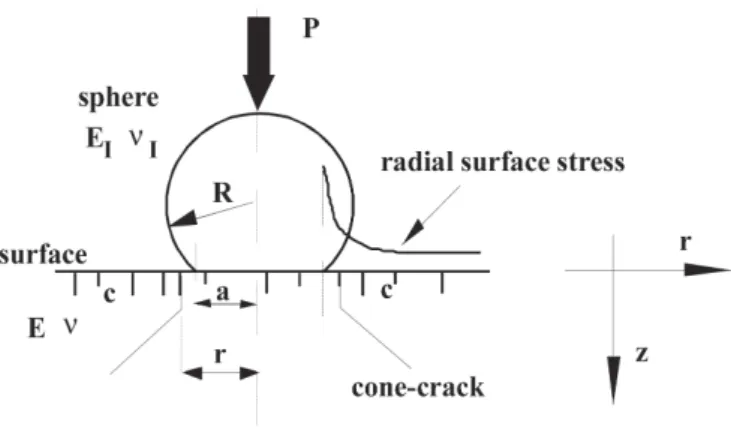
Fig. 1 shows schematically the geometry of Hertzian indentation. When a hard sphere of radius R, elastic modulus EI and Poisson’s ratio, is pressed normally with a load P into a flat surface of a substrate with elastic modulus E and Poisson’s ratioνΙ,the radius of the contact area formed between the sphere and the flat surface is given by [20]:
(A)
where
(B)
If the sphere and the substrate are made of the same material (i.e., same elastic constants) the contact is then free of radial shear traction, so the resulting radial contact pressure distribution
in the surface under the sphere is elliptical and is given by [21]:
(C)
where the peak contact pressure under the sphere, Po, is
(D)
and the radial co-ordinate, r, is normalized with respect to the contact radius, a.
The elastic stress field induced in the substrate by a such pressure distribution is complex and was first derived by [19] and in polar co-ordinates is given by:
(Ea)
(Eb)
(Ec) Figure 1: Schematic diagram of Hertzian indentation.
(Ed)
(Ee)
where u is a positive root of the equation
(Ef)
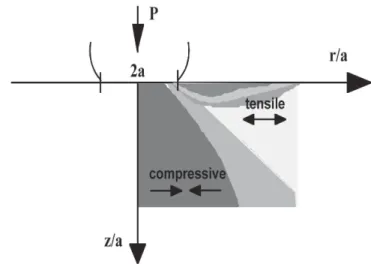
Fig. 2 shows the contours of the most positive principal stress normalized to the peak Hertzian pressure (equation D) for elastically similar materials [6]. At the surface, under the contact area, the stress components are compressive except at very near to the edge of contact where the radial stress is tensile and has its maximum. Outside the contact area the surface stresses are radial tensile and circumferential compressive of equal magnitude. Note that in true Hertzian contact, where no surface shearing stress arises, the zone of tension is confined to a shallow annulus near to the surface.
Fig. 3 shows a schematic diagram of the zones under tensile and compressive radial stresses in a substrate under a Hertzian contact.
A typical Hertzian ring/cone crack forms when one pre-existing surface flaw located outside the contact area is subject to tensile stresses due to an applied load, P as shown in Fig. 1. As the applied load is increased the tensile stresses on the
crack increase until at a critical load (P = PF) the crack propagates along the circular principal stress trajectory to form a ring crack. As the load increases further the nucleated ring crack propagates downward and extends along the maximum principal stress trajectory, to form a frustum of a cone.
The ring crack formation is mainly controlled by the surface radial stress. The point of maximum tension σrr is at r = a, but because of the rapid decrease of σrr with depth this is not the position of maximum stress intensity factor for surface cracks of a finite depth. Argon et al. [22] reported cracks being located at a distance of 1.05 to 1.2 times the contact radius, a. The determination of KI (stress intensity factor) on surface cracks is detailed in the next Section.
Stress intensity factor, KI
In Hertzian contact the stress fields have a steep gradient in depth, thus it is difficult to accurately estimate the stress intensity factors for cracks driven by Herztian loads.
Nowell and Hills [23] employed the distributed dislocations method to develop a reliable, efficient and accurate method for solving the stress intensity factors for a short surface breaking crack (i.e., those whose depth is less than a/10) lying perpendicular to the free surface in steep gradients. This approach differs from previous work [24-29] where it was assumed that the crack path initially followed along the trajectory of the minimum principal stress, σ3. However, it is likely that small surface cracks (produced by polishing and grinding) lie perpendicular to the free surface, and only when they start to grow will they follow the minimum principal stress trajectory, σ3, (this path is normal to the maximum principal stress, σ1). This implies that the previous calculations may have overestimated the stress intensity factors, particularly for large flaws close to the contact area where the crack tip is far from the surface and hence experiences a complex state of stress.
Figure 2: Contours of the most positive principal stress normalized to the peak Hertzian pressure. Elastically similar contact. Poisson’s ratioν= 0.24. After Warren et al. [6].
[Figura 2: Contornos da mais provável do fator de tensão positivo normalizada em relação ao pico de pressão Hertziana. As superfícies em contato são elasticamente similares. Constante de Poisson,
ν= 0,24. [6].]
Figure 3. Tensile and compressive, σrr field in a substrate under a Hertzian load.
The method of distributed dislocations used by Nowell and Hills [23] for solving the mode I stress intensity factors relies on the availability of a closed-form solution for the stress field induced by a dislocation1 near to a free surface. They considered that a short plane crack of depth c, normal to the free surface, is placed close to the contact area. The state of stress in the crack’s absence is found. Thus when the crack is inserted, unsatisfied tractions appear along the line of the crack. These may be cancelled by the application of equal and opposite tractions along the crack faces, which may be generated by installing a distribution of dislocations. The state of stress induced by one of these dislocations is known and the expressions are given by Nowell [23]. Thus, the method consists of solving an integral equation in the dislocation density formed, which assumes that a line of the crack remains traction-free [23]. The integral equation cannot be inverted directly, but powerful numerical quadratures are available which is helpful to solve this problem. The integral equation is effectively represented by a set of linear algebric equations, typically 20 terms (i.e. inverting 20 simultaneous equations) which can be solved by using a standard computer library routine for solution of simultaneous equations. If the radial stress is expressed in terms of the peak Hertzian pressure, po, (Equation D), the result of the calculation is a number µ which is related to the (dimensional) mode I stress intensity factor , KI, by [8]:
(F)
Re-normalizing the above expression with respect to the contact radius a, the dependence of KI is now exclusively on two terms: crack depth c andνas:
(G)
A comprehensive study of the variation of the stress intensity factor with ν, c/a and r/a (Equations G and H) was carried out by Warren et al. [6] and Warren [7]. The results for the case where the indenter and the substrate are made of elastically similar materials are summarized as following.
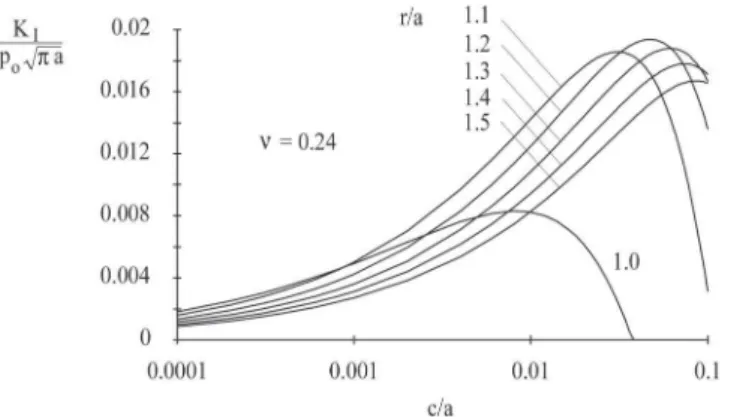
Fig. 4 shows the normalized mode I stress intensity factor (KI) as a function of normalized crack length (c/a) for six normalized crack positions (r/a), for Poisson’s ratio,ν= 0.24. KI has a maximum value as a function of c/a for each r/a; furthermore for large cracks situated close to the contact radius the implied value of KI is negative because the crack tip is now deep enough that it lies within the compressive region of the Hertzian radial stress. For a fixed normalized fracture
toughness, KI, value and a fixed normalized crack position, r/a, there are two possibilities: (1) KI < KIc, which means that the fracture criterion is not satisfied, thus fracture never occurs. (2) KI = KIc, which means that the fracture criterion may be satisfied for two different crack sizes (c1/a<c2/a). The smaller one c1/a, corresponds to an unstable fracture, thus rapid fracture will occur. It will grow unstably to size c2/a. The larger one, c2/a, corresponds to stable fracture because this crack is already at or near by a compressive stress zone in which it is difficult for the crack to grow. Therefore c1/a is the most likely crack to grow unstably into a ring crack system and be detected by acoustic emission (see later).
Fig. 5 shows the values for the normalized KI as a function
of crack position, r/a for six values of c/a whenν=0.24. For all crack depths analysed the maximum value of KI occurs at a value of r/a greater than unity. This explains why the ring crack is always formed outside the contact area even though the surface tensile stress has its maximum at the edge of the contact area. This fact has been observed previously by Warren [26], Mouginot et al. [29], and Finnie [30]. The explanation
1 Note that, here, dislocation near to a free surface represents a
nucleus of strain and is not related in any way to a real lattice defect.
Figure 4: Normalized mode I stress intensity factor as a function of normalized crack length (c/a) for six normalized crack positions (r/ a), for Poisson’s ratio,ν= 0.24. After Warren et al. [6].
[Figura 4: Fator de intensidade de tensão normalizado modo I em função do tamanho normalizado da trinca (c/a) das seis localizações normalizadas das trincas (r/a), constante de Poisson,ν= 0,24 [6].]
Figure 5: Normalized KI as a function of crack position, r/a for six values of c/a whenν= 0.24. After Warren et al. [6].
of this effect presented here [26] supersedes that of Argon [1-2]. Note that for a flaw of finite length, a position slightly closer results in a lower value of stress intensity because the flaw extends down into the decreasing (and ultimately compressive) radial stress field.
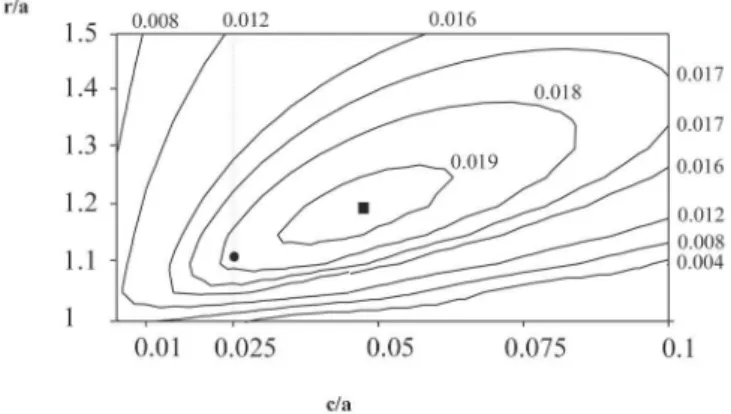
Fig. 6 shows a contour plot of the mode I normalized stress intensity factor, KI/(po√πa), as a function of normalized crack position, r/a, and normalized crack depth, c/a. For each crack depth c/a, the position of the largest normalized KI can be marked; this is shown by the filled circle for c/a = 0.025. At this position, r/a ~1.1, KI is ~ 0.0182po(πa)1/2; 0.0182/(0.025)1/2 = 0.1151 (Equation G) is therefore the maximum value of µ(=µmax) for this value of c/a (c/a =0.025). µmax is just a function of crack depth, c/a and Poisson’s ratio of the substrate, ν. KI has an absolute maximum value (marked by the filled square) at c/a ~ 0.046, r/a ~ 1.18, KI ~ 0.0193po(πa)1/2. The existence of the absolute maximum value in the stress intensity factor at a given load is very important because it provides a method for determining the value of the fracture toughness of the substrate, as proposed by Warren et al. [18]. This is described in detail in the following section.
Determination of fracture toughness, KIc
At the fracture condition KI = KIc , the expression for mode I stress intensity factor (Equations F and G) can be rewritten in terms of loads (P = PF) by using Equations B and D as:
(H)
Define a normalized fracture load, PFN as:
(I)
If the surface of the substrate has a dense flaw distribution, there will be a flaw (of size c/a) situated close to the position where the crack-tip stress intensity experienced is a maximum (µ = µmax). This flaw will propagate (to form either a ring or the complete ring/cone system) when K= KIc which corresponds to a fracture load PF. Hence, the minimum load necessary to propagate a ring crack, PFN, is:
(J)
These values of normalized fracture loads are therefore the minimum loads necessary to propagate cracks of size c/a. In Fig. 7 is shown a plot of the minimum normalized fracture loads, PFN,as function of c/a. For all values of Poisson’s ratio (for five different values of ν) there is an absolute minimum in the normalized fracture load for c/a values in the range 0.02 - 0.06. For a given ν, this absolute minimum in PFN corresponds to the absolute maximum in KI/(po√πa), in Fig. 4. The RHS of Equation H can then be determined. For example, take ν= 0.24 (Poisson’s ratio for polycrystalline alumina). For
ν= 0.24 in Figure 6 the absolute minimum in KI/(po√πa) is 0.01937. Then substituting this value in Equation G gives
µmax = 0.01937. Therefore the absolute minimum in normalized fracture load, Equation J, PFN,min = π/3/(0.01937)2 ~ 2790. Note that PFN,min is a dimensionless number that depends only on the Poisson’s ratio of the substrate (in this case ν=0.24), and therefore is a material constant. Equation J can now be rewritten in terms of this constant, C, as:
(K)
The values of C for several Poisson’s ratio ranging from 0.10 to 0.35 can be extracted from Table I in Warren [18]. For alumina, ν= 0.24 and C = 2740, as outlined above.
In summary, this method is based on the concept that when KI for one small surface flaw, c/a, reaches KIc (at a load P= PF) it begins to grow to form either a ring crack or the well known ring/cone system. The method consists of searching for a minimum value of fracture load (at which KI = KIc) in a series of Hertzian tests performed by a given sphere of radius R. It is assumed that the crack propagated in this test (by a minimum fracture load, Pmin) is of a size within the range where a Figure 6: Contour plot of mode I normalized stress intensity factor,
KI/(po√πa), as a function of normalized crack position, r/a, and normalized crack depth, c/a. The filled circle shows the maximum value for c/a = 0.025 (at this position r/a~1.1), KI ~ 0.0182 po√πa. The filled square corresponds the position of the absolute maximum of KI ~ 0.01937 po√πa, at c/a ~ 0.046, r/a ~ 1.18. After Warren et al. [8].
normalized fracture load shows a minimum with c/a (within in 0.02-0.06, Fig. 7). Therefore the fracture toughness, KIc, can be determined by
(L)
where Pmin, is the minimum load necessary to propagate pre-existing surface flaws (to form ring cracks) in a set of Hertzian tests. C is a material constant whose magnitude depends only onν, and R is the radius of the indenter.
However, the Hertzian indentation method for determing KIc is not without drawbacks [18]. For instance the crack extension must be sufficiently rapid to be detected by the acoustic emission transducer [31]. Of course if an acoustic emission transducer is not available then the detection of the minimum load must be done by trial and error. Also the substrate must crack before the indenter (sphere) does. The method is limited to the case where the substrate and the indenter are made of same material (to avoid elastic mismatch
between the sphere and the substrate). However, the method is comprehensive in that it can be applied to sphere and substrate made of any material (with any value of Poisson’s ratio, as in Table I in Warren [18].
EXPERIMENTAL PROCEDURE
Sample fabrication
Polycrystalline alumina materials of grain size G = 1.2, 3.8 and 14.1 µm were fabricated using high purity, 99.9%,
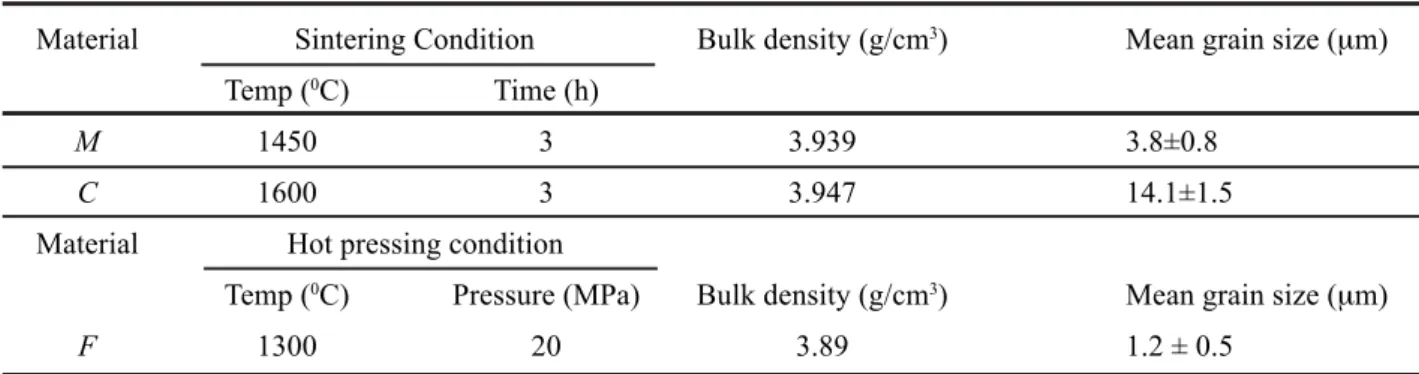
α-Al2O3 powder (Sumitomo AKP-50, Japan) of mean particle size ca. 180 nm. Alumina specimens of G= 1.2 µm (referred to later as “F”) were produced by hot-pressing the powder in a 25 mm diameter graphite die at 20 MPa and 1300 0C for 30 minutes. Specimens of grain size of 3.8 µm (“M”) and 14.1 µm (“C”) were produced by pressureless sintering, in air of powder discs 37 mm diameter, which had been uniaxially pressed at 50 MPa in a stainless steel die and then cold isostatically pressed at 300 MPa. The sintering conditions and characteristics of the hot-pressed alumina specimens are shown in Table I.
Surface preparation
Dense polycrystalline alumina discs of 25 mm diameter, 6 mm thickness (material F) and 37 mm diameter, 6 mm thickness (materials M and C) were cut using a high speed diamond saw (CAPCO Q35)2. Specimens were ground with 600-grit SiC slurry using a Logitech PM2A polishing machine3, and polished with 6 µm polycrystalline diamond powder4 in distilled water. Specimens of two types of surface finish were prepared for testing:
1) “Well-polished” specimens were finished with Syton W30 colloidal silica5, (125 nm average particle size, pH 10.2, on a soft cloth for ~10 hours. Syton is thought to polish Al2O3 by forming a soft thin layer of hydrated material which SiO2 particles remove from the specimen surface. The resulting surface is of high quality, with very few grain pullouts.
2) “Coarse-polished” specimens finished with a cloth impregnated with 45 µm diamond paste. The resulting surface is of poor quality with many grain pullouts.
Material Sintering Condition Bulk density (g/cm3) Mean grain size (µm)
Temp (0C) Time (h)
M 1450 3 3.939 3.8±0.8
C 1600 3 3.947 14.1±1.5
Material Hot pressing condition
Temp (0C) Pressure (MPa) Bulk density (g/cm3) Mean grain size (µm)
F 1300 20 3.89 1.2 ± 0.5
Table I - Sintering and hot-pressing conditions and characteristics of polycrystalline alumina specimens.
[Tabela I - Condições de sinterização e caracterização das amostras policristalinas de alumina.]
Figure 7: Minimum normalized fracture load necessary to propagate a crack of normalized size c/a. After Warren [18].
Hertzian indentation tests
Hertzian indentation tests were performed using a CK10 testing machine6. The indenter was an alumina sphere of radius R = 2.5 mm , elastic constants E = 390 MPa and ν= 0.24. A wide band acoustic emission transducer was mounted in the loading train to detect the growth of a pre-existing surface flaw into a ring crack. A series of tests, at a constant loading speed of 0.14 mm/min were performed on each specimen. For specimens F, M and C, 67, 84 and 62 indentations were performed, respectively. The fracture loads were recorded and the corresponding ring crack diameters were measured using an optical microscope. The ring cracks formed on the well-polished specimen F were very well defined and easily visible. Those on well-polished specimens M and C were less easy to measure. These specimens were etched in potassium hydroxide (KOH) at 300 ºC for ca. 3 min, and polished with a cloth impregnated with 1 mm diamond paste to remove a thin layer of residual etched material; after this treatment, the ring cracks were easily visible. The ring cracks formed on coarse-polished specimens were neither very well defined and nor easily visible. These specimens were also etched in potassium hydroxide (KOH) but at 400 ºC for ca. 4 min, and polished with a cloth impregnated with 1 µm diamond paste to remove a thin layer of residual etched material; after this treatment, the ring cracks were visible.
Flaw sizes and flaw densities were determined according to the methods described by Warren et al. [7, 8].
Fracture toughness, KIc for each specimen was determined by
KIc (M)
where Pmin, is the minimum load necessary to propagate pre-existing surface flaws (to form ring cracks), C is a materials constant whose magnitude depends only on ν (for alumina, C=2790 [18]), R is the radius of the indenter (alumina sphere). E* is given by:
(N)
where E and νare the elastic constants of the indenter and the specimen (both made of the same material).
The cumulative probability of failure for each specimen was determined by:
(O)
where n is the order number of the data (ranked in order of ascending fracture loads) and N is the total number of test data.
Vickers indentation tests
Vickers indentation tests were performed using a Vickers pyramid hardness tester. A series of tests with loads ranging from 4.91 N to 245.3 N was performed on the specimens F,M
and C.
The hardness (Hv) was calculated by:
(P)
where P is the applied load (N) and 2a is the impression diagonal (µm) measured using an optical microscope with a curtain eyepiece.
The fracture toughness was calculated using the equation of Anstis et al [32]:
KIc (Q)
where E is the Young’s modulus (E= 390 GPa), Hv is the hardness (GPa), P is the applied load (N) and c is the crack length (µm).
RESULTS AND DISCUSSION
Ring cracks
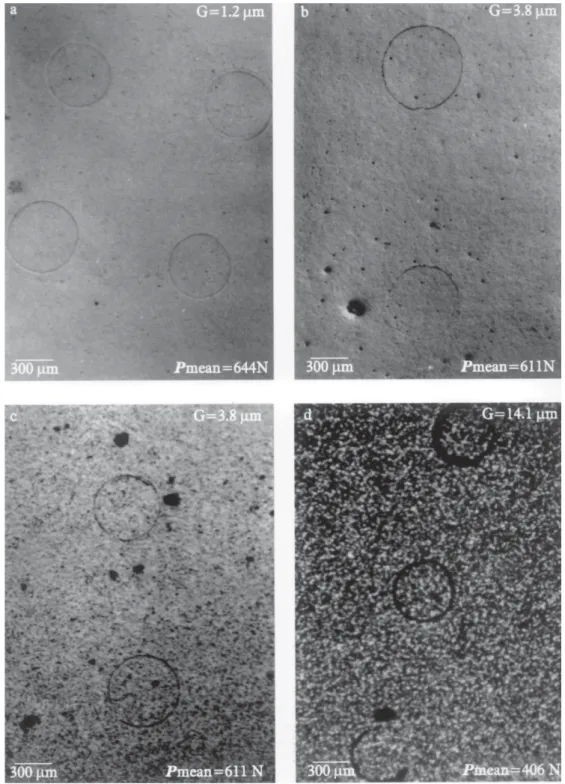
Typical Hertzian ring cracks formed on polycrystalline aluminaspecimens are shown in Fig. 8. The ring cracks on specimens (a) G= 1.2 µm and (b) G= 3.8 µm were easily visible. For specimens (d) G= 14.1 µm the ring cracks were just visible after KOH etching. The thickness of the line of the ring crack slightly changes (~2-3%) after etching; this does not affect the accuracy of the measurements of ring cracks after etching. For example, take specimens G= 3.8 µm, compare the typical thickness of the line of the ring cracks after KOH etching (c) to those not etched (b). The fact that for specimens of G=14.1 µm the line of the ring cracks are not visible (before KOH etching) in optical microscope may be attributed to the combined effects of the ring crack line being 2CAPCO, precision cutting machine, manufactured by
KAYEX-CAPCO, Ipswich, UK.
3Logitech, Erskine Ferry Road, Old Kilpatrick, Glasgow G60 5EU,
UK.
4Polycrystalline diamond, Lot OCON-281, Logitech, Erskine Ferry
Road, Old Kilpatrick, Glasgow G60 5EU, UK.
5Syton colloidal silicas, grade W30, provided by Morrisons
Chemicals, 331-337 Derby Road, Liverpool L20 8LQ, UK.
6Engineering Systems (Nottm), 1 Loach Court, Radford Bridge Road,
totally closed and the less light been reflected from the surface of the coarse grained specimens.
Flaw sizes
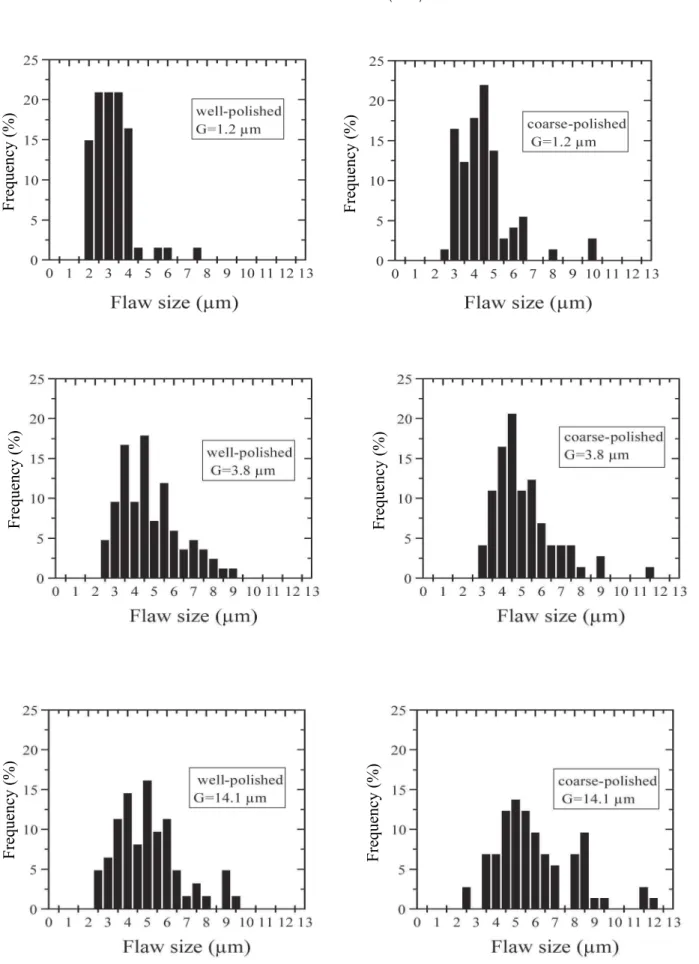
A histogram of flaw size for each specimen is shown in
Fig. 9. In Fig. 9 the left column refers to well-polished specimens, whereas the right column to coarse-polished specimens. For well-polished specimens F, flaw sizes range from 2 to 7.5 µm, while for well-polished specimens M, flaws range from 2.5 to 9 µm and for specimens C, flaw sizes range from 2.5 to 9.5 µm. For coarse-polished specimens F (Fig. 9), Figure 8: Typical Hertzian ring cracks produced on well-polished polycrystalline alumina specimens. Indenter, alumina sphere radius R=2.5 mm. (a) G=1.2µm, (b-c) 3.8 µm and (d) 14.1 µm. The ring cracks on (c) and (d) after KOH etching.
Figure 9: Frequency of detection of surface flaws of various depths as determined by Hertzian indentation tests on well-polished (left side) and on coarse-polished (right side) specimens. (a) G= 1.2 µm, (b)G= 3.8 µm and (c) G= 14.1 µm.
[Figura 9: Freqüência de ocorrência das trincas de superfícies de vários tamanhos determinadas pela indentação Hertziana em amostras bem polidas (lado esquerdo) e mal polidas (lado direito). (a) G = 1,2µm, (b) G = 3,8 µm e (c) G = 14,1 µm.]
F
re
que
nc
y (%)
F
re
que
nc
y (%)
F
re
que
nc
y (%)
F
re
que
nc
y (%)
F
re
que
nc
y (%)
F
re
que
nc
Figure 10: Grain boundary cracks, cgb and grain cracks, cg near to the surface of a ceramic material and limited approximately to a grain dimension. (Adapted from Davidge [33]). Note the absence of defects (e.g. pores) on the structure.
[Figura 10: Trincas no contorno do grão, cgb e trincas no grão, cg próximas da superfície de um material cerâmico cuja a dimensão é aproximadamente no máximo a dos grãos [33]. Note a ausência de defeitos (por exemplo, poros) na estrutura do material.]
Figure 11: Grain boundary cracks, cgb and grain cracks, cg near to the surface of a ceramic material. Note the presence of defects at the grain boundaries and in the grains. The crack penetration now is not limited to a grain dimension.
Figura 11: Trincas no contorno do grão, cgb e trincas no grão, cg próximas da superfície de um material cerâmico. Note a presença de defeitos no contorno dos grãos e no próprio grão. Neste caso o tamanho das trincas não é limitado somente a dimensão dos grãos.]
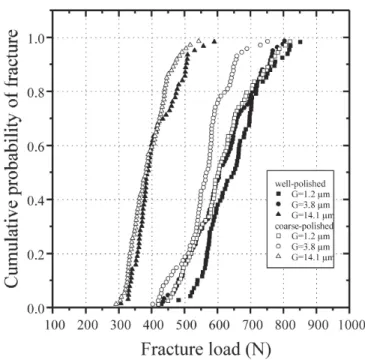
Figure 12: Cumulative probability of fracture versus fracture load for Hertzian indentation tests.
[Figura 12: Probabilidade cumulativa de ruptura em relação a carga de ruptura de ensaios de indentação Hertziana.]
flaw sizes range from 2.5 to 10.0 µm. For coarse-polished specimens M, flaws range from 3.0 to 11.5 µm and for specimens C, flaw sizes range from 2.5 to 12.0 µm.
Five important aspects to be noticed in the flaw size results are: (1) The frequency of detection of small flaws is higher for the fine grained material then for the coarse grained material. (2) The flaw size distribution is much broader for the coarse grained material.
(3) For a given grain size material the flaw distribution is much broader for the coarse-polished material.
(4) The surface flaw sizes in the fine-grained specimens are, in general, larger than the specimen grain size, while in coarse-grained specimens they are smaller than the specimen grain size.
(5) The difference between flaw sizes in well-polished specimens and coarse-polished specimens is small.
The findings (4) and (5) may be explained based on the fact that in general all ceramic materials (e.g. Al2O3) are likely to contain, apart from pores (open and/or closed), defects near to the specimen surface such as grain-boundary grooving (due to exposure to high temperature during fabrication). These grooves can concentrate stresses along the grain boundaries which require low energy for fracture [33, 34]. Also during a machining process (e.g. polishing), two types of defects, in the form of cracks, can be introduced to the specimen surface
which can propagate along the grain boundaries (referred later as cgb), or inside the grain (referred later as cg) as shown schematically in Fig. 10.
In has been generally assumed in the past that surface cracks propagate to about one grain dimension because the crack finds a natural barrier to further propagation. For the case of cgb cracks the natural barrier is the grain boundary, at a triple point, where the crack needs to change direction considerably; whereas in the case of cg cracks, the natural barrier is another grain which is not coplanar with the original crack. In this case the crack needs either to nucleate a new crack (in the next grain), or nucleate a new crack along the grain boundary, hence limiting crack propagation.
However, if one considers the effect of the defects mentioned above (mainly closed pores), which are present in the specimens in this work (see micrographs, Fig. 8 and [35]). Fig. 10, can be re-adapted by considering defects (e.g. pores) present at the grain-boundaries (triple points and two grains) and inside the grains as shown schematically in Fig. 11. Therefore the propagation of the same type of cracks, cgb and
cg, introduced during machining will be enhanced by these defects following maybe one of the directions suggested by the arrows in Fig. 11. Thus it is possible for cracks (cgb and cg) to penetrate in the bulk of the material distances more than one grain dimension.
Material
F M C Surface treatment
Pmean (N) 644±215 611±192 406±100 Syton
619±199 577±194 417±126 45 µm diamond
amean (mm) 180±8.12 176±9.24 154±7.86 Syton
176±9.18 172±7.46 151±7.18 45 µm diamond
rmean (mm) 204±8.62 222±14.92 194±11.04 Syton
218±19.26 217±16.22 212±26.78 45 µm diamond
cmean (mm) 2.94±0.93 4.53±1.51 4.78±1.68 Syton
4.20±1.40 4.83±1.54 5.76±2.03 45 µm diamond
Pmin (N) 454±26 427±8.0 317±11.0 Syton
434±15 411±9.0 298±6.0 45 µm diamond
KIC (MPam1/2) 3.66±0.10 3.55±0.03 3.06±0.05 Syton
3.58±0.06 3.45±0.04 2.96±0.04 45 µm diamond
Erosion Rate [35] 1.83±0.7 8.36±0.8 11.3±0.6
(nm/s)
Table II - Hertzian indenation results and erosion results.
[Tabela II - Resultados da indentação Hertziana e testes de desgastes erosivos.]
Figure 13: Fracture toughness determined by Hertzian and Vickers indentation versus crack length. Lines indicate the trend. Typical error bars are shown.
A similar trend of flaw sizes longer then average grain size was found by Anya and Roberts [36], who reported flaw sizes of up to 13 µm for specimens of polycrystalline alumina of grain sizes of 3.5 ± 1.5 µm with surface finished with 14 µm diamond. The lack of available data on sizes of flaws introduced by machining measured by Hertzian indentation methods or by other means for polycrystalline alumina materials and others ceramics makes further comparison difficult, but there is no evidence in the literature that surface cracks are as has been assumed, limited to the depth of a grain dimension.
On the other hand, Griffith’s flaws (e.g. flaws measured by Griffith’s equation by using fracture toughness (e.g. determined by Vickers indentation) and strength data (determined by four-point bend [33]) are usually much longer than grain sizes. For instance Carroll et al. [37] reported flaws size up to ~30 µm for alumina specimens with grain size of 5 µm. The fact that there are small differences between flaw sizes in well-polished specimens and coarse-polished specimens can be explained on the basis of how a surface flaw is detected in the Hertzian indentation method. As mentioned before in each Hertzian test only a flaw with a particular size (e.g. crack depth) at a particular position relative to the contact area will propagate to form a ring/cone crack for a given load, P = PF
(so that KI = KIc). For a coarse-polished surface there are likely to be many more flaws with a broader flaw size range, but only those of a size close to that for fracture at the minimum load, which depends only on elastic constants and test sphere size (indenter), are likely to be detected (S. G. Roberts, private communication, University of Oxford, 1996). Therefore the small difference between well-polished specimens and coarse-polished specimens in the sizes of flaws detected by the Hertzian indentation method is to be expected if the same sphere size (indenter) is used in all tests.
Fracture loads and fracture toughness
Fig. 12 shows the cumulative probability of fracture for each specimen. The minimum fracture load to propagate into Hertzian ring cracks , Pmin, is 454 ± 26, 427 ± 8.0 and 317 ± 11.0 N for well-polished specimens F, M and C, respectively whereas for coarse-polished specimens F, M and C is 434 ± 15, 411 ± 9.0 and 298 ± 6.0 N, respectively. Note that the minimum fracture load (which is used to determine KIc) is relatively well defined by the trend in results for tests on the coarse polished material, where there is a high density of flaws over a wide size range. For the well-polished specimens, the relative sparseness of the flaw distribution means that there is
Material Load Diagonal Crack length Hardness Toughness
P, (N) 2a, (µm) c, (µm) Hv, (GPa) KIc, (MPam1/2)
F 4.91 19.2 ± 0.5 21.3 ± 0.5 24.80 ± 1.5 3.16 ± 0.4
9.81 29.8 ± 0.2 36.5 ± 0.4 19.88 ± 0.5 2.95 ± 0.4
49.1 69.1 ± 0.5 114.5 ± 1.5 19.05 ± 0.3 2.89 ± 0.3
98.1 95.5 ± 1.7 179.2 ± 3.7 19.97 ± 0.1 2.89 ± 0.3
147.2 117.4 ± 0.4 235.7 ± 5. 7 19.81 ± 0.2 2.88 ± 0.2 196.2 137.5 ± 0.7 287.6 ± 19.2 19.24 ± 0.2 2.91 ± 0.3 245.3 152.1 ± 2.4 330.1 ± 20.8 19.66 ± 0.3 2.93 ± 0.2
M 4.91 20.3 ± 0.5 22.5 ± 0.4 22.23 ± 1.3 3.09 ± 0.3
9.81 29.8 ± 0.2 36.6 ± 0.3 18.92 ± 0.3 2.96 ± 0.4
49.1 70.1 ± 0.5 115.3 ± 6.6 18.51 ± 0.2 2.92 ± 0.2
98.1 96.3 ± 0.5 179.6 ± 2.6 19.61 ± 0.1 2.90 ± 0.1
147.2 120.1 ± 2.4 234.7 ± 7.3 18.94 ± 0.2 2.97 ± 0.4
196.2 139.9 ± 1.2 282.2 ± 9.7 18.57 ± 0.3 3.04 ± 0.3
245.3 154.8 ± 3.0 323.9 ± 14.5 18.98 ± 0.2 3.06 ± 0.1
C 4.91 21.89 ± 0.7 24.5 ± 0.3 19.02 ± 1.1 2.95 ± 0.4
9.81 31.2 ± 1.1 38.7 ± 1.6 18.76 ±1.3 2.96 ± 0.4
49.1 70.2 ± 0.5 115.1 ± 2.1 18.51 ± 0.2 2.91 ± 0.2
98.1 98.7 ± 0.5 179.4 ± 4.2 18.67 ± 0.1 2.98 ± 0.1
147.2 121.7 ± 0.6 238.9 ± 16.6 18.43 ± 0.2 3.01 ± 0.2 196.2 140.9 ± 0.8 278.8 ± 18.2 18.31 ± 0.4 3.14 ± 0.2 245.3 156.1 ± 1.2 314.6 ± 23.6 18.68 ± 0.3 3.23 ± 0.3 Table III - Vickers indentation results.
less chance of a given test “finding” the flaw of the ideal size and position to propagate near the minimum load for fracture, and so the trend of the curves to the minimum load to fracture is less well-defined. For this reason, Warren [18] recommended the use of coarse-polished surfaces in the determination of KIc by Hertzian testing.
Table II summarizes the Hertzian indentation results for each material: mean fracture load, Pmean, mean contact radius, amean, mean ring crack radius, rmean, mean flaw size, cmean,. Also shown are the values of minimum fracture load, Pmin,, and the derived value of fracture toughness, KIc, for each specimen. The KIc values depend on the grain size, with coarse-grained material having the lowest KIc.
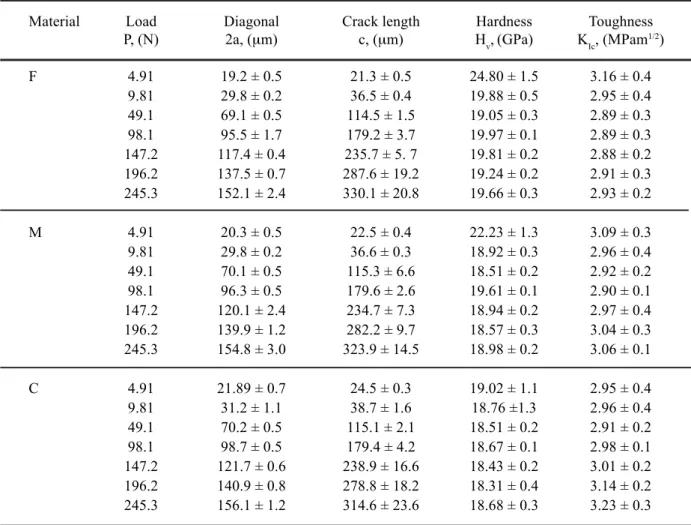
Table III summarizes the Vickers indentation results for each material. The hardness and fracture toughness values for each material vary slightly with applied loads. For specimens of coarser grain size there is an increase in the fracture
toughness with applied load. This corresponds to increasing fracture toughness with increasing crack length and agrees with other results showing larger R-curve effects for coarser grained alumina. At the lowest test load at which usefully measurable median / radial cracks could be produced (4.91 N), the toughness values of the different materials begin to diverge. While the uncertainty in the results at these low loads is large, the trend in KIc with crack size is consistent with the better -defined Hertzian KIc determinations, as shown in Fig. 7.
Table III also shows the wet erosive wear rates of these materials. The tests were made in a slurry medium of SiC grits dispersed in water, with particle impacts at ~2.7 m/s normal to the specimen surface, tests run for 11 hours [35]. The wear rate increases strongly with increasing grain size. The variation in erosive wear rate is in the direction that would be expected from the Hertzian fracture toughness results, with the tougher and harder fine grained material having the lowest erosion rate. However,
Method Specimen Surface Reference
G=1.2 µµµµµm× G=3.8 µµµµµm× G=14.1 µµµµµm×
Hertzian 3.66±0.10 3.55±0.03 3.06±0.05 Syton This
Hertzian 3.58±0.06 3.45±0.04 2.96±0.4 45 µm+ Work
Vickers* 2.98±0.3 2.92±0.2 2.96±0.4
Vickers** 2.89±0.3 2.90±0.1 2.91±0.2
G=5 µµµµµm×
Hertzian 3.53±0.02 6 µm+ a
Vickers* 3.25±0.27
G=3.5 µµµµµm×
Hertzian 2.9±0.1 3 µm+ b
Hertzian 2.9±0.1 14 µm+
Vickers* 2.14±0.23
Vickers** 2.25±0.17
G<5 µµµµµm×(?)(?)(?)(?)(?)
Hertzian 4.33±0.05 6µm+ c
Hertzian 3.80±0.05 600-grit SiC
G=5 µµµµµm×
Hertzian 3.77±0.09 1 µm+ d
G=1.0 µµµµµm× G=4.2 µµµµµm× G=12.3 µµµµµm×
Vickers** 2.7±0.2 2.6±0.5 2.7±0.5 e
Table IV - Comparison of fracture toughness values, KIc (determined by Hertzian and Vickers indentation), for polycrystalline alumina materials.
[Tabela IV - Comparação entre os valores da tenacidade à fratura KIc (determinados pela indentação Hertziana e Vickers) das amostras policristalinas de alumina.]
*Vickers indentation 5 kg load. **Vickers indentation 10 kg load.
×grain size
+surface finished with diamond.
the erosion rates vary over an order of magnitude, whereas the toughness values vary only by ~10% and hardness values by only ~20%; factors other than simply the fracture toughness and hardness therefore contribute to the erosive wear rates.
Fig. 13 shows the fracture toughness determined by Vickers hardness indentation (Table III) and Hertzian indentation (Table II) as a function of crack length. The value of fracture toughness determined by the Hertzian indentation method is higher for specimens of smaller grain size (KIc= 3.58 MPam1/2 for G=1.2 µm, KIc= 2.96 MPam1/2 for G= 14.1 µm). These values correspond to short cracks, 4.20 µm and 5.75 µm, respectively. For the Vickers indentation method the values of fracture toughness that correspond to short cracks are higher for specimens of smaller grain size (KIc= 3.16 MPam1/2 for G= 1.2 µm for cracks of 21.3 µm and KIc= 2.95 MPam1/2 for G= 14.1 µm for cracks of 24.5 µm) whereas for long cracks the fracture toughness values are higher for specimens of coarser grain size (KIc= 2.93 MPam1/2 for G= 1.2 µm for cracks of 330.1 µm and KIc= 3.23 MPam1/2 for G= 14.1 µm for cracks of 314.6 µm). Note that the KIc variation with crack size is a consistent curve for each grain size.
Table IV shows the values of KIc, determined by Hertzian indentation and Vickers indentation, of similar polycrystalline alumina but with different surface finishes [27-28], Warren [18], Anya and Roberts [36], Carroll et al. [37] and Miranda-Martinez et al. [10]). (Note that Anstis’ equation [32]was used by them for determining KIc values). Also some KIc results from the present work (Table II and III) are included for comparison.
It is clear that is quite difficult to compare the KIc values determined by Hertzian indentation for the material used here to the (very few) other data. For instance there are no other data on KIc for Al2O3 of small grain size (e.g. G ~ 1.5 µm) or coarser grain size specimens (e.g. G > 10 µm). For specimens of grain sizes in the range of 3.5 - 5.0 µm there are four KIc values that can be compared to the present work (for specimens of G = 3.8 µm), but the specimens have different surface finishing. The values obtained for KIc by Hertzian indentation are different for each surface finish. In fact the surface finish should not affect the real KIc values but will affect the probability to detect a flaw which will fracture at the minimum load, thus the accuracy of the KIc determination. In coarse-finished surface there are likely to be many more flaws with a broader flaw size range, thus it is more likely that one will detect that flaw that corresponds to the KIc of the material. As recommended by Warren [18], KIc values should be ideally determined using specimens with a coarse-finished surface. The KIc values range from 2.9 MPam1/2 [36] to 3.8 MPam1/2 [18]. The result from the present work, 3.09 MPam1/2 is close to those of Anya and Roberts [36], 2.9 MPam1/2 and Carroll et al. [37], 3.53 MPam1/2. The scatter in K
Ic values for specimens of grain sizes in the range of 3.5 - 5.0 µm may be attributed to the fact that the materials do not have the same microstructures (e.g. grain size, shape and possible glassy phase present) and also to surface finishing conditions.
Again to compare the KIc values determined by Vickers indentation with those determined with other workers is not quite so simple. The best possible comparison is to those results
presented by Miranda-Martinez et al. [10], as their specimens are quite similar to those studied in the present work (the specimens were prepared by following the same sintering and hot-pressing conditions). For loads of 10 kg, the KIc values are in good agreements and are grain-size independent. However to compare the present results to those of other researchers (Table IV), the available data are for Vickers indentation loads of 5 kg only for specimens of grain size ranging from 3.5 µm to 5.0
µm. The KIc values vary but those presented by Anya and Roberts [36] are close to those in the present work.
In summary the KIc values measured by Hertzian indentation method in the present work are comparable to the few results found in the literature, however the lack of data in the literature makes any further comparison impossible. Also the results are comparable to those found by Vickers indentation methods but only for small indentation loads (e.g. 5 and 10 kg) especially if the trends in measured KIc with crack size are considered (see Figure 13).
CONCLUSIONS
Hertzian indentation tests were used to determine surface flaw sizes and densities on well and coarse-polished polycrystalline alumina specimens with grain sizes G= 1.2, 3.8 and 14.1 µm. The following conclusions can be drawn:
Ring cracks were fully formed and easy to see on well-polished specimens of finer grains (F). The use of KOH etching followed by polishing process made the ring cracks easily visible for the other specimens.
The minimum fracture load to form ring cracks in a series of tests increases as the grain size decreases (as shown in Table II, e.g. Pmin is 434, 411 and 298 N for specimens F, M and C, respectively). This minimum fracture load (which is used to determine KIc) is relatively well defined by the trend in results for tests on the coarse polished material (Fig. 13).
The average surface flaw size after polishing increases only slightly as grain size increases (as shown in Table 2, e.g. cmean is 4.20, 4.83 and 5.76 µm for specimens F, M and C, respectively); The flaw size distribution is much broader for coarse grained specimens (Fig. 6).
Flaw sizes found are larger than the grain size for specimens F and M. Thus it seems that flaws sizes introduced by a polishing material are more closely dependent on the size of the polishing grit than on the grain size.
The fracture toughness values determined by Hertzian and Vickers indentation corresponding to small crack length increase as the grain size decreases. For large crack lengths the fracture toughness values (determined by Vickers indentation) increase as the grain size increases.
The fracture toughness values measured by Vickers indentation increase with grain sizes for cracks lengths larger than 120 µm, whereas for cracks of much shorter lengths the KIc values increase as grain sizes decrease, following the same trend as the KIc values determine by Hertzian indentation.
Factors other than simply fracture toughness and hardness therefore contribute to the erosive wear rates.
ACKNOWLEDGEMENTS
A. Franco Jr. thanks UCG (Universidade Católica de Goiás) for financial support.
REFERENCES
[1] A. S. Argon, Proc. R. Soc. A 250 (1959) 422. [2] A. S. Argon, Proc. R. Soc. A 250 (1959) 482.
[3] T. R. Wilshaw, J. Phys. D: Appl. Phys. 4 (1971) 1567. [4] J. D. Poloniecki, T. R. Wilshaw, Nature 229 (1971) 226. [5] J. R. Mathews, F. A. McLintock, W. J. Shack, J. Am. Ceram. Soc. 59 (1976) 304.
[6] P. D. Warren, D. A. Hills, S. G. Roberts, J. Hard Mater. 5 (1994) 213.
[7] P. D. Warren, J. Eur. Ceram. Soc. 15 (1995) 385. [8] P. D. Warren, D. A. Hills, S. G. Roberts, J. Mater. Res. 9 (1994) 25. [9] S. M. Wiederhorn, B. J. Hockey, J. Mater. Sci. 18 (1983) 766. [10] M. Miranda-Martinez, R. W. Davidge, F. L. Riley, Wear 172 (1983) 41.
[11] D. B. Marshall, B. R. Lawn, R. F. Cook, J. Am. Ceram. Soc. 70 (1987) C-139.
[12] S-J. Chao, B. J. Hockey, B. R. Lawn, S. J. Bennison, J. Am. Ceram. Soc. 72 (1989) 1249.
[13] S-J. Chao, Y-H. Huh, K-J. Yoon, J. Am. Ceram. Soc. 77 (1994) 2443.
[14] R. F. Cook, B. R. Lawn, C. J. Fairbanks, J. Am. Ceram. Soc. 68 (1985) 604.
[15] Y-W. Mai , B. R. Lawn, Ann. Rev. Mater. Sci. 16 (1986) 415. [16] R. Steinbrech, R. Knehans, W. Schaawachter, J. Mater. Sci. 18 (1988) 265.
[17] R. Knehans, R. Steinbrech, J. Mater. Sci. Lett. 1 (1982) 327.
[18] P. D. Warren, J. Eur. Ceram. Soc. 15 (1995) 201. [19] M. T. Hüber, Ann. Phys. Lpz. 14 (1904) 156.
[20] H. Hertz, Zeitschrift fur die Reine und Angewandte Mathematik 92, 156-171 (1881); English translation in Miscellaneous Papers, translated by D. E. Jones, G. A. Schott, Macmillan, London, U.K. (1881) p. 146.
[21] S. P. Timoshenko, J. N. Goodier, Theory of Elasticity, 3rd McGraw-Hill, New York (1951) p. 409.
[22] A. S. Argon, Y. Hory, E. Orowan, J. Am. Ceram. Soc. 43 (1960) 86.
[23] D. Nowell, D. A. Hills, J. Strain Anl. 22 (1987) 177. [24] F. C. Franck, B. R. Lawn, Proc. R. Soc. Lond. A 229 (1967) 291. [25] T. R. Wilshaw, J. Phys. D: Appl. Phys. 4 (1971) 1567. [26] R. Warren, Acta Metall. 26 (1978) 1759.
[27] K. Zeng, K. Breder, D. J. Rowcliffe, Acta Metal. Mater. 40 (1992) 2595.
[28] K. Zeng, K. Breder, D. J. Rowcliffe, Acta Metal. Mater. 40 (1992) 2601.
[29] R. Mouginot, D. Maugis, J. Mater. Sci, 20 (1985) 4354. [30] I. Finnie, D. Doley, M. Khatibloo, J. Eng. Mater. Technol. 103 (1981) 183.
[31] C. B. Scruby, “Quantative Acoustic Emission Techniques.” in Research Techniques in Non-Destructive Testing, Ed. R. S. Sharp, Academic Press, London (1985) vol. 8 p.141.
[32] G. R. Anstis, P. Chantikul, B. R. Lawn, D. B. Marshall, J. Am. Ceram. Soc. 64 (1981) 533.
[33] R. W. Davidge, Mechanical Behaviour of Ceramics, Cambridge University Press, Cambridge (1979) p. 13 and 83. [34] W. D. Kingery, H. K. Bowen, D. R. Uhlmann, Introduction to Ceramics, 2th Edition, John Wiley & Sons, New York (1976) p. 340 [35] A. Franco, S. G. Roberts, J. Eur. Ceram. Soc. 6 (1996) 1365. [36] C. C. Anya, S. G. Roberts, J. Eur. Ceram. Soc. 16 (1996) 1107. [37] L. Carroll, M. Sternitzke, B. Derby, Acta Mater. 44 (1996) 4543.