A NEW APPROACH TO IDENTIFY THE STRUCTURAL ORDER OF PAR(p)MODELS
Fernando Luiz Cyrino Oliveira
1*and Reinaldo Castro Souza
2Received December 17, 2009 / Accepted February 4, 2011
ABSTRACT. The periodic autoregressive model, a particular structure of the Box & Jenkins family, denoted by PAR(p), is employed to model the series of hydrological streamflow used for estimating the operational costs of the Brazilian hydro-thermal optimal dispatch. Recently, some aspects of this approach began to be studied and several researches on this topic are being developed. This paper focuses on the identification stage of the orders pof these models. Nowadays, the identification is based on evaluating the significance of the coefficients of the partial autocorrelation function (PACF), based on the asymptotic results of Quenouille. The purpose of this study is on the application of the computer-intensiveBootstrap technique to estimate the significance of such coefficients. The results show that identification via Boot-strapis considerably more parsimonious, leading to the identification of lower orders in most cases and corroborating some points raised in previous studies on the traditional approach.
Keywords: PAR(p), Partial Autocorrelation Function,Bootstrap.
1 INTRODUCTION
Regarding electrical energy generation, Brazil has approximately 90% of its energy supplied by hydroelectric plants. This explains the high levels of investment and research done in order to guarantee and improve all the system of energy production. One of the main characteristics of the generation systems that have hydraulic predominance is the strong dependence of the hydrological regimes. Thus, it is evident the relevance of the streamflow simulation models that seek to optimize the system operations performance, the output being an increase of reliability and costs reduction.
As Hipel & McLeod (1994) showed, some historical series, among them the seasonal hydro-logical ones show an autocorrelation structure that depends not only on the time interval between the observations, but also on the observed period. Furthermore, according to Salas & Obeysekera
*Corresponding author
(1982), natural stochastic processes are, in general and in a broad sense, stationary, that is, first and second order movements of the probabilities distribution are not affected by variations re-lated to the choice of the time origins, which is one of the assumptions to the application of Box & Jenkins methodology, Harvey (1981). In the periodic processes case, two models structures can be considered: PAR (periodic autoregressive) and PARMA (periodic autoregressive-moving average). PAR (p)model fit to each period of the series an AR (p)model. In a similar way, a PARMA (p,q)consists of an ARMA(p,q)model to each period analyzed. In hydrology, PAR (p) modeling resulted from Thomas & Fiering (1962, according to Hipel & McLeod (1994)) researches.
According to Rasmussen et al. (1996), PAR(p)models extrapolation to the PARMA (p,q)
models is not a trivial task and can be non-justifiable given the good performance of autore-gressive models. Yet, as demonstrated in Hosking (1984), the literature describes procedures to hydrological series modeling that present a long dependence, that is, have the d parameter of ARIMA model (differentiation degree) taking fractional values. These models are known as Arfima, Trevisan, Souza & Souza (2000). The d estimation is based in general on the pe-riodogram and smoothed pepe-riodogram function. These models will not be studied here. As said by Maceira (1989), hydrological series with time intervals shorter than a year, as monthly series, have as a feature the periodic behavior of their probabilistic proprieties, for instance, average, variance, asymmetry and autocorrelation structure. Analyses of this kind of series can be carried out through the use of autoregressive formulations whose parameters present a peri-odic behavior. Such procedures are called periperi-odic autoregressive models; they are also referred to as PAR(p), where p is the order of the model, that is, the number of model autoregressive terms. Generally, pis a vector,p= [p1,p2, . . . ,p12], where each element provides the order of
each period (month, in case of monthly series).
PAR(p)model is mathematically described as follows:
Zt−µm σm
=ϕm1
Zt−1−µm−1 σm−1
+ϕ2m
Zt−2−µm−2 σm−2
+ · · ·
· · · +ϕmp
m Zt
−pm −µm−pm
σm−pm
+at
(1)
Zt = Seasonal series of periodS.
S = Number of periods (S =12 to monthly series).
T = Time index,t =1,2, . . . ,S N, function of theT year(T =1,2, . . . ,N)and themperiod(m=1,2, . . . ,S).
N = Number of years.
µm = Seasonal average of the periodm.
σm = Seasonal standard deviation of the periodm.
ϕim = i-th autoregressive coefficient of the periodm.
pm = Order of the autoregressive operator of the periodm.
at = Series of independent noises with average zero and varianceσa2(m). In order to
In the context of the medium range energy operation planning of Brazilian electrical system, the model used is called Newave (developed by CEPEL, the Brazilian Electrical Energy Research Center), in which the planning is represented by a problem of multi-stage stochastic linear pro-gramming, whose objective is the total operation costs minimization (fuel costs of the thermal units plus the meet demand penalty) during the planning horizon. According to Marcato (2002), Newave model is based on the optimization technique SDDP (Stochastic Dual Dynamic Pro-gramming) and, once an aggregate representation of the hydroelectric park is given, it is possible to consider several interlinked subsystems. It also enables the static or the dynamic represen-tation of the system configuration, proper load discretization, represenrepresen-tation of the provision cuts in the electric energy market, and also the access of various affluent natural energy (ANE) scenarios, obtained through periodic autoregressive models. As mentioned by Oliveira (2010), the ANE is calculated from the natural streamflows and the productiveness equivalent to the storage of 65% of the hydroelectric plants reservoirs useful value.
That said, PAR(p)model is the one adopted in modeling and simulation of Brazilian electric sector affluences thus an autoregressive model of order pis fitted to each of the historical series periods (months) of streamflows and/or ANE of each of the four subsystems that enter into the composition of the National Interconnected System (Southeast/Midwest, South, Northeast and North).
This work aims at the investigation of the method of identification of the orders p of each sub-systems series – stage that is being the target of some authors’ critiques, as bad chosen orders can generate unreliable results and inconsistent synthetic scenarios – and the proposition of a new approach to improve on this stage using the intensive computation techniqueBootstrap.
2 THE ORDERS “p” IDENTIFICATION
According to Maceira (1989), the traditional identification of orders pof the PAR(p)models is carried out by the analysis of autocorrelation function (ACF) and partial autocorrelation function (PACF).
Takingρkmas the correlation betweenZtandZt−k, such that t corresponds to the periodm:
ρkm =E
Zt −µm σm
Zt−k−µm−k σm−k
(2)
The set ofρkm autocorrelation functions of the periodsm =1, . . . ,s, describes the series time dependence structure. These functions are given by:
ρkm=E
Z
t−µm
σm
Zt−k−µm−k
σm−k
=ϕ1mE
Z
t−1−µm−1
σm−1
Zt−k−µm−k
σm−k
+ · · ·
· · · +σpmmE
Zt−pm−µm−pm σm−pm
Zt−k−µm−k
σm−k
+E
at
Zt−k−µm−k
σm−k
Once the parameters of a PAR(p)model are known, theρkmfunctions are given by solving (3) and can be expressed by a combination of exponential decays and/or sinusoidal waves. This way, eachρmk tends to zero askincreases, Box, Jenkins & Reinsel (1994).
Fixing m and varyingk from 1 to pm in (3) it is obtained for each period a set of equations usually called Yule-Walker equations. To any periodm:
1 ρm1−1 ρ2m−1 . . . ρmp−1
m−1
ρ1m−1 1 ρ1m−2 . . . ρmp−2
m−2
ρ2m−1 ρm1−2 1 . . . ρmp−3
m−3
..
. ... ... . . . ...
ρmp−1
m−1 ρ
m−2 pm−2 ρ
m−3
pm−3 . . . 1
ϕ1m
ϕ2m
ϕ3m
.. .
ϕmpm
=
ρ1m
ρ2m
ρ3m
.. .
ρmpm
(4)
Denotingϕk jm the j-th autoregressive parameter of a process of orderk,ϕk jm is the last parameter in this process. The Yule-Walker equations to each periodmcan be rewritten as follows, Souza & Camargo (2004):
1 ρ1m−1 ρ2m−1 . . . ρkm−1−1
ρ1m−1 1 ρ1m−2 . . . ρkm−2−2
ρ2m−1 ρ1m−2 1 . . . ρkm−3−3 ..
. ... ... . . . ...
ρkm−1−1 ρkm−2−2 ρkm−3−3 . . . 1
ϕkm1
ϕkm2
ϕkm3
.. .
ϕkkm
=
ρ1m
ρkm2
ρkm3
.. .
ρkkm
(5)
Omitting the period m notation in order to facilitate the matters, the set of values ϕkk, k =
1,2, . . ., are calledpartial autoregressive functionof the periodm. This particular set is another way of representing the stochastic process dependence structure during the time. In an autore-gressive process of orderpm, the partial autocorrelation functionϕkkwill be different from zero forklower than or equal topm and zero forkhigher thanpm.
Thus, the models “classical” identification consists of determining the most appropriate orders of the autoregressive operators of each period pm,m = 1, . . . ,s. This can be done by obtain-ing estimationsϕkk,k =1, . . . ,N/4 and replacing in (5) the autocorrelations by the respective sample values. If the autoregressive operator order for any period m is pm, then ϕkk for k > pm has a distribution approximately Gaussian with zero mean and variance 1/N, Morettin & Toloi (2006). For a period m, the procedure looks for a largest order i so that
ˆ
3 ASYMPTOTICAL RESULTS TO THE PROBABILITY DISTRIBUTION OF THE ACF AND PACF
The probability distributions of these random variables are extremely complex. In Anderson (1942)apudNeto (1991), it is shown that, if the estimated parameter,ρk, is null and the series
size is relatively large, then theρkestimator has Gaussian distribution:ρk ∼N[0,V(ρk)].
Bartlett (1946)apudNeto (1991) proposed an approximate expression for the variance ofρk:
V(ρk)∼= 1
N ∞
X
i=−∞
ρi2+ρi+kρi−k−4ρkρiρi−k+2ρkρiρi−k+2ρk2ρi2
(6)
For processes in whichρk=0,k>q, Bartlett approximation can be used, and is given by:
V(ρk)∼=
1
N
" 1+
q
X
i=1 (ρi2)
#
(7)
For the sample partial autocorrelations, there is the result given by Quenouille (1948) apud
Neto (1991), showing that in the hypothesis of an order p autoregressive process, the approxi-mateϕkkvariance is given by:
V(ϕkk)∼=
1
N (8)
Hence, the procedures for hypothesis testing are:
H01:ρk=0 H02: ϕkk=0
And, from the results previously shown, it is possible to build(1−α)confidence level intervals for the parameters of interest:
Iρk = h
ρk±Z(1−α/2)
p
V(ρk)
i
(9)
Iϕkk = "
ϕkk±Z(1−α/2)
r 1
N
#
(10)
Thus, ACF and PACF and the previous intervals are used as identification tools to find the most appropriate model structure, be comparing the behaviors of the estimated and the theoretical function.
However, there are models in the structures whose ACF and PACF values, though not null, are accepted as belonging, respectively, to the confidence intervals. In this case, the traditional technique points to the acceptance of the processes as white noise, when, in fact, they are models with parameters situated in specific regions of the parametric space that have low ρk andϕkk
Corroborating the notion that the classical form of orders p identification can not be the most adequate, taking in account the results previously shown, Stedinger (2001) proposes some re-flections about this stage and the following criterion to the selection of the significant lags: for each period m, it is sought the highest orderi, such that all the estimationsϕkk fork < i are
significant. This criterion does not admit non-significant intermediary lags, something that happens in the classical form. The maximum order considered is six.
Stedinger (2001) also states that a modeling procedure that considers each month individually can not produce the best or an adequate set of models. Without further mathematical details and given the kind of natural phenomena involved, the author argues that it makes no sense to consider, for instance, that the February streamflows depend on those of January, December, November, October, September and August(p=6), and that, to predictions referring to January, depends only on the December value(p=1).
Stedinger (2001) concludes by stating that the solution to the modeling challenge faced would be the adoption of a broader perspective of the decisions model that should be guided by the hydrological reasonableness of the selected models that recognize the intrinsic link among the chosen models for different periods.
Therefore, given the critical observations and analyses about the classical form of identification of the orders p, this study proposes the use ofBootstrapas an alternative form for the estimation of the probabilities distribution of the ACF and PACF coefficients, and subsequent analysis of the significance of the lags in order to improve on the orders pidentification.
4 BOOTSTRAPIN THE INDENTIFICATION OF ORDERS “p”
The term Bootstraphas its origin in the expression “lift oneself by pulling his/her bootstrap”. What lies behind this expression is the fact that, through the procedure, it is possible to obtain proprieties of big samples from a reduced number of observations.
Bootstrap, introduced by Efron & Tibshirani (1993), is a non parametric computationally inten-sive stochastic technique that enables the assessment of the variability of estimators based on data of only one existent sample.
The technique is recommended to problems in which it is difficult to deploy the conventional statistical procedures. In general, it shows some advantages if used in situations of short or big samples, inasmuch as it provides results close to the ones obtained through usual asymptotic ways or superior to reduced samples.
To Oliveira (2010), in the time series context, there are basically two ways of useBootstrap: in the residues and the so-called “moving blocks” method. In the former, guaranteeing the hypoth-esis of residues independence, these are used to generate new “Bootstrapped” series. In the case of “moving blocks”, no model is adjusted a priori. From the data, blocks of M size are built from the original series. Then, kblocks are selected randomly with replacement, aggregating them to form theBootstrapsample. This step is repeated Btimes, generating BnewBootstrap
series, Souza (2004).
4.1 Bootstrapdistribution ofρkandϕkk
To the construction of ρk andϕkk Bootstrapdistribution, it is necessary to have an algorithm
that preserves the series autocorrelation structure. From the original series, one obtainρk∗l, the
ρk estimation in thel-thBootstrapreplication by sampling, with replacement,(n−k)pairs of the original sample of pairs and building with them theBootstrapsample. With this generated
Bootstrapsample, the ACF is estimated by the usual method. Repeating the process B times, one arrives at theBootstrapestimator ofρk:
ρk∗=
B
X
l=1
ρ∗klB (11)
The set of observation pairs with lagkprovide information to the estimation of theρk parame-ter. The estimation of this autocorrelation, obtained from this set, is an element of the classical estimator sampling distribution. From this set, it is possible to obtain aBootstrapsample, with
l index, and the respective estimation of theρk parameter. A very large set ofρk∗l estimations constitutes an approximation of theρksampling distribution. By the Law of Large Numbers, it
is possible to state that:
ρk∗=
" B
X
l=1 ρk∗lB
#
→E
ρk (12)
Having theBootstrapdistribution of theρk estimator, it is possible to build theϕkk Bootstrap
distribution in relation to theBootstrapautocorrelation of lag k and the previous ones in the usual way.
With theBootstrap distribution ofρk andϕkk obtained as described above, a precision mea-surement of these statistics can be calculated. The ρk andϕkk Bootstrapstandard errors are,
respectively:
s∗ ρk
=
v u u u t
B P
l=1
ρk∗l−ρ∗k2
B (13)
s∗ ϕkk =
v u u u t
B P
l=1
ϕkk∗l −ϕkk∗2
This way, Bootstrapconfidence intervals can be built without the hypothesis of normality, for bothρkandϕkk, given by (see Oliveira (2010)apudNeto (1991) for details):
Iρk =
ρk±tgl,(1−α)S∗(ρk) (15)
Iϕkk =
ϕkk±tgl,(1−α)S∗(ϕkk) (16)
The next section shows the model used and the results obtained through the use of the technique in the specific case of periodic modeling.
5 PROPOSED MODEL AND RESULTS OBTAINED
In this study, the series used are the monthly ANA’s, running from January/1931 to Decem-ber/2008 available from the Operator of the National Electric System (ONS).
In the model used in this study, to each of the periods of each of the subsystems, the algorithm creates monthly “pairs” with lags ranging from 1 tok. These “pairs” are sampled with replace-ment, formingB Bootstrapsamples of the same size of the original sample. From each one of the samples formed, the algorithm estimatesB BootstrapACF coefficients to every period for all subsystems.
Once all theρkmwere obtained, the following step consists on the estimation of the PACF, whose calculations are based on the equation (4). The following example is fork=1,2 and periodm:
ϕm(Bi) 11 = [1]
−1ρm B(i)
1 (17)
ϕm B(i) 21
ϕm B(i) 22
=
1 ρm−1B(i) 1
ρm−1B(i)
1 1
−1
ρm B(i) 1
ρm B(i) 1
(18)
And this follows to the others lags for each periodm. The indexB(i)represents thei-th sampled with replacement obtained by the algorithm. The proposed approach here is the following: to each i Bootstrap sampling of the partial autocorrelation function, all the indices that appear on the right hand side of the matrix equation (18) should also refer to thei sample ACF. This way, it is expected that the ϕm B(i)
kk estimate sampling distribution capture all the randomness
inherent to the procedure.
After running the algorithm, it is obtained B Bootstrap estimates for each one of the ρk and
ϕkkfor all the periods and all four subsystems. Therefore, accurate metrics can be calculated; for
instance, the estimated standard errors (equations (13) and (14)). Thus, confidence intervals can be built and the real significance of the ACF and PACF coefficients can be established, following equations (15) and (16).
the construction of the confidence intervals as given by (15) and (16), the 5% level of signifi-cance was adopted and this was compared to the corresponding ones obtained from the intervals constructed from the 2.5% and 97.5% percentiles. The values obtained did not show any signifi-cant differences.
The results obtained for the orders of each period of the Brazilian subsystems are shown next. For both forms of identification, the pvalues found in accordance to the established criteria are shown. The objective, therefore, is to compare the results obtained through the two approaches and check on their proposed approach applicability. From Oliveira’s (2010), the criteria proposed were:
Criterion 1:for a periodm, the procedure looks for the largest orderiso that allφˆkkm estimations fork > i are not significant, with maximum order equals to six (following the guide used by Newave).
Criterion 2:for a periodm, the procedure looks for the largest orderiso that allφˆkkm estimations fork <i are significant. This is the criterion that does not admit non-significant intermediary lags. The maximum order considered is six.
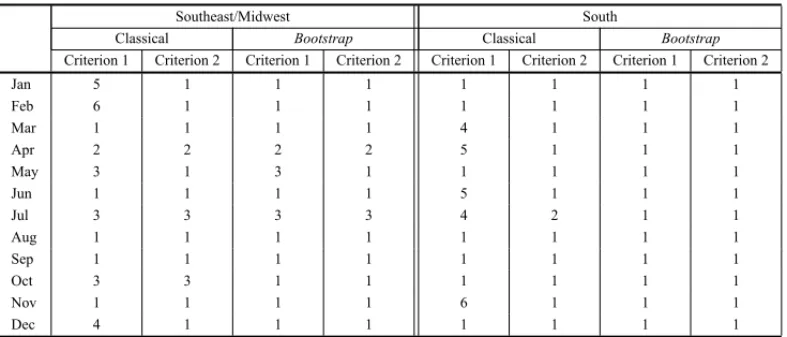
Analyzing the results shown in Tables 1 and 2, it is possible to note that, from the 48 periods considered (12 months of each of the subsystems), in only nine cases the orders pointed by the Criterion 2 of the Classical identification and theBootstrapCriteria 1 and 2 present some differences. For each one of these cases, the confidence interval of the parameters of the possible adjusted model was simulated also throughBootstrapprocedures.
Table 1 – Results of the orders identification for the Southeast/Midwest and South subsystems.
Southeast/Midwest South
Classical Bootstrap Classical Bootstrap
Criterion 1 Criterion 2 Criterion 1 Criterion 2 Criterion 1 Criterion 2 Criterion 1 Criterion 2
Jan 5 1 1 1 1 1 1 1
Feb 6 1 1 1 1 1 1 1
Mar 1 1 1 1 4 1 1 1
Apr 2 2 2 2 5 1 1 1
May 3 1 3 1 1 1 1 1
Jun 1 1 1 1 5 1 1 1
Jul 3 3 3 3 4 2 1 1
Aug 1 1 1 1 1 1 1 1
Sep 1 1 1 1 1 1 1 1
Oct 3 3 1 1 1 1 1 1
Nov 1 1 1 1 6 1 1 1
Dec 4 1 1 1 1 1 1 1
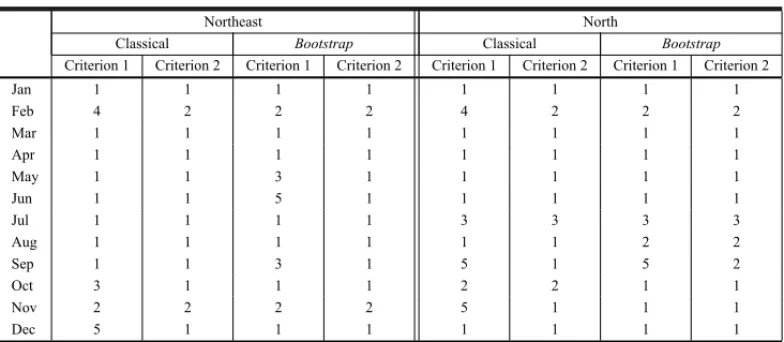
Table 2 – Results of the orders identification for the Northeast and North subsystems.
Northeast North
Classical Bootstrap Classical Bootstrap
Criterion 1 Criterion 2 Criterion 1 Criterion 2 Criterion 1 Criterion 2 Criterion 1 Criterion 2
Jan 1 1 1 1 1 1 1 1
Feb 4 2 2 2 4 2 2 2
Mar 1 1 1 1 1 1 1 1
Apr 1 1 1 1 1 1 1 1
May 1 1 3 1 1 1 1 1
Jun 1 1 5 1 1 1 1 1
Jul 1 1 1 1 3 3 3 3
Aug 1 1 1 1 1 1 2 2
Sep 1 1 3 1 5 1 5 2
Oct 3 1 1 1 2 2 1 1
Nov 2 2 2 2 5 1 1 1
Dec 5 1 1 1 1 1 1 1
For the May model in Southeast/Midwest subsystem and May, June and September models in Northeast subsystem, in which the orders pointed by the Criterion 1 of theBootstrapwere higher than the ones of the Criterion 2 of the Classical identification, simulations showed that for the 95% confidence level of only the first and the last parameters of the models were significant,i.e., the intermediate parameters are not. In these cases, it is recommended the use of more parsi-monious models, resulting in the inferior orders pointed out by the Criterion 2 of theBootstrap
identification.
In the case of the August model in North subsystem, for both the Criteria 1 and 2 of the Boot-strapidentification, the orders selected were higher than the Criteria 2 of the Classical one. The simulations conducted pointed out that, at the 95% confidence level, the two parameters of the model are significant, but, at the 99% confidence level, only the first one would remain in the model.
Finally, to the September model in North subsystem, the simulations showed that, in the model of order 5, only the first, the second and the fifth parameters were significant. Following the parsimony principle, one should opt for the order 2,i.e., the model that was pointed out by the Criterion 2 of theBootstrapidentification.
6 CONCLUSIONS AND FINAL REMARKS
The use of PAR (p)to model hydrological streamflows and/or affluent natural energy series has been applied to the Brazilian integrated energy system, in order to provide possible ways to improve the existing approach, which has been openly criticized.
In addition to that, the use of Criterion 2 to orders selection seems to be more accurate, confirm-ing the previous results of Oliveira (2010) and Stedconfirm-inger (2001), who criticized the classical form of identification and suggested that the solution to the challenge faced in the modeling procedure would be the adoption of a broader perspective of the decisions model that must be guided by the hydrological reasonableness of the models selected. In general, the orders identified by the Classical Criterion 2 and theBootstrapCriteria 1 and 2 were identical, except for the ones whose significance of the parameters models was checked and, by using the parsimony principle, the
BootstrapCriterion 2 procedure seems to be the most accurate.
TheBootstraptechnique was efficient in the identification of the orders of the models of each period (mainly in relation to Criterion 2), approximating the Criterion 2 of the classical approach in 90% of the cases. This way, the alternative recommended as the most accurate is the use of the intensive computation technique during the critical stage of identification of orders p, as well as, as a starting change, the use of the Criterion 2 replacing the Criterion 1, in current use.
REFERENCES
[1] BOXGEP, JENKINSGM & REINSELGC. 1994. Time Series Analysis: Forecasting and Control, Prentice Hall, Englewood Clifls, New Jersey.
[2] EFRONB & TIBSHIRANIRJ. 1993. An Introduction to theBootstrap. Chapman & Hall, New York. [3] HARVEYAC. 1981. Time Series Models. Philip Allan. London.
[4] HIPELKW & MCLEODAI. 1994. Time Series Modelling of Water Resources and Environmental Systems. Elsevier. Amsterdam.
[5] HOSKINGJRM. 1984. Modelling Persistence in Hydrological Time Series Using Fractional Differ-encing.Water Resource Research,20: 1898–1908.
[6] MACEIRAMEP. 1989. Operac¸˜ao ´Otima de Reservat ´orios com Previs˜ao de Afluˆencias. M.Sc. Disser-tation, COPPE/UFRJ, Rio de Janeiro, Brasil.
[7] MACEIRAMEP & DAMAZIO´ JM. 2004. The use of PAR(p)model in the stochastic dual dynamic programming optimization scheme used in the operation planning of the Brazilian hydropower sys-tem. In: 8th International Conference on Probabilistic Methods Applied to Power Systems, Iowa State University, Ames, Iowa.
[8] MARCATOALM. 2002. Representac¸˜ao h´ıbrida de sistemas equivalentes e individualizados para o planejamento da operac¸˜ao de m´edio prazo de sistemas de potˆencia de grande porte. Ph.D Dissertation, Department of Electrical Engineering, PUC-Rio, Brazil.
[9] MORETTINPA & TOLOICMC. 2006. An´alise de s´eries Temporais. Editora Blucher, S˜ao Paulo. [10] NETOAC. 1991.Bootstrapem s´eries temporais. Ph.D Dissertation, Department of Electrical
Engi-neering, PUC-Rio, Brazil.
[11] NETOAC & SOUZARC. 1996. ABootstrapSimulation Study in ARMA(p,q)Structures.Journal of Forecasting,15: 343–353.
[13] ONS – OPERADORNACIONAL DOSISTEMAELETRICO´ . Dispon´ıvel em
<http://www.ons.com.br/home/>. Acesso em 2009.
[14] RASMUSSENRF, SALAS JD, FAGHERAZZI L, RASSAM JC & BOBEER. 1996. Estimation and validation of contemporaneous PARMA models for streaflow simulation.Water Resource Research, 32: 3151–3160.
[15] SALAS JD & OBEYSEKERA JTB. 1982. ARMA model identification of hydrologic time series. Water Resource Research,18: 1011–1021.
[16] SOUZARC & CAMARGOME. 2004. An´alise e Previs˜ao de S´eries Temporais: os modelos ARIMA. Sedigraf, Iju´ı.
[17] STEDINGER JR. 2001. Report on the evaluation of CEPEL’s PAR models. Cornell University. School of Civil and Environmental Engineering. Ithaca, New York.
[18] THOMAS HA & FIERING MB. 1962. Mathematical synthesis of streamflow sequences for the analysis of river basins by simulation. In: Design of Water Resource Systems edited by A. Maass et al., Harvard Univ. Press, Cambridge, Massachusetts, 459–493.