ISSN 1517-7076 artigo 11495, pp.0046-0054, 2013
Autor Responsável: Monteiro, S.N. Data de envio: 23/10/10 Data de aceite: 22/02/13
Weibull analysis for the diameter dependence
of the elastic modulus of curaua fibers
Monteiro, S.N.1, Lopes, F.P.D.1, Ferreira, A.S.2
1 IME: Military Institute of Engineering, Department of Materials Science, Praça General Tibúrcio, 80, 22290-270, Rio de Janeiro, Brazil.
e-mail: [email protected] ; [email protected]
2 Universidade Federal Fluminense, Campus Macaé, Macaé, RJ – Brasil. e-mail: [email protected]
ABSTRACT
The curaua fiber is one of the strongest lignocellulosic fibers and is currently being considered as reinforcement of polymer composites for industrial applications such as automobile interior components and bicycle helmets. The tensile strength of the curaua fiber was found to display an inverse variation with its corresponding equivalent diameter. Since the stiffness of the fiber is also important for its use as composite reinforcement, the present work investigated the dependence of the elastic modulus of curaua fibers with the associated diameters. The results confirmed the existence of an inverse dependence between the elastic modulus and the fiber diameter. In principle, this could allow a selection of stiffer curaua fibers to be used as reinforcement in polymer composites with comparatively higher elastic modulus. A possible mechanism for this inverse dependence is discussed following structural differences between thicker and thinner fibers. Keywords: curaua fiber, diameter dependence, elastic modulus, Weibull analysis.
1. INTRODUCTION
Natural planted-based materials are gaining attention in recent years owing to their advantages to the environment as compared to synthetic materials, especially those like plastics fabricated from petroleum-based precursors. Natural materials are biodegradable, yearly removable and recyclable. Therefore, they are considerate fully sustainable [1]. In particular, their life-cycle, from growing to industrial processing, absorbs as much CO2 as it is emitted and makes them neutral with respect to greenhouse gases responsible for global warming [2]. Typical examples of these environment-friendly materials are the lignocellulosic fibers that have been used in simple items such as ropes, baskets, textile, modest roofing, etc [3]. In the past few decades, these natural fibers were extensively investigated [4–10] as reinforcement of polymer matrices in substitution for synthetic fibers composites. In fact, engineering applications of lignocellulosic fiber composites are today in the market, especially in the automobile industry [11–13]. Out of the many available natural fibers, only part of them exhibits superior properties for composite reinforcement application.
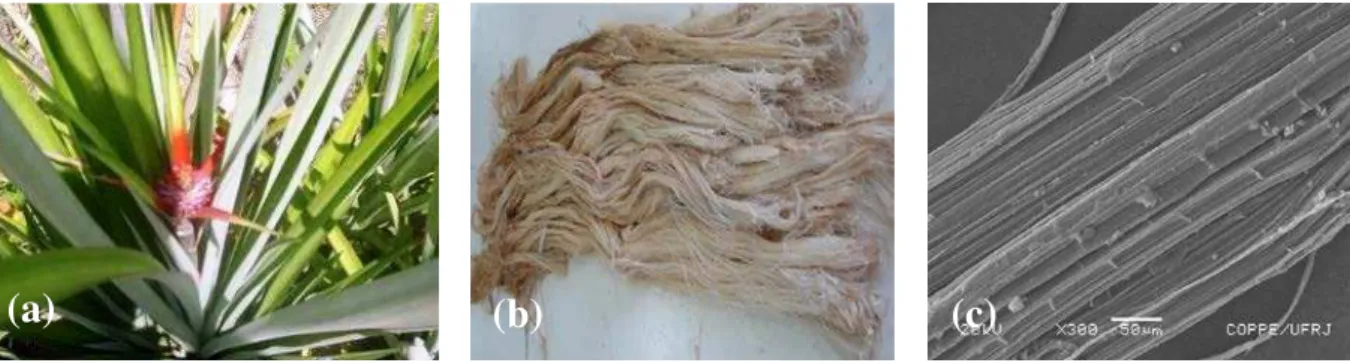
The fiber extracted from the leaves of the curaua (Ananas erectifolius), a bush-like plant native of the
Amazon region and similar to the pineapple, has the necessary reinforcement qualification [3, 10, 13]. Figure 1 shows the curaua plant and fibers extracted from its leaves.
Figure 1: Curaua plant (a), bundle of fibers (b) and fibrils observed by scanning electron microscopy (c).
47 Despite of the technical information already available for curaua fibers, no investigation on the diameter dependence of their elastic modulus has, so far, been conducted. Therefore, the objective of this work was to conduct a preliminary investigation on the statistical probability, using the Weibull analysis, to correlate the curaua fiber tensile elastic modulus with its equivalent diameter.
2. EXPERIMENTAL PROCEDURE
The curaua fibers, illustrated in Figure 1(b), were supplied as a lot of 5 kg by the Brazilian firm Amazon Paper, which commercializes lignocellulosic fibers cultivated in the Amazonian region of Brazil. A statistical analysis of the dimensions was performed in randomly separated fibers from the lot, as shown in Figure 2.
0.04 0.08 0.12 0.16 0.20 0.24 0.28 0.32 0
10 20 30 40 50
F
requenc
y (
%
)
Diameter (mm)
Figure 2: Histogram for the distribution of diameter of the as-received curaua fibers.
In this figure, the histogram of equivalent diameter distribution was established from measurements in 100 fibers randomly collected from the as-received lot. Each fiber had its diameter measured at 5 equally separated positions in a model 6C Nikon profile projector, illustrated in Figure3. At the same position, the fiber was rotated 90° and the diameter was measured again, since the fiber cross section is not perfectly circular. The average values were taken as the curaua fiber equivalent diameter. The range of values was arbitrarily divided into 7 intervals, from the smaller (0.04 mm) to the greater (0.32 mm) that constitute the 0.04 mm width of the columns in Figure 2. From this histogram, an overall mean curaua fiber diameter was found as 0.14 mm. Additional fibers selection for each one of the 7 intervals was then performed in order to comprise a minimum of 20 fibers per interval. All the additionally selected fibers also had their equivalent diameter measured, as aforementioned, using the profile projector (Figure 3).
Figure 3: Profile projector Nikon used to measure the diameters of the curaua fibers.
48 In order to complement this investigation on the diameter dependence of the elastic modulus, the fractures of representative ruptured fibers were analyzed. Ruptured fibers for each corresponding diameter interval, were attached with conducting carbon tape to a metallic support and then gold sputtered to be observed by scanning electron microscopy, (SEM), in a model SSX-550 Shimadzu equipment operating with secondary electrons at an accelerating voltage of 15kV.
3. RESULTS AND DISCUSSIONS
The digital recorded data obtained from the Instron machine allowed the construction of representative load
vs. elongation curves for each diameter interval, such as those presented in Figure 4.
L
oa
d (N
)
- 1 0 1 2 3 4
0 1 2 3 4
- 1 0 1 2 3 4
0 1 2 3 4 5 6 7
- 1.0 0.0 1.0 2.0 3.0
0 1 2 3 4 5 6 7
- 1 0 1 2 3 4 5
- 1 0 1 2 3 4 5 6
- 1 0 1 2 3 4 5 6 7 8
0 1 2 3 4 5 6
- 1 0 1 2 3 4 5
0 1 2 3 4 5 6 7 8 9 10
Elongation (mm)
Figure 4: Typical tensile load vs. elongation of curaua fibers for the distinct intervals of diameters. 0.04<d<0.08 0.08<d<0.12
0.12<d<0.16 0.16<d<0.20
0.20<d<0.24 4
0.24<d<0.28 4
49 In most of these curves there are noticeable fluctuations in the values of the fibers load resistance to displacement of the Instron machine crosshead. These oscillations, which can also be regarded as serrations, correspond to the process of gradual separation of the microfibril that constitute a curaua fiber Figure 1(c). For higher loads, approaching the fiber rupture, the filaments are gradually breaking down, and the serrations are amplified. This is exemplified in the curve of the interval of larger diameters between 0.28 and 0.32 mm in Figure 4. Obviously, since this is a larger diameter, it has more microfibrils to be broken.
The values of elastic modulus were obtained at the linear section of the load vs. elongation curves in Figure 4. These values were analyzed by the Weibull statistic method, for each of the seven diameter intervals, as shown in Figure 5.
L n [ ln (1 /r elia bility )]
Weibull Probability Plot
n( 1/ R el iabi li ty )] -0.6 -1.2 -1.8 -2.4 0.0 0.6 1.2 1.8 2.4
Weibull Probability Plot
n( 1/ R el iabi li ty )] -0.6 -1.2 -1.8 -2.5 0.0 0.6 1.2 1.8 2.5
Weibull Probability Plot
n( 1/ R el iabi li ty )] -0.6 -1.2 -1.8 -2.4 0.0 0.6 1.2 1.8 2.4
e bu obab ty o
n( 1/ R el iabi li ty )] -0.6 -1.2 -1.8 -2.4 0.0 0.6 1.2 1.8 2.4
Weibull Probability Plot
n( 1/ R el iabi li ty )] -0.6 -1.2 -1.8 -2.4 0.0 0.6 1.2 1.8 2.4
Weibull Probability Plot
n( 1/ R el iabi li ty )] -0.6 -1.1 -1.7 -2.3 0.0 0.6 1.1 1.7 2.3
Weibull Probability Plot
n( 1/ R el iabi li ty )] -0.6 -1.2 -1.8 -2.4 0.0 0.6 1.2 1.8 2.4
Ln (x-location parameter)
Figure 5: Weibull graphs for the different intervals.
0.04<d<0.08 0.08<d<0.12
0.12<d<0.16 0.16<d<0.20
0.20<d<0.24 0.24<d<0.28
50 The analysis was done based on the cumulative Weibull distribution function, as follows:
F(x) = 1 – exp[-(x/α)β] (1)
were α and β are statistical parameters.
In Figure 5, the graphs are unimodal with just one straight line fitting for all points in the same diameter interval. This indicates that every curaua fiber within each one of the seven intervals belongs to a group with same mechanical behavior.
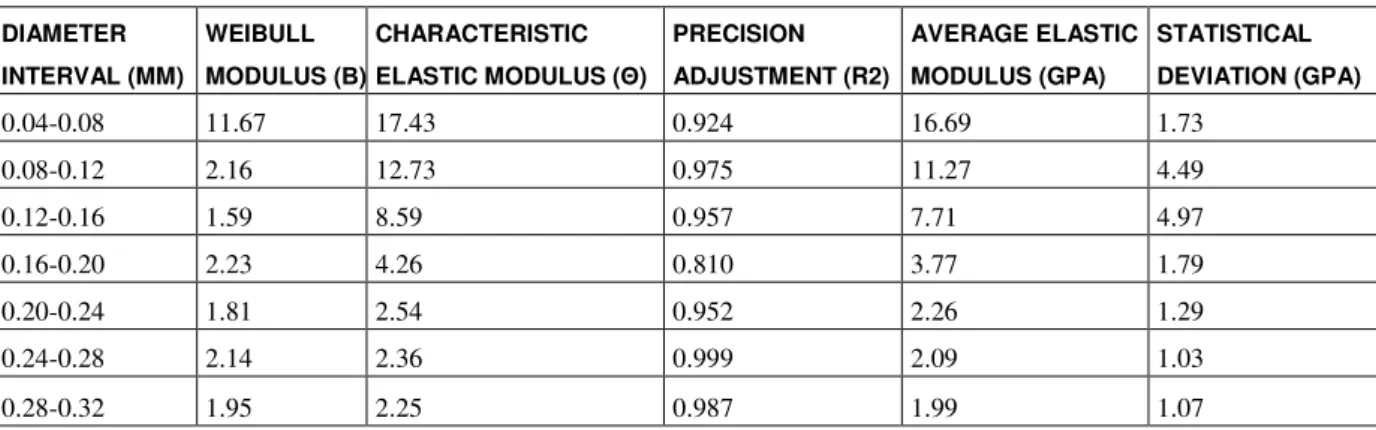
Table 1 presents the values of the Weibull parameters associated with the statistical characteristic of each diameter interval. In this table, the parameter θ, specifically for the present work, represents the most characteristic elastic modulus. The adjustment parameter R² indicates the precision degree of the statistical analysis. Here it is relevant to mention that the Weibull statistical method imposes limitations on the parametric values. For instance, the value of the Weibull modulus β should vary between 0.5 and 15. The higher the value of β, the more confidence exists in the results. In this respect, the values of β in Table 1 indicate a relatively low confidence, which is expected in any experimentally measured property of a natural fiber [4-10]. The value of R is associated with the precision of results. The closer R2 is to 1 (unity), the more precise is the adjustment of points to a linear relationship in Fig 4. As shown in Table 1, except for the diameter interval 0.16-0.20 mm, with a reasonable R2 = 0.81, all other intervals display excellent adjustments. It is also worth mentioning that the statistical deviations in Table 1 revealed relatively large errors, reaching more than 50% in some intervals. Once again, large deviations from an average value are expected in lignocellulosic fibers [4-10].
Table 1: Weibull parameters related to the curaua fiber elastic modulus for the different diameter intervals.
DIAMETER
INTERVAL (MM)
WEIBULL
MODULUS (Β)
CHARACTERISTIC
ELASTIC MODULUS (Θ)
PRECISION
ADJUSTMENT (R2)
AVERAGE ELASTIC
MODULUS (GPA)
STATISTICAL
DEVIATION (GPA)
0.04-0.08 11.67 17.43 0.924 16.69 1.73
0.08-0.12 2.16 12.73 0.975 11.27 4.49
0.12-0.16 1.59 8.59 0.957 7.71 4.97
0.16-0.20 2.23 4.26 0.810 3.77 1.79
0.20-0.24 1.81 2.54 0.952 2.26 1.29
0.24-0.28 2.14 2.36 0.999 2.09 1.03
0.28-0.32 1.95 2.25 0.987 1.99 1.07
The variation of the characteristic elastic modulus with the fiber equivalent diameter, i.e., the mean value of the interval, is shown in Figure 6. In this figure there is a clear tendency for θ to vary in an inverse way with respect to the fiber diameter, d. A physical consequence is that the thinner the fiber, the higher the characteristic elastic modulus.
The corresponding values of R² in Table 1 statistically support the inverse correlation between θ and d. This correlation can be mathematically described as the following hyperbolic equation for curaua fiber
θ = 1.2/d – 1.9 (2)
The precision adjustment of this equation is associated with R2 = 0.94.
Another Weibull parameter of relevance is the average elastic modulus, Em. The interval of Em values
and its deviation encompasses the corresponding values of θ. In a normal distribution of elastic modulus, within a given diameter interval, the values of θ and the arithmetic average of the elastic modulus Em should
51
0.06 0.10 0.14 0.18 0.22 0.26 0.30
3 6 9 12 15 18
C
har
ac
ter
is
tic
E
las
tic
M
odul
us
(
G
P
a)
Diameter (mm)
Figure 6: Variation of the characteristic elastic modulus with the mean diameter for each diameter interval.
Figure 7 plots Em and corresponding deviations as a function of the diameter. In this figure, within the
error bars, a hyperbolic inverse correlation can be adjusted between Em (MPa) and d (mm):
Em = 1.2/d – 2.1 (3)
The precision adjustment of this equation is associated with R2 = 0.96.
0.06 0.10 0.14 0.18 0.22 0.26 0.30
0 5 10 15 20
E
las
tic
M
odul
us
(
G
P
a)
Diameter (mm)
Figure 7: Variation of the elastic modulus with the mean diameter for each interval.
By comparing Eq. (2) and (3), it can be seen that both adjust well and have very similar mathematical coefficients. It is then suggested that a hyperbolic type of equation is indeed the best statistical correlation between the curaua fiber elastic modulus and its diameter. Hyperbolic correlations have recently been reported for the tensile strength of curaua, sisal and ramie [15] as well as of jute [16], bamboo [17], coir [18] and piassava fibers [19]. In a recent overview [20], additionally to the above mentioned fibers [15-19], the buriti fiber was also reported to adjust the tensile strength dependence of its diameter to a hyperbolic equation. The reason for this behavior was proposed not only as a consequence of higher density of defects/flaws/irregularities but also on the probability that the weakest microfibril in a thicker fiber breaks at a comparatively lower stress [20]. Fan [21] also attributed the diameter dependence of the tensile strength in hemp fibers to a proportionally higher number of defects in thicker fibers.
52 correlation between the elastic modulus (E) and the lignocellulosic fiber diameter (d). Based on the 3D hollow model, applying laminated composite tube theory [23], Placet et al [22] concluded that in hemp fibers the fraction of crystalline cellulose, the microfibril angle, the amorphous cellulose shear modulus and the crystalline cellulose elastic modulus are the main factor for the E vs. d correlation. The authors also emphasized the importance of the fiber lumen, which is also a kind of defect, although with lower sensitivity in their analysis. In spite of the extensive study, the Placet et al [22] work was not able to end up with a specific mathematical relationship between E andd. Therefore, the present work presents, for the first time, a hyperbolic equation on the E vs. d dependence. In the case of curaua fibers, this relationship would be like those shown in Eq. (2) and (3).
As for the mechanism responsible for the E vs. d inverse correlation, an experimental fact reported by Placet et al [22] suggests that defects/flaws/irregularities might play a major role, just as in the case of the
σ
vs. d inverse correlation [20, 21]. Indeed, a high positive linear correlation between
σ
andE for an extensive range of fiber diameters was presented by Placet et al [22] and attributed in 1980 [24] to a decrease in microfibril angle and increase in cellulose content. Since these ideas were never experimentally verified, theσ
vs. E linear correlation might as well indicate that defects/flaws/irregularities are the main responsible for the E vs. d inverse correlation.Figure 8 shows SEM fractographs of the tip of tensile-ruptured curaua fibers with different diameters. It can be seen in this figure that the thinner fiber with d = 0.08 mm, Figure 8(a), displays a fracture associated with lesser microfibrils. By contrast, the thicker fiber, with d= 0.12 mm, Figure 8(b), shows a heterogeneous fracture comprising relatively more microfibrils. As a consequence, there is a higher statistical chance that the thicker curaua fiber would prematurely break at lower stress than the thinner one.
In fact, in two regular distribution of microfibrils with comparable mechanical properties, associated with two fibers with different diameters, that with greater number (thicker fiber) has the probability of comprising stronger as well as weaker fibrils as compared to that with lesser (thinner fiber) number. Therefore, in a tensile test the first microfibril (the weakest) in the ticker fiber, Fig 8(b), should break at a stress level lower than that required for any fibril in the thin fiber, Figure 8(a). The discontinuous rupture of microfibrils, associated with serrations in the load vs. elongation curves in Figure 4, could contribute to decrease the value of the elastic modulus.
As a final remark, it is worth speculating that an inverse correlation between elastic modulus and diameter, such as the hyperbolic in Eq. (2) and (3) could, in principle, permit to select the thinnest curaua fibers as probably the stiffer alternative for reinforcing composites with improved properties.
Figure 8: SEM fractographs with same magnification of tensile-ruptured curaua fibers with different diameters: (a) thinner, d = 0.08 mm and (b) thicker, d = 0.12 mm.
4. CONCLUSIONS
1. A Weibull statistical analysis of the elastic modulus of curaua fibers, showed an inverse correlation with their diameters. This correlation adjusts well to a hyperbolic type of equation for both the Weibull average elastic modulus and the characteristic elastic modulus.
2. The fracture tip of the fibers also revealed a mechanism of longitudinal crack propagation between microfibrils before the final fiber break down. It is suggested that this mechanism would be associated with the premature rupture of a thicker fibers as compared to a thinner one with less
53 microfibrils. The decrease in the load vs. elongation slope due to serrations caused by the rupture of the microfibrils also explains the elastic modulus inverse correlation.
3. Already proposed mechanisms due to morphological, structural and ultrastructural effects would, in principle, account for the inverse correlation. However, experimental evidences suggest that the same mechanism for the tensile strength inverse correlation with the fiber diameter, based on the microstructure defects/flaws/irregularities also apply for the elastic modulus.
5. ACKNOWLEDGEMENTS
The authors thank for the support to this investigation by the Brazilian agencies: CNPq, CAPES and FAPERJ.
6. REFERENCES
[1] NAM, S., NETRAVALI, A.N., “Green composites. I. Physical properties of ramie Fibers for environment-friendly green composites”, Fibers and Polymer, v. 7, n. 4, pp. 372 -379, 2006.
[2] A. GORE, An inconvenient truth - The planetary emergency of global warming and what we can do about it, Emmanaus, PA, USA, Rodale Press, 2006
[3] SATYANARAYANA, K.G., GUIMARÃES, J.L., WYPYCH, F., “Studies on lignocellulosic fibers of Brazil. Part I: Source, production, morphology, properties and applications”, Composites: Part A, v. 38, pp. 1694-1709, 2007
[4] BLEDZKI, A.K., GASSAN, J., “Composites reinforced with cellulose-based fibers”, Progress in
Polymer Science, v. 4, pp. 221-274, 1999.
[5] NABI-SAHED, D., JOG, .J.P., “Natural fiber polymer composites: a review”, Advances Polymer
Technology, v. 18, pp. 221-274, 1999.
[6] EICHHORN, S.J., BAILLIE, C.A., ZAFEIROPOULOS, N., et al.,“Review of current international
research into cellulosic fibres and composites”, Journal Materials Science, v. 36, pp. 2107-2113, 2001.
[7] MOHANTY, A.K., MISRA, M., DRZAL, L.T., “Sustainable biocomposites from renewable resources: opportunities and challenges in the green material world”, Journal of Polymer Environment, v. 10, pp. 9-26, 2002.
[8] WAMBUA P., IVENS I., VERPOEST I., “Natural fibers: can they replace glass and fibre reinforced plastics”?, Composites Science and Technology, v. 63, p. 1259-1264, 2003.
[9] CROCKER, J., “Natural materials - Innovative natural composites”, Materials and Technology., v. 2-3 n. 3 pp. 174-178, 2008.
[10] MONTEIRO S.N., LOPES, F.P.D., FERREIRA, A.S., et al., “Natural fiber polymer matrix composites:
cheaper, tougher and environmentally friendly”, JOM, v. 61, n. 1, pp. 17-22, 2009.
[11] LARBIG, H., SCHERZER, H., DAHLKE, B., et al., “Natural fiber reinforced foams based on
renewable resources for automotive interior applications” Journal of Cellular Plastics, v. 34 pp. 361-379,
1998.
[12] MARSH, G. “Next step for automotive materials”, Materials Today, v. 6, n.4, pp.36-43, 2003. [13] ZAH, R., HISCHIER, R., LEÃO, A.L., et al., “Curaua fibers in automobile industry – A sustainability assessment”, Journal Cleaner Production, v. 15, pp. 1032-1040, 2007.
[14] AMERICAN SOCIETY FOR TESTING AND MATERIALS., “Standard Test Method for Tensile Properties of Single Textile Fibers”, ASTM D 3822-07, Janeiro, pp. 10, 2007.
[15] MONTEIRO, S.N., SATYANARAYANA, K.G., LOPES, F.P.D., “High strength natural fibers for improved polymer matrix composites”, Materials Science Forum, v. 638-642, pp. 961-966, 2010. [16] BEVITORI, A.B., SILVA, I.L.A., MONTEIRO, S.N., et al, “Weibull analysis of the tensile strength variation with diameter for jute fibers”. In: Biomaterials Symposium, First TMS-ABM International Materials
Congress. Rio de Janeiro, Brazil, pp. 1-10, 2010.
[17] COSTA, L.L., LOIOLA, R.L., MONTEIRO, S.N., “Tensile strength of bamboo fibers: Weibull analysis to characterize the diameter dependence”. In: Biomaterials Symposium, First TMS-ABM International
54 [18] SANTAFE, H.P.G., MONTEIRO, S.N., COSTA, L.L., et al, “Weibull distribution as an instrument of statistical analysis for coir fiber tensile tests” (in Portuguese), In: 64rd International Congress of the Brazilian
Association for Metallurgy and Materials, Belo Horizonte, Brazil, pp.1-12, 2009.
[19] NASCIMENTO, D.C.O., MOTTA, L.C., MONTEIRO, S.N., “Weibull analysis of tensile tested piassava fibers with different diameters”, In: Characterization of Minerals, Metals and Materials – TMS 2010, Seattle, USA. pp. 1-8, 2010.
[20] MONTEIRO S.N., LOPES, F.P.D., BARBOSA, A.P., et al, “Natural lignocellulosic fibers as engineering materials – An overview”, Met Materials, Trans A v. 42, pp. 2963-2974, 2011.
[21] FAN, M. “Characterization and performance of elementary hemp fibers: factors influencing tensile strength”, Bioresources. v. 5(4), pp. 2307-2322, 2010.
[22] PLACET, V, TRIVAUDEY, F., CISSE, O., et al., “Diameter dependence of the apparent tensile modulus of hemp fibers: A morphological, structural or ultrastructural effect?”. Composites Part A. v. 43, pp. 275-287, 2012.
[23] MARKLUND, E., VARNA, J., “Modeling the effect of helical fiber structure on wood fiber composite elastic properties”, Applied Composite Materials, v. 16, pp. 245-262, 2009.