ISSN 1517-7076 artigo e-12254, 2018
Autor Responsável: Denise Cristina de O. N. Ferreira Data de envio: 16/08/2017 Data de aceite: 20/04/2018
10.1590/S1517-707620180004.0588
Weibull analysis of tensile tested piassava
fibers with different diameters
Denise Cristina de Oliveira Nascimento Ferreira1, Ailton da Silva Ferreira2,Sergio Neves Monteiro3
1 ,2 Departamento Administração, UFF – Universidade Federal Fluminense, Macaé, Rio de Janeiro, Brasil. 3 IME- Instituto Militar de Engenharia, Rio de Janeiro, Rio de Janeiro, Brasil.
e-mail: [email protected], [email protected], [email protected]
ABSTRACT
Environmental considerations in addition to technical, economical and societal benefits are increasingly promoting the substitution of natural fibers for glass fiber in polymer matrix composites. However, natural fibers are heterogeneous in their dimensions, specially the cross section, which plays an important role in their mechanical strength. It has been found that the equivalent diameter of fibers such as sisal, ramie, pinea-pple and curaua correlates to different levels of tensile resistance. Piassava is a promising stiff natural fiber for composite reinforcement. In this work, a statistical analysis of tensile strength of piassava fibers using the Weibull methodology was performed. An attempt to correlate the fiber strength, obtained in tensile tests, with the diameter, precisely measured by means of a profile projector, was carried out. The results revealed an inverse dependence between the piassava fiber diameter and corresponding tensile strength. Fracture tip observation by SEM suggested a possible mechanism that could justify this inverse correlation.
Keywords: piassava fiber, testing traction, strength/diameter correlation.
1. INTRODUCTION
In the past decades, both the increase in the price of the petroleum and climate changes due to greenhouse gas emissions, are motivating the use of renewable and low cost natural material as substitute for energy intensive and CO2 contributor synthetic materials [1]. A typical case is that of natural cellulose-based fibers extracted from cultivated plants in comparison to glass fiber, which is extensively used as composite rein-forcement. In fact, these natural lignocellulosic fibers are increasingly being investigated [2-6] as possible reinforcement of polymeric composites and in some cases successfully replacing glass fiber composites in engineering applications [7]. The automobile industry has remarkable examples of lignocellulosic fiber com-posites substitution [8-10]. Not only some of these fibers display specific mechanical properties comparable to glass fibers but their composites are also associated with lower equipment wear and better finishing of molded components [6].
A relevant difference between lignocellulosic and synthetic fibers is the dimensional uniformity. On a practical view point, as biomaterials, natural fibers have length and cross section dimensions that are limited by anatomical restrictions. For instance, the equivalent diameter, i.e., the average of cross section width and thickness, always displays an accentuated dispersion in values [6]. However, in some fibers, this natural dispersion correlates with different levels of strength. It has been found [11] that lignocellulosic fibers such as sisal, ramie, pineapple and curaua show and inverse variation of their tensile strength with corresponding equivalent diameter. In other words, thinner fibers are stronger.
Among less used lignocellulosic fibers, the one extracted from the piassava palm tree (Attalea funif-era) has been the subject of a considerable number of publications [6,12-20], just to mention a few. Figure 1
illustrates the appearance of piassava trees, bundle of extracted fibers and SEM detail of the fibers surface. Its stiffness and lower cost are additional motivations for engineering applications in polymer composites. In spite of the intensive research efforts, so far, the possibility of a correlation between the strength and the diameter of the piassava fibers has not been investigated.
pro-file projector and Weibull analysis of the recorded data.
Figure 1: (a) Piassava palm trees in the state of Bahia, Brazil; (b) piassava fibers; (c) piassava fibers 2000X
2. MATERIALS AND METHODS
The piassava fibers investigate were supplied by a broom industry in Campos dos Goytacazes, state of Rio de Janeiro, Brazil. From the as-received lot, one hundred fibers were randomly taken for a statistic dimensional analysis. Figure 2 presents the statistical distribution of the equivalent diameter measured by a Nikon profile projector along the fiber length in five distinct locations.
0.20 0.45 0.70 0.95 1.20 1.45 1.70 1.95 2.20 2.45 0
4 8 12 16 20 24 28 32
F
requenc
y
(%)
Diameter (mm)
Figure 2: Statistical distribution of diameter of the piassava fibers.
Based in the histogram of Figure 2, the average diameter was measured as 1.0 mm and nine diameter intervals were considered. For each interval in Fig. 2, 20 fibers were then selected, through profile projector measurements. All this fibers were individually tensile tested at a temperature of 25 2oC in a model 5582 universal Instron machine. Especial tensile grips were used to avoid both slippage and damage of the fiber. The test strain rate was 4.2 x 10⁻⁴s-1. The values obtained for the tensile strength were interpreted by means of the Weibull statistics using the computer program Weibull Analysis.
To complement this strength vs. diameter investigation, the fracture of some tested fibers were
at-tached with carbon tape to a metallic support, gold sputtered and then observed by scanning electron micros-copy, SEM, in a model a model SSX-550 Shimadzu microscope operating at an accelerating voltage of 7- 15 kV.
3. RESULTS AND DISCUSSION
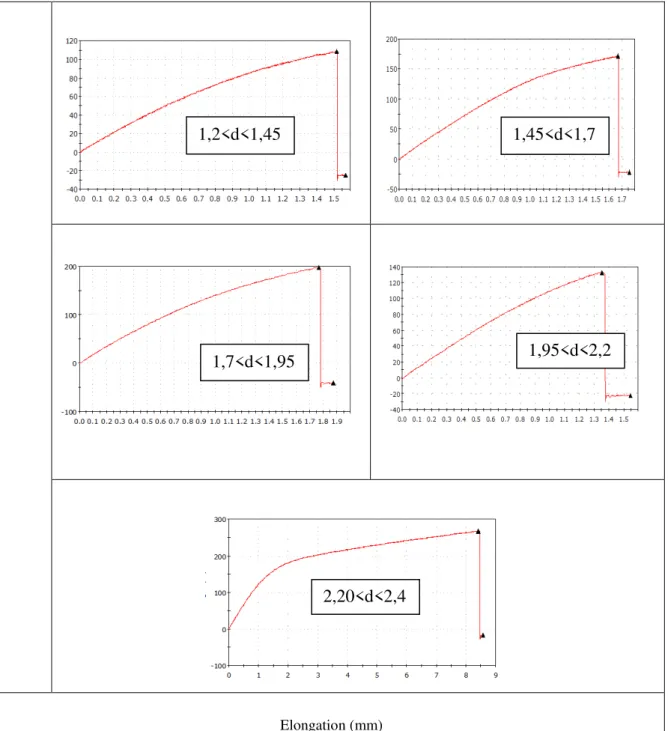
The digital recorded data acquired by the Instron machine permitted to plot load vs. elongation curves like those exemplified in Fig. 3. In these curves, it should be noted that the load vs. elongation graphs present common characteristics. After the linear elastic segment and some plastic extension, a point of maximum load occurs indicating an elasto-plastic behavior. Furthermore, most curves display serrations followed by a
drop in fiber resistance until complete rupture. These serrations are associated with partial rupture of the many fibrils that compose the piassava fiber [20]. Here it is important to mention that the thinner the fiber, the lower the number of its fibrils. The results the researches showed a decrease in both the tensile strength and the elastic modulus of the composites up to 30% with an increase at 40% of piassava fibers to values above those of the pure epoxy. The fracture analysis revealed a weak fiber/matrix interface, which could account for the comparative low performance of these composite in tensile tests up to 30% of volume frac-tion. The relatively large amount of stronger piassava fibers accounts for the better performance of the com-posite with 40% in volume fraction [21]. This fact will be further discussed in the present work.
Based on all tensile results such as the ones exemplified in Fig. 3, the ultimate stress, i.e., the tensile strength was calculated. The values of the tensile strength were analyzed by the Weibull statistic method for a possible number of fibers in association with each of the nine diameter intervals shown in the histogram of Fig. 2. The Weibull Analysis program provided the graphs shown in Fig. 4 as well as the corresponding (characteristic stress), β (Weibull modulus) and R2 (precision adjustment) parameters. All graphs in Fig. 4 are unimodal, i.e., with one fitting straight line. This indicates that the fibers in each one of the nine intervals of diameters, histogram in Fig. 2, display the same behavior.
Figure 5 presents the variation of the characteristic stress with the mean fiber diameter for each inter-val in the histogram of Fig. 2. In this figure, there is a clear tendency for the Weibull characteristic stress to vary in an inverse manner with the mean piassava fiber diameter. In other words, the thinner the fiber, the higher the characteristic stress. The corresponding values for the Weibull modulus, β, and precision adjust-ment, R2, statistically support the inverse correlation between the characteristic stress, , and the mean diam-eter, d. In fact, through a mathematical correlation, a hyperbolic equation was found to fit the data in Fig. 5.
= 476/d - 231 (1)
L
oad
(
N)
0,2<d<0,45
0,45<d<0,7
Elongation (mm)
Figure 3: Typical tensile load vs. diameter of piassava fibers for the distinct intervals in the histogram of Fig. 2.
I Weibull Probability Plot
ln
[l
n
(
1
/R
e
li
a
b
il
it
y
)
]
ln(X - Location Parameter) -0.4
-0.9 -1.3 -1.7 -2.2 -2.6 -3.0 -3.5 -3.9 -4.4 0.0 0.4 0.9 1.3 1.7
4.5 4.9 5.2 5.6 6.0 6.3 6.7 7.1 7.5 7.8 8.2
ln
[l
n
(
1
/R
e
li
a
b
il
it
y
)
]
ln(X - Location Parameter) -0.61
-1.21 -1.82 -2.42 -3.03 -3.64 -4.24 -4.85 -5.45 -6.06 0.00 0.61 1.21 1.82 2.42
2.7 3.2 3.7 4.1 4.6 5.1 5.6 6.1 6.5 7.0 7.5
0,2<d<0,45
0,45<d<0,7
1,2<d<1,45
1,45<d<1,7
1,7<d<1,95
1,95<d<2,2
0
ln [l n ( 1 /R e li a b il it y ) ]
ln(X - Location Parameter) -0.6 -1.3 -1.9 -2.5 -3.2 -3.8 -4.5 -5.1 -5.7 -6.4 0.0 0.6 1.3 1.9 2.5
1.8 2.3 2.7 3.2 3.6 4.1 4.6 5.0 5.5 5.9 6.4
Weibull Probability Plot
ln [l n ( 1 /R e li a b il it y ) ]
ln(X - Location Parameter) -0.5 -1.0 -1.6 -2.1 -2.6 -3.1 -3.6 -4.1 -4.7 -5.2 0.0 0.5 1.0 1.6 2.1
2.9 3.2 3.5 3.9 4.2 4.5 4.8 5.1 5.5 5.8 6.1
Weibull Probability Plot
ln [l n ( 1 /R e li a b il it y ) ]
ln(X - Location Parameter) -0.5 -1.1 -1.6 -2.2 -2.7 -3.3 -3.8 -4.4 -4.9 -5.5 0.0 0.5 1.1 1.6 2.2
3.5 3.7 3.9 4.0 4.2 4.4 4.6 4.8 4.9 5.1 5.3
Weibull Probability Plot
ln [l n ( 1 /R e li a b il it y ) ]
ln(X - Location Parameter) -0.5 -0.9 -1.4 -1.8 -2.3 -2.7 -3.2 -3.7 -4.1 -4.6 0.0 0.5 0.9 1.4 1.8
3.2 3.3 3.4 3.5 3.6 3.8 3.9 4.0 4.1 4.2 4.3
ln [l n ( 1 /R e li a b il it y ) ]
ln(X - Location Parameter) -0.5 -1.1 -1.6 -2.1 -2.7 -3.2 -3.8 -4.3 -4.8 -5.4 0.0 0.5 1.1 1.6 2.1
3.8 4.0 4.1 4.3 4.5 4.6 4.8 5.0 5.2 5.3 5.5
ln [l n ( 1 /R e li a b il it y ) ]
ln(X - Location Parameter) -0.5 -0.9 -1.4 -1.8 -2.3 -2.7 -3.2 -3.7 -4.1 -4.6 0.0 0.5 0.9 1.4 1.8
3.2 3.3 3.4 3.5 3.6 3.8 3.9 4.0 4.1 4.2 4.3
ln [l n (1 /R e li a b il it y )]
ln(X - Location Parameter) -0.41 -0.81 -1.22 -1.63 -2.03 -2.44 -2.85 -3.26 -3.66 -4.07 0.00 0.41 0.81 1.22 1.63
3.30 3.36 3.42 3.48 3.54 3.60 3.66 3.72 3.78 3.84 3.90
Figure 4: Weibull graphs for the different intervals in the histogram of Fig. 2.
0,7<d<0,95
0,95<d<1,2
1,2<d<1,45
1,45<d<1,7
1,95<d<2,20
1,7<d<0,1,955
0,0 0,5 1,0 1,5 2,0 2,5 0
300 600 900 1200 1500
We
ib
u
ll
Ch
a
ra
c
te
risti
c
Str
e
s
s
(
MP
a
)
Mean Diameter
(mm
)
0 2 4 6 8 10
0 2 4 6 8 10
Figure 5: Variation of the characteristic stress with the mean diameter for each interval in Fig.2.
In order to verify the physical significance of Eq. (1), the average tensile strength,
m, calculated forthe piassava fibers was plotted as a function of the means diameter in Fig. 6. In this figure, within the error bars associated with the standard deviations, an unequivocal hyperbolic inverse correlation also exists be-tween
m and d.
m= 396/d - 136 (2)0.0 0.5 1.0 1.5 2.0 2.5
0 500 1000 1500 2000 2500
T
ens
ile Strength (MPa)
Mean Diameter (mm)
Figure 6: Variation of the average tensile strength with the diameter for each interval in Fig.2.
the piassava fibers. Similar results have recently been reported for curaua, sisal, and ramie fibers [11]. A SEM observation of the tip of tensile-ruptured piassava fibers, Fig. 7, provided additional evidence for the rupture mechanism related to the hyperbolic strength/diameter correlation. The fiber with smaller diameter, Fig 7(a) displays a more uniform fracture associated with lesser fibrils. By contrast, the fiber with larger diameter, Fig. 7(b), shows a heterogeneous fracture associated with more fibrils. These microstructure evi-dences indicate that there is a higher statistical chance that one of the many fibrils of the thicker piassava fiber, Fig. 7(b), could prematurely break and then nucleates the fiber rupture at a lower stress. Statistically, the many fibrils of a thicker piassava fiber tend to have one of them braking shortly during the application of a tensile load, as compared to the fewer fibrils of a thinner fiber.
Figure 7: SEM fractograph of tips of tensile-ruptured piassava fibers:
(a) thinner, d = 0.3 mm and (b) thicker, d= 1.8 mm
Finally, it is worth mentioning that a hyperbolic correlation, Eq. (1) and (2) could in practice allow a selection of stronger piassava fibers, with smaller diameters, to reinforce polymer composites with improved mechanical properties.
4. CONCLUSIONS
A Weibull statistical analysis of tensile-tested piassava fibers revealed an inverse hyperbolic correlation between the ultimate stress and the fiber diameter.
SEM observations provided evidences of a possible mechanism of premature rupture of the greater diameter (thicker) piassava fibers due to a non-uniform participation of the fibrils.
These results support the selection of shorter diameter (thinner) piassava fibers as the strongest for reinforcement of composites with improved mechanical performance.
5. ACKNOWLEDGEMENTS
The authors thank the support to this investigation by the Brazilian agencies: CNPq, CAPES, FAPERJ and TECNORTE/FENORTE.
6. BIBLIOGRAPHY
[1] GORE, A. An Inconvenient Truth. The Planetary Emergency of Global Warming and What We Can do
About It (Emmaus, Pennsylvania, USA: Rodale Press, 2006).
[2] BLEDZKI, A .K.., GASSAN, J. “Composites Reinforced With Cellulose-Based Fibers”,Prog. Polym. Sci, v. 4, pp. 221-274, 1999.
[3] NABI SAHED, D., JOG, J.P. “Natural fiber polymer composites: a review”, Advances in Polymer Tech-nol., v. 18, pp. 221-274, 1999.
[4] MOHANTY, A.K., MISRA, M., HINRICHSEN,G., “Biofibers, biodegradable polymers and biocomp o-sites: an overview”, Macromol. Mat. and Engineering, v. 276/277, pp. 1-24, 2000.
[5] EICHHORN, S.J., BAILLIE, C.A., ZAFEIROPOULOS, N., et al., “Review of current international r
e-search into cellulosic fibres and composites”, J. Mater. Science, v. 36, pp. 2107-2113, 2001.
[6] MONTEIRO, S.N., LOPES, F.P.D., FERREIRA, A.S., “Natural fiber polymer matrix composites: chea p-er, tougher and environmentally friendly”, JOM, v.61, pp. 17-22, 2009.
[7] WAMBUA, P., IVENS, I.,VERPOEST, I. “Natural fibers: can they replace glass and fibre reinforced plastics?”, Composites Science and Technology, v. 63, pp. 1259-1264, 2003.
[8] HILL, S. “Cars that grow on trees”,New Scientists, v.153, pp. 36-39, 1997.
[9] MARSH, G. “Nextstep for automotive materials”,Mater. Today, v.6, n.4, pp. 36-43, 2003.
[10] ZAH, R., HISCHIER, R., LEÃO A.L., et al., “Curaua fibers in automobile industry – A sustainability assessment”, J. Cleaner Production, v.15, pp.1032-1040, 2007.
[11] MONTEIRO, S.N., SATYANARAYANA, K.G., LOPES, F.P.D. “High strength natural fibers for i m-proved polymer matrix composites”, Proceedings of the International Conference on Processing &
Manufac-turing of Advanced Materials – THERMEC 2009, Berlin, Germany, August, pp.1-6, 2009.
[12] SCHUCHARDT, U., BIANCHI, M.L., GONÇALVES, A.R., et al., “Piassava fibers (Attalea funifera) I:
Chemical analysis, extraction and reactivity of its lignin”, Cellulose Chem. & Tech., v.29, pp. 705–712, 1995.
[13] AQUINO, R.C.M.P., D’ALMEIDA, J.R.M., MONTEIRO, S.N., “Analysis and characterization of pia s-sava fibers”, Acta Microscopica, v. 9(A), pp. 3–4, 2000.
[14] AQUINO, R.C.M.P., D’ALMEIDA, J.R.M., MONTEIRO, S.N. “Flexural Mechanical Properties of Piassava Fibers (Attalea funifera)-Resin Matrix Composites”, J. Mater. Sci. Letters, v. 20, pp. 1017-1019, 2001.
[15] AQUINO, R.C.M.P., MONTEIRO, S.N., D’ALMEIDA, J.R.M. “Evaluation of the Critical Fiber Length of Piassava (Attalea funifera) Fibers using the Pullout Test”, J. Mater. Sci. Letters, v.22, pp.1495-1497, 2003.
[16] DEUS, J.F., MONTEIRO, S.N., D’ALMEIDA, J.R.M. “Effect of Drying, Molding Pressure, and Strain Rate on the Flexural Mechanical Behavior of Piassava (Attalea funifera Mart) Fiber-Polyester Composites”,
Polymer Testing, v.24, pp.750-755, 2005.
[17] D'ALMEIDA, J.R.M., AQUINO, R.C.M.P., MONTEIRO, S. N. “Tensile Mechanical Properties, Mor-phological Aspects and Chemical Characterization of Piassava (Attalea funifera) Fibers”,Composites. Part A, v. 37 , pp. 1473-1479, 2006.
[18] D'ALMEIDA, J.R.M., AQUINO, R.C.M.P., MONTEIRO, S. N. “Dynamic mechanical behavior of piassava fibers (Attalea funifera) reinforced polyester composites”, Int. J. Polym. Mater., v.56 , pp. 397–403, 2007.
[19] ELZUBAIR, A., BONELLI, C.M.C., SUAREZ, J.C.M., et al., “Morphological, structural, thermal and mechanical characterization of piassava fibers”, J. Natural Fibers, v. 4, n.2, pp. 13–31, 2007.
[20] MONTEIRO, S.N. “Properties and Structure of Attalea funifera piassava fibers for composite
rein-forcement”, J. Natural Fibers, v.6, n.2, pp. 191–203, 2009.